This document provides an overview of D3, a JavaScript library for manipulating documents based on data. It discusses what D3 is, provides examples of D3 visualizations, and covers key D3 concepts like selecting elements, binding data, scales, transitions, and axes. The document also includes links to resources for learning more about using D3.


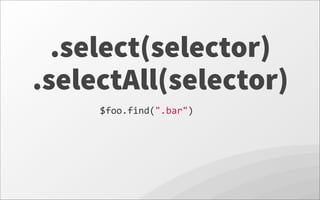

![.attr(prop [,value])
setter / getter for attribute values](https://image.slidesharecdn.com/utahjsd3-130708153751-phpapp01/85/Utahjs-D3-13-320.jpg)
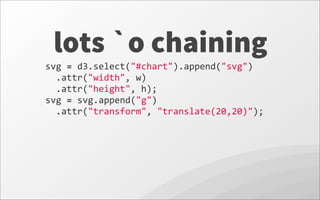


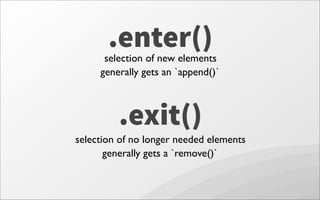
![.enter()selection of new elements
generally gets an `append()`
data
=
[50,
50,
50];
?](https://image.slidesharecdn.com/utahjsd3-130708153751-phpapp01/85/Utahjs-D3-19-320.jpg)
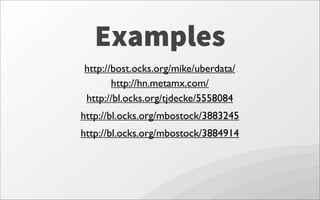
![.enter()selection of new elements
generally gets an `append()`
data
=
[50,
50,
50];
element in enter selection](https://image.slidesharecdn.com/utahjsd3-130708153751-phpapp01/85/Utahjs-D3-20-320.jpg)
![data
=
[50,
50];
.exit()
selection of no longer needed elements
generally gets a `remove()`](https://image.slidesharecdn.com/utahjsd3-130708153751-phpapp01/85/Utahjs-D3-21-320.jpg)
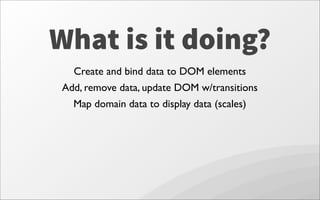
![data
=
[50,
50];
element in exit selection
.exit()
selection of no longer needed elements
generally gets a `remove()`](https://image.slidesharecdn.com/utahjsd3-130708153751-phpapp01/85/Utahjs-D3-22-320.jpg)
![scales
yScale
=
d3.scale.linear()
.domain([
0,
d3.max(dataset)
])
.range([
0,
h
]);
domain 890
range 5800](https://image.slidesharecdn.com/utahjsd3-130708153751-phpapp01/85/Utahjs-D3-24-320.jpg)
![scales for color
colorScale
=
d3.scale.category20c();
https://github.com/mbostock/d3/wiki/Ordinal-Scales#categorical-colors
colorScale
=
d3.scale.linear()
.domain([0,
d3.max(dataset)])
.range(["blue",
"green"]);
or](https://image.slidesharecdn.com/utahjsd3-130708153751-phpapp01/85/Utahjs-D3-26-320.jpg)
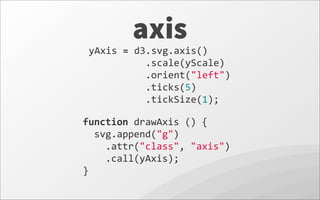
![axis
Rethink height and y for bars.
Swap yScale range
.attr("height",
function(d,i){
return
h
-‐
yScale(d)})
.attr("y",
function(d,i){
return
h
-‐(h
-‐
yScale(d))})
.range([
h,
0
]);](https://image.slidesharecdn.com/utahjsd3-130708153751-phpapp01/85/Utahjs-D3-30-320.jpg)


![[JS EXPERIENCE 2018] Jogos em JavaScript com WebGL - Juliana Negreiros, Codem...](https://cdn.slidesharecdn.com/ss_thumbnails/15h20-15h50-juliananegreiros-180706162350-thumbnail.jpg?width=640&height=640&fit=bounds)


