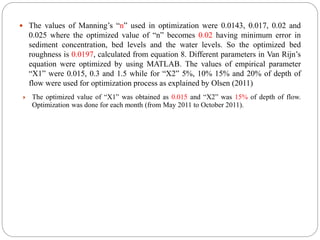
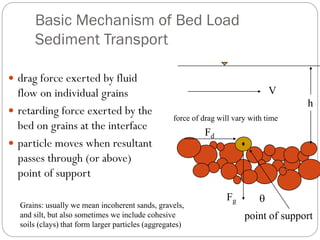
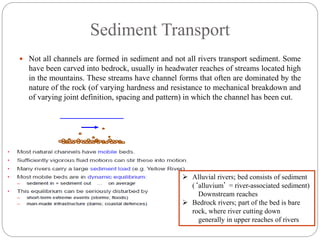
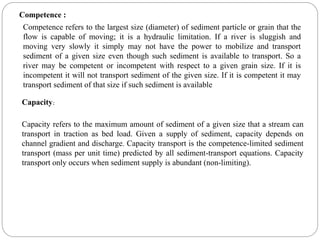
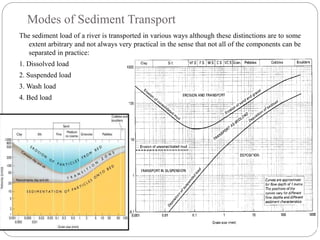
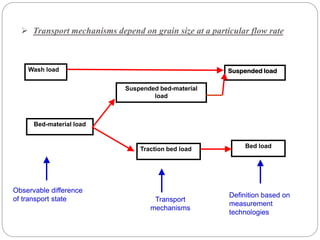
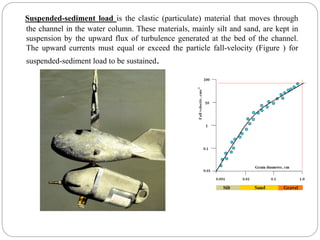
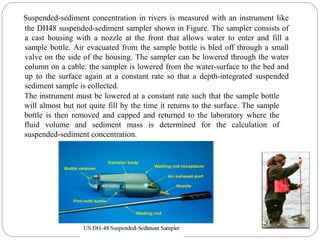
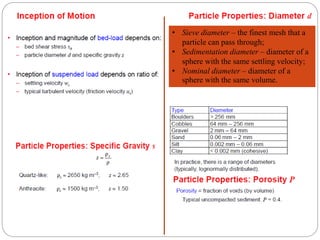
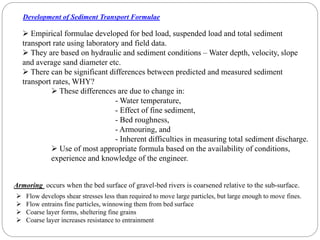
Dr. Shahid Ali discusses sediment transport in rivers. There are 3 main types of sediment transport:
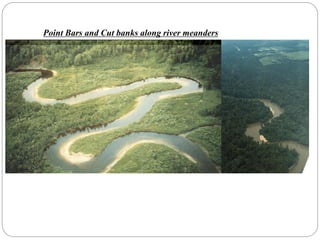
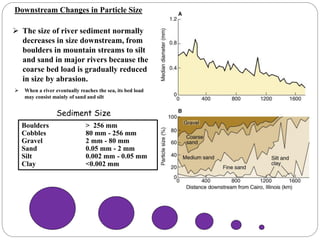
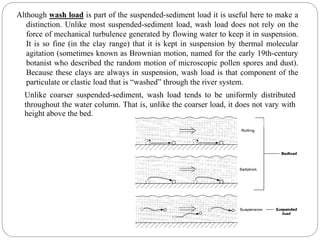
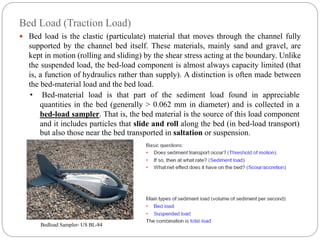
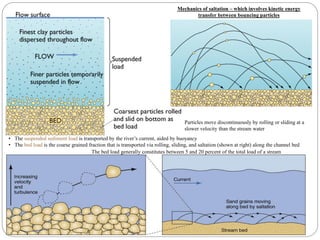
1) Suspended sediment moves through turbulence in the water column. 2) Bedload moves along the river bed through rolling and sliding. 3) Washload is fine sediment that remains suspended through Brownian motion. The size of sediment generally decreases downstream as larger particles are abraded. Sediment transport formulas have been developed but have limitations due to complex field conditions.

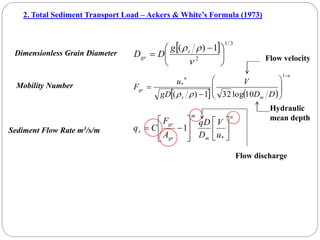
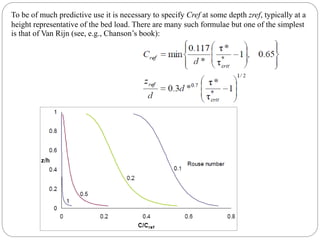
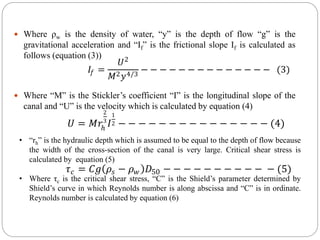
![Van Rijn’s Formula:
Where “Ca is the suspended sediment concentration,
“ X1”and “X2” are the parameters, D50 is the sediment particle diameter, ρS is the
density of sediments (2650 kg/m3), ρW is the density of water(1000kg/m3),υ is the
kinematic viscosity of water (10-6 m2/s) and g is the gravitational acceleration (9.81
N/m2), τ is the shear stress and τc is the critical bed shear stress determined by the
following equation (2)
𝐶𝑎 = 𝑋1
𝐷50
𝑋2
[
𝜏−𝜏𝑐
𝜏𝑐
]1.5
{𝐷50[
(𝜌𝑠−𝜌𝑤 )𝑔
𝜌𝑤 𝜐2 ]
1
3
}0.3
− − − (1)
𝜏 = 𝜌𝑤 𝑔𝑦𝐼𝑓 − − − − − − − − − − − − − − − 2](https://image.slidesharecdn.com/sedimenttransport9-210512051126/85/Sediment-transport9-32-320.jpg)
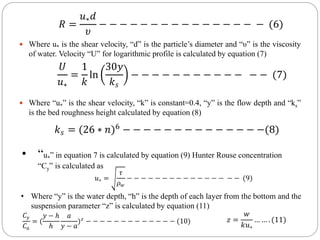
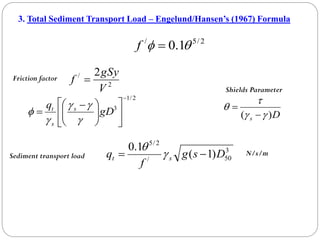
![ Root mean square error is calculated by
𝐸 =
1
𝑛
[
𝐶𝑠 𝑖 − 𝐶𝑜 𝑖
𝐶𝑠 𝑖
]2
− − − − − − − − − (12)
𝑛
𝑖=1
Cell no
(1)
Distance
from
bed(m)
(2)
Velocity(m/s)
(3)
Hunter
Rouse
Conc.(m3/m3)
(4)
Cell
height(m)
(5)
Cell flux
(m3/m3)
(6)=(3)*(4)*(5)
8 3.716 2.365 3.22669E-10 0.3912 2.98448E-10
7 3.325 2.334 2.03269E-08 0.3912 1.8559E-08
6 2.934 2.300 1.79447E-07 0.3912 1.61434E-07
5 2.543 2.261 9.272E-07 0.3912 8.19922E-07
4 2.151 2.215 3.88495E-06 0.3912 3.36596E-06
3 1.760 2.160 1.53559E-05 0.3912 1.29745E-05
2 1.369 2.091 6.43409E-05 0.3912 5.26315E-05
1 0.587 1.859 0.002934879 0.5867 0.003201703](https://image.slidesharecdn.com/sedimenttransport9-210512051126/85/Sediment-transport9-35-320.jpg)