
Recommended
More Related Content
What's hot
What's hot (20)
Similar to GIS RS Lab Report RQD SCR TCR Rock Cores
Similar to GIS RS Lab Report RQD SCR TCR Rock Cores (20)
Recently uploaded
Recently uploaded (20)
GIS RS Lab Report RQD SCR TCR Rock Cores
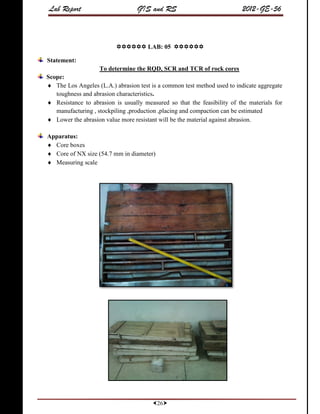
- 1. Lab Report GIS and RS 2012-GE-56 26 LAB: 05 Statement: To determine the RQD, SCR and TCR of rock cores Scope: The Los Angeles (L.A.) abrasion test is a common test method used to indicate aggregate toughness and abrasion characteristics. Resistance to abrasion is usually measured so that the feasibility of the materials for manufacturing , stockpiling ,production ,placing and compaction can be estimated Lower the abrasion value more resistant will be the material against abrasion. Apparatus: Core boxes Core of NX size (54.7 mm in diameter) Measuring scale
- 2. Lab Report GIS and RS 2012-GE-56 27 Related Theory Rock Quality Designation: The percentage of intact core pieces longer than 100 mm in the total length of core." The core should be at least NX size (54.7 mm in diameter).The RQD was developed by Deere in 1963 to provide a quantitative estimate of rock mass quality from drill core.RQD measure jointing and fracturing in rock which is indirectly measure of stresses in rock. Limitations: RQD is directional, but due to its definition it is more sensitive to the hole or line direction than joint spacing or fracture frequency measurements. For a particular section, RQD has variable values depending upon direction of run. Another drawback is that the RQD gives no information of the core pieces <10cm excluded, i.e. it does not matter whether the discarded pieces are earth-like materials or fresh rock pieces up to 10cm length. Volumetric joint count (JV) : Jv is defined as the number of joints intersecting a volume of one m³.When no core is available but discontinuity traces are visible in surface exposures or exploration, the RQD may be estimated from the number of discontinuities per unit volume. The suggested relationship for clay-free rock masses is: RQD = 115 - 3.3 Jv Where Jv is the sum of the number of joints per unit volume Classification Table: From the RQD index the rock mass can be classified as follows: RQD Rock mass quality <25% very poor 25-50% poor 50-75% fair 75-90% good 90-100% excellent
- 3. Lab Report GIS and RS 2012-GE-56 28 Solid Core Recovery: It is defined as the percentage ratio of solid core recovery to the total length of the core run. Solid core: Solid core is defined as the core with at least one full diameter measured along the core axis between the natural discontinuities. By this definition core that contains a single set of inclined discontinuities would have an SCR of 100%.Where there are two or more sets of non-parallel sets of discontinuities sections, they are not considered as solid cores. ×100 Fracture Index(FI): The minimum, maximum and average spacing of natural discontinuities in mm,measured along the core axis. Measured over core lengths of uniform characteristics not over the core runs. The boundaries between different zones correspond to boundaries between zones with different structural and discontinuity details. The detailed core logs a min thickness of 1m has been chosen to distinguish between zones of different characteristics. Total Core Recovery(TCR): It is the total length of the core recovered expressed as a percentage of the core run length ×100
- 4. Lab Report GIS and RS 2012-GE-56 29 Observations & Calculations: Box No.36 Sr. No Total length (inches) Depth (feet) Dip angle in degree Type Of discontinuity Cumulative length greater than 4 inch SCR inches 1420.166 1 6.12 1420.729 12 Natural 6.12 6.8 2 9.10 1421.530 25 Natural 15.22 9.10 3 19 1423.161 27 Induced 34.22 19.4 4 9.2 1423.921 20 Induced 43.62 8.6 5 4.12 1424.286 30 Induced 47.74 3.9 6 3.2 1424.539 20 Induced - 3.16 7 5.16 1424.997 20 Natural 52.9 5.8 8 6.14 1425.564 20 Natural 59.04 6.8 9 7.5 1426.173 26 Natural 66.54 7.3 10 14.1 1427.392 43 Natural 80.64 14.4 11 2.4 1427.569 26 Natural - 1.16 12 2.4 1427.746 25 Induced - 1.16 13 17.4 1429.183 28 Natural 98.04 16.9 14 9.9 1429.980 31 Natural 107.94 9.9 15 10.11 1430.870 20 Natural 118.05 10.4 16 2.15 1431.078 15 Natural - 2.7 17 7.6 1431.693 27 Induced 125.65 7.2 18 8.10 1432.374 18 Induced 133.75 8.8 19 9.12 1433.224 20 Induced 142.87 9.4 20 12.13 1434.292 45 Induced 155 12.5 21 5.18 1434.755 25 Natural 160.18 5.0 22 3.20 1435.057 30 Natural - 2.14 23 27.10 1437.359 40 Induced 187.28 26.19 24 14.18 1438.599 21 Induced 201.46 14.0 25 5.0 1439.016 20 Induced 206.46 4.17 26 39.10 1442.271 245.56 39.6
- 5. Lab Report GIS and RS 2012-GE-56 30 Total Core Run = 280 inches = 23.3 ft For RQD: RQD= [(cumulative length greater than 4)÷( Total core number) ×100% RQD = 87.5% For TCR: TCR = [(Total length)÷(Total core number)]×100% TCR = 92.39% For SCR: SCR = [(Total scr) ÷ (Total core number)]×100% SCR = 91.6% Result: On the basis of RQD we find this rock body is Good.
- 6. Lab Report GIS and RS 2012-GE-56 31 Box No. 5 Sr. No Total length (inches) Depth (feet) Dip angle in degree Type Of discontinuity Cumulative length greater than 4 inch SCR inches 722 1 1.5 722.125 20 Natural -- 1.25 2 15 723.25 20 Natural 15 14.5 3 6 723.757 25 Induced 21 5.37 4 10.37 724.614 20 Natural 31.37 9.68 5 2.75 724.843 10 Induced - 2.62 6 2.37 725.04 10 Induced - 2.15 7 1.75 725.186 10 Induced - 1.37 8 4 725.52 50 Natural 35.35 - 9 2.5 725.728 20 Natural - 2.5 10 14.37 726.925 20 Natural 49.74 13.88 11 14.25 728.113 26 Natural 63.99 13.75 12 10.25 728.967 20 Induced 74.24 9.75 13 4.37 729.331 30 Natural 78.61 3.62 14 2 729.498 20 Natural - 1.37 15 15 730.498 30 Natural 93.61 14.5 16 27.5 732.79 20 Induced 121.11 26.75 17 3.25 733.06 30 Induced - 2.37 18 2.37 733.258 20 Natural - 2 19 5 733.675 20 Natural 126.11 4.75 20 9 734.425 20 Natural 135.11 8.62 21 9 735.175 35 Natural 144.11 8.65 22 7 735.758 20 Natural 151.11 6.25 23 4.75 736.570 20 Induced 155.86 4.12 24 2.75 736.800 10 Natural - 1.88 25 2.25 736.987 10 Induced - 2.12 26 6.12 737.497 30 Induced 161.98 5.62 27 12 738.497 70 Natural 173.98 8.88 28 5.5 738.955 20 Induced 179.48 1.88 29 18 740.455 20 Induced 197.48 17.62
- 7. Lab Report GIS and RS 2012-GE-56 32 Total Core Run = 226 inches = 18.83ft For RQD: RQD= [(cumulative length greater than 4)÷( Total core number) ×100% RQD = 87.38% For TCR: TCR = [(Total length)÷(Total core number)]×100% TCR = 98.76% For SCR: SCR = [(Total SCR) ÷ (Total core number)]×100% SCR = 88.02% Result: On the basis of RQD we find this rock body is Good. Precautions: Fractures induced by handling or the drilling process should not be counted (the pieces broken by such fractures should be fitted together and their total length measured) and the pieces counted should be ‘hard and sound’. Depth of total core run and location should be mention on box. Principal joints direction and tunnel drive direction should be consider setting direction of core run. Comments: Most of the core samples have RQD ranging from good to excellent except for core #4 and same for total core recovery. References: http://www.astm.org/Standards/C131.htm http://www.astm.org/DATABASE.CART/HISTORICAL/C131-03.htm Lab o5 completed