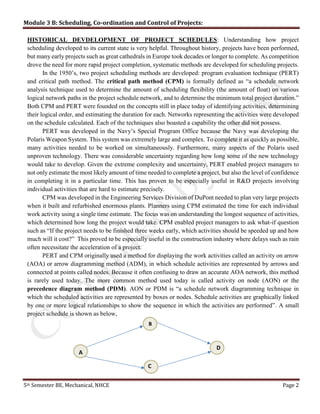
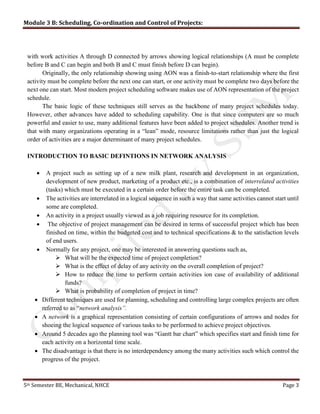
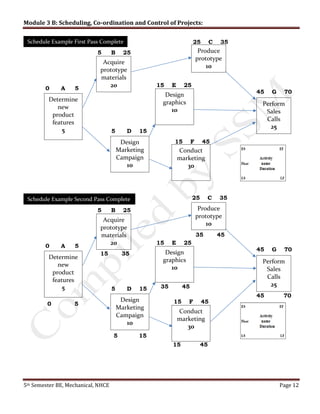
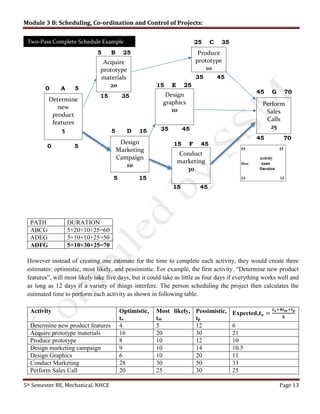
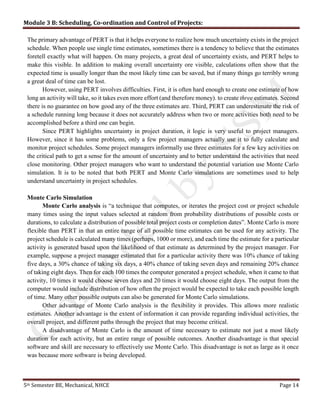
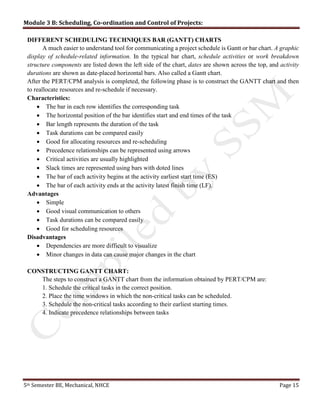
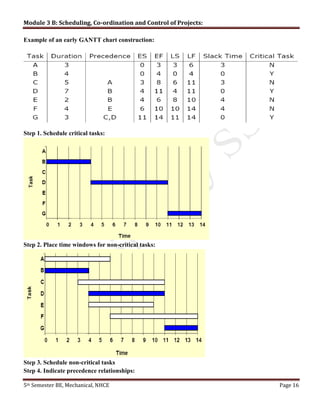
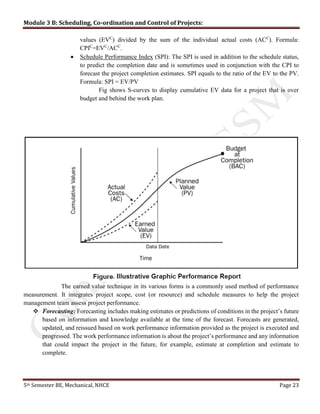
2017-2018 Module 3 B: Scheduling,
Co-ordination and Control
of Projects:
17MEE55
Compiled by: Somashekar S M, Assistant Professor
DEPARTMENT OF MECHANICAL ENGINEERING, NEW HORIZON
COLLEGE OF ENGINEERING, BENGALURU
Module 3 B: Scheduling, Co-ordination and Control of Projects:
5th Semester BE, Mechanical, NHCE Page 1
CONTENTS
 Purpose of a project schedule,
 Historical development,
 Uncertainty in project schedules,
 Different scheduling techniques bar (GANTT) charts,
 Bar charts for combined activities,
 Project evaluation and review techniques,
 PERT planning
 Project direction communication in a project,
 Role of MIS in project control,
 Performance control,
 Schedule control,
 Cost control cases.
SCHEDULING: Scheduling may be defined as the assignment of work to the facility with the specifications
of time and the sequence in which the work is to be done. The facility may be man power, machine or both.
PROJECT SCHEDULE: In a project management, a schedule is a listing of project’s milestones, activities,
and deliverables, usually with intended start and finished dates. A schedule is commonly used in the project
planning and project portfolio management parts of project management. The project schedule is the tool that
communicates what work needs to be performed, which resources of the organization will perform the work
and the time frames in which that work needs to be performed. The project schedule should reflect all of the
work associated with the delivering the project on time. Without a full and complete schedule, the project
manager will be unable to communicate the complete effort, in terms of cost and resources, necessary to deliver
the project.
PURPOSES OF PROJECT SCHEDULE: Projects are undertaken to accomplish important business
purposes and people often want to be able to use the project results as quickly as possible. Many specific
questions such as the following can be answered by having a complete and workable schedule.
 When will be the project complete?
 What is the earliest date at a particular activity can start, and when will it end?
 What activity must begin before which other activities can take place?
 What would happen if a delivery of material was one week late?
 Can a key worker take a week of vacation the first week of March?
 If one worker is assigned to do two activities, which one must go first?
 How many hours do we need from each worker next week or month?
 Which worker or other resource is a bottleneck, limiting the speed of our project?
 What will the impact be if the client wants to add another module?
 If I am willing to spend an extra Rs 10,00,000, how much faster can the project be completed?
 Are all of the activities completed that should be by now?
Module 3 B: Scheduling, Co-ordination and Control of Projects:
5th Semester BE, Mechanical, NHCE Page 2
HISTORICAL DEVDELOPMENT OF PROJECT SCHEDULES: Understanding how project
scheduling developed to its current state is very helpful. Throughout history, projects have been performed,
but many early projects such as great cathedrals in Europe took decades or longer to complete. As competition
drove the need for more rapid project completion, systematic methods are developed for scheduling projects.
In the 1950’s, two project scheduling methods are developed: program evaluation technique (PERT)
and critical path method. The critical path method (CPM) is formally defined as “a schedule network
analysis technique used to determine the amount of scheduling flexibility (the amount of float) on various
logical network paths in the project schedule network, and to determine the minimum total project duration.”
Both CPM and PERT were founded on the concepts still in place today of identifying activities, determining
their logical order, and estimating the duration for each. Networks representing the activities were developed
on the schedule calculated. Each of the techniques also boasted a capability the other did not possess.
PERT was developed in the Navy’s Special Program Office because the Navy was developing the
Polaris Weapon System. This system was extremely large and complex. To complete it as quickly as possible,
many activities needed to be worked on simultaneously. Furthermore, many aspects of the Polaris used
unproven technology. There was considerable uncertainty regarding how long some of the new technology
would take to develop. Given the extreme complexity and uncertainty, PERT enabled project managers to
not only estimate the most likely amount of time needed to complete a project, but also the level of confidence
in completing it in a particular time. This has proven to be especially useful in R&D projects involving
individual activities that are hard to estimate precisely.
CPM was developed in the Engineering Services Division of DuPont needed to plan very large projects
when it built and refurbished enormous plants. Planners using CPM estimated the time for each individual
work activity using a single time estimate. The focus was on understanding the longest sequence of activities,
which determined how long the project would take. CPM enabled project managers to ask what-if question
such as “If the project needs to be finished three weeks early, which activities should be speeded up and how
much will it cost?” This proved to be especially useful in the construction industry where delays such as rain
often necessitate the acceleration of a project.
PERT and CPM originally used a method for displaying the work activities called an activity on arrow
(AOA) or arrow diagramming method (ADM), in which schedule activities are represented by arrows and
connected at points called nodes. Because it often confusing to draw an accurate AOA network, this method
is rarely used today. The more common method used today is called activity on node (AON) or the
precedence diagram method (PDM). AON or PDM is “a schedule network diagramming technique in
which the scheduled activities are represented by boxes or nodes. Schedule activities are graphically linked
by one or more logical relationships to show the sequence in which the activities are performed”. A small
project schedule is shown as below,
B
A
C
D
Module 3 B: Scheduling, Co-ordination and Control of Projects:
5th Semester BE, Mechanical, NHCE Page 3
with work activities A through D connected by arrows showing logical relationships (A must be complete
before B and C can begin and both B and C must finish before D can begin).
Originally, the only relationship showing using AON was a finish-to-start relationship where the first
activity must be complete before the next one can start, or one activity must be complete two days before the
next one can start. Most modern project scheduling software makes use of AON representation of the project
schedule.
The basic logic of these techniques still serves as the backbone of many project schedules today.
However, other advances have added to scheduling capability. One is that since computers are so much
powerful and easier to use, many additional features have been added to project schedules. Another trend is
that with many organizations operating in a “lean” mode, resource limitations rather than just the logical
order of activities are a major determinant of many project schedules.
INTRODUCTION TO BASIC DEFINTIONS IN NETWORK ANALYSIS
 A project such as setting up of a new milk plant, research and development in an organization,
development of new product, marketing of a product etc., is a combination of interrelated activities
(tasks) which must be executed in a certain order before the entire task can be completed.
 The activities are interrelated in a logical sequence in such a way that same activities cannot start until
some are completed.
 An activity in a project usually viewed as a job requiring resource for its completion.
 The objective of project management can be desired in terms of successful project which has been
finished on time, within the budgeted cost and to technical specifications & to the satisfaction levels
of end users.
 Normally for any project, one may be interested in answering questions such as,
 What will be the expected time of project completion?
 What is the effect of delay of any activity on the overall completion of project?
 How to reduce the time to perform certain activities ion case of availability of additional
funds?
 What is probability of completion of project in time?
 Different techniques are used for planning, scheduling and controlling large complex projects are often
referred to as “network analysis”.
 A network is a graphical representation consisting of certain configurations of arrows and nodes for
shoeing the logical sequence of various tasks to be performed to achieve project objectives.
 Around 5 decades ago the planning tool was “Gantt bar chart” which specifies start and finish time for
each activity on a horizontal time scale.
 The disadvantage is that there is no interdependency among the many activities such which control the
progress of the project.
Module 3 B: Scheduling, Co-ordination and Control of Projects:
5th Semester BE, Mechanical, NHCE Page 4
 Now a day’s technical tool for planning, scheduling and controlling stages of projects known as
Critical Path Method (CPM) & Program/Project Evaluation Review Technique (PERT).
 The techniques of CPM/PERT prove extremely valuable in assisting managers handling such projects
and thus discharging their management responsibilities both at planning and controlling stages of the
projects.
 Both are basically time oriented methods laid to determination of time schedule for project.
 The main difference between the two techniques is that PERT is a “probabilistic approach” for the
determination of time estimated of different activities not exactly known to us.
 In the case of CPM, different estimates are known as “deterministic in nature”.
 But now days both these techniques are used for one purpose. Initially the PERT technique was applied
to research & development projects while the CPM was used towards construction projects.
METHODOLOGY IN CPM/PERT TECHNIQUES
The methodology involved in network scheduling by CPM/PERT for any project consists of the
following four stages.
 Planning: It is started by splitting the total project into smaller projects. The smaller projects are
further divided into different activities and are analyzed by a department or section. The relationship
of each activity with respect to other activities are defined and established.
 Scheduling: The objective of scheduling is to give the earliest and the latest allowable start and finish
time of each activity as well as its relationship with other activities in the project. The schedule must
pinpoint the critical path i.e., time activities which require special attention if the project is to
completed in time.
 Allocation of resource: Allocation of resources is performed to achieve the desired objective.
Resource is a physical variable such as labor, finance, space, equipment etc., which will impose a
limitation for a completion of project.
 Controlling: The final phase in the project management is controlling. After making the network plan
& identification of the critical path the project is controlled by checking the progress against the
schedule, assigning scheduling mana power & equipment & analyzing the effect of delays.
IMPORTANT DEFINITIONS:
 Network or Arrow diagram: In project scheduling, first step is to sketch an arrow diagram which
show interdependencies and precedence relationship among activities of project.
 Activity: Any individual operation which uses resources is called activity. An activity is represented
by an arrow with its head indicating the direction of progress in the project. The length, shape and
direction of arrows has no relation to the size of activity. Ex: Designing of parts, assembly of parts,
mixing of concrete etc.
 Predecessor activity: Activity that must be completed immediately prior to the start of another
activity.
 Successor activity: Activity that can’t be started until one or more of other activities are completed.
 Concurrent activity: Simultaneously occurring activity.
 Dummy activity: Activity which doesn’t consume any kind of resource and has technological
dependence.
Module 3 B: Scheduling, Co-ordination and Control of Projects:
5th Semester BE, Mechanical, NHCE Page 5
 Event: The beginning and end points of an activity are called events or nodes. It is represented by a
circle in the network. Ex: Assign, Completed, Design started. The event has three types
 Merge Event: When more than one activity comes and joins an event, such an event is known
as merge events.
 Burst Event: When more than one activity leaves an event is known as burst event.
Burst Event
 Merge and Burst Event: Combination of both
 Path: An unbroken chain of activity arrows connecting the initial event to some other event is called a
path.
Example: Various activities for a project of erection of steel work for a shed is given below:
Activity Description Preceded by
A Erection site workshop -
B Fence site -
C Bend reinforcement A
D Dig foundation B
E Fabricate A
F Install concrete pillars B
G Place reinforcement C, D
H Concrete foundation G, F
I Erect steel work E
J Paint steel work H, I
K Give finishing work J
Merge Event
A
B
E
F
D
G
C
JH
I
K
1 987
6
54
3
2
Module 3 B: Scheduling, Co-ordination and Control of Projects:
5th Semester BE, Mechanical, NHCE Page 6
TIME ESTIMATES AND CRITICAL PATH IN NETWORK ANALYSIS:
Once the network of the project is constructed, the time analysis of network becomes essential for
planning various activities of project. The critical path of a network gives the shortest time in which the entire
project can be completed. It is the chain of activities with longest time durations. These activities are critical
activities (They are critical because any delay in their activity results in the delay of project completion. There
may be more than one critical path in a network).
Critical path analysis consists of following steps:
 Calculate total completion time for the project- It involves calculation of project completion
time.
 Calculate time schedule for each activity- It involves the determination of time by which an
activity must begin and the time before which it must be completed. The time schedule data
for each activity include the calculation of EST, EFT LST, LFT and the float.
 Identify the critical activities and critical path.
Note: Some important definitions
i) EST (Early Start Time): It represents the time at which an activity can begin at the earliest.
ii) EFT (Early Finish Time): EST + Tij
These two are determined through forward pass method by proceeding progressively from left to right
(or) start event to end event. The EST for start event is zero.
iii) LFT (Latest Finish Time): It represents the time at which an activity can be completed without delaying
the completion of project.
iv) LST (Latest Start Time): LFT - Tij
These two are determined through backward pass method by proceeding progressively from right to
left or end event to start event. The LFT for end event is equal to its EST.
v) Float: Float of an activity is defined as the amount of time by which the completion of an activity can be
delayed without delaying the total project duration.
Float = LFT – EFT or Float = LST – EST
Float is thus, the positive difference between the finish or start times.
vi) Slack: It is the amount of time by which occurrence of an event ca be delayed. It is the difference between
latest occurrence time and earliest occurrence time of an event.
i.e., Slack, S = LFT - EST (Head event)
S = LST – EFT (Tail event)
PROGRAM EVALUATION AND REVIEW TECHNIQUE (PERT)
In CPM system of networks, the time values are deterministic or variations in time are insignificant. It
is based on single time estimate (average time) required to execute the project activity.
In PERT system of networks, the time duration of each activity is not a single time estimate due to
uncertainties. The activity time follows β-distribution (mean and variance). PERT system is based on three
time estimates which provide the measure of uncertainty associated with that activity. They are,
i) Optimistic time (to): The shortest possible time required for the completion of an activity if everything
goes extremely well. NO provisions are made for delays while estimating this time.
Module 3 B: Scheduling, Co-ordination and Control of Projects:
5th Semester BE, Mechanical, NHCE Page 7
ii) Pessimistic time (tp): The maximum possible time required for the completion of activity, if nothing goes
well or everything goes bad/wrong. However major uncertainties such as earthquakes, floods, fire and labor
troubles are not considered while estimating this time.
iii) Most likely time (tm): The time of an activity will take if executed under normal conditions. This assumes
normal delays. If a graph is plotted with time of completion in that time period, then most likely time time
will represent the highest frequency.
iv) Expected time: The average time an activity will take if it were to be repeated in large number of times.
And is based on the assumption that the activity time follows Beta-distribution. Expected time is taken equal
to mean.
𝑡 𝑒 = 𝜇 =
𝑡0 + 4𝑡 𝑚 + 𝑡 𝑝
6
v) Variance: Variance of an activity is given by
𝒗 = 𝝈 𝟐
= (
𝑡 𝑝−𝑡 𝑜
𝟔
)
𝟐
Variance or standard deviation is used to find the probability of completing the whole project by a
given date (using normal distribution table).
Steps in the PERT Planning Process
PERT planning involves the following steps:
1. Identify the specific activities and milestones.
2. Determine the proper sequence of the activities.
3. Construct a network diagram.
4. Estimate the time required for each activity.
5. Determine the critical path
6. Update the PERT chart as the project progresses
1. Identify Activities and Milestones
The activities are the tasks required to complete the project. The milestones are the events marking the
beginning and end of one or more activities. It is helpful to list the tasks in a table that in later steps can be
expanded to include information on sequence and duration.
2. Determine Activity Sequence
Module 3 B: Scheduling, Co-ordination and Control of Projects:
5th Semester BE, Mechanical, NHCE Page 8
This step may be combined with the activity identification step since the activity sequence is evident
for some tasks. Other tasks may require more analysis to determine the exact order in which they must be
performed.
3. Construct the Network Diagram
Using the activity sequence information, a network diagram can be drawn showing the sequence of the
serial and parallel activities. For the original activity-on-arc model, the activities are depicted by arrowed
lines and milestones are depicted by circles or "bubbles". If done manually, several drafts may be required to
correctly portray the relationships among activities. Software packages simplify this step by automatically
converting tabular activity information into a network diagram.
4. Estimate Activity Times
Weeks are a commonly used unit of time for activity completion, but any consistent unit of time can
be used. A distinguishing feature of PERT is its ability to deal with uncertainty in activity completion times.
For each activity, the model usually includes three time estimates:
 Optimistic time-generally the shortest time in which the activity can be completed. It is common
practice to specify optimistic times to be three standard deviations from the mean so that there is
approximately 1% chance that the activity will be completed within the optimistic time.
 Most likely time – the completion time having the highest probability. Note that this time is different
from the expected time.
 Pessimistic time – the longest time that an activity might require. Three standard deviations from the
mean is commonly used for the pessimistic time.
PERT assumes a beta probability distribution for the time estimates. For a beta distribution, the expected time
for each activity can be approximated using the following weighted average:
Expected time, 𝑡 𝑒 = 𝜇 =
𝑡0+4𝑡 𝑚+𝑡 𝑝
6
This expected time may be displayed on the network
diagram.
To calculate the variance for each activity completion time, if three standard deviation times
were selected for the optimistic and pessimistic times, then there are six standard deviations between them,
so the variance is given by:
𝒗 = 𝝈 𝟐
= (
𝑡 𝑝−𝑡 𝑜
𝟔
)
𝟐
5. Determine the critical path: The critical path is determined by adding the times for the activities in each
sequence and determining the longest path in the project. The critical path determines the total calendar time
required for the project. If activities outside the critical path speed up or slow down (within limits), the total
project time does not change. The amount of time that a non – critical path activity can be delayed without
the project is referred to as a slack time. If the critical path is not immediately obvious, it may be helpful to
determine the following four quantities for each activity:
ES – Earliest Start time
EF - Earliest Finish time
LS – Latest Start time
LF - Latest Finish time
Module 3 B: Scheduling, Co-ordination and Control of Projects:
5th Semester BE, Mechanical, NHCE Page 9
These times are calculated using the expected time for the relevant activities. The earliest start and
finish times of each activity are determined by working forward through the network and determining the
earliest time at which an activity can start and finish considering its predecessor’s activities. The latest start
and finish times are the latest times that an activity can start and finish without delaying the project. LS and
LF are found by working backward through the network. The difference in the latest and earliest finish of
each activity is that activity’s slack. The critical path then is the path through the network in which none of
the activities have slack.
Since the critical path determines the completion date of the project, the project can be accelerated by adding
the resources required to decrease the time for the activities in the critical path. Such a shortening of the
project sometimes is referred to as project crashing.
6. Update the PERT chart as the project progresses: Make adjustments in the PERT chart as the project
progresses. As the project unfolds, the estimated times can be replaced with actual times. In cases where there
are delays, additional resources may be needed to stay on schedule and the PERT chart may be modified to
reflect the new situation.
BENEFITS OF PERT: PERT is useful because it provides the following information
 Expected project completion time;
 Probability of completion before a specified date
 The critical path activities that directly impact the completion time;
 The activities that have slack time and that can be lend resources to critical path activities;
 Activity start and end date.
PREREQUISITES:
 Personnel should already have a good understanding of formal project management terminology,
tools, and techniques
 PERT form template of equivalent tool (e.g. software)
 Create of project plan
 Choose the most appropriate scheduling method
 Select and organize a team to perform project tasks.
Module 3 B: Scheduling, Co-ordination and Control of Projects:
5th Semester BE, Mechanical, NHCE Page 10
Example -1: The following table lists the jobs of a network with their estimates
Job (i-j) Duration (days)
Optimistic, 𝑡0 Most likely, 𝑡 𝑚 Pessimistic, 𝑡 𝑝
1-2 3 6 15
1-6 2 5 14
2-3 6 12 30
2-4 2 5 8
3-5 5 11 17
4-5 3 6 15
6-7 3 9 27
5-8 1 4 7
7-8 4 19 28
i) Draw the project network
ii) Calculate the length and variance of critical project
iii) What is the approximate probability that the jobs on the critical path will be completed in 41 days
i)
ii) The critical path is 1-2-3-5-8
Length of critical path is 36 days
Variance of critical path is 4 + 16 + 4 + 1 = 25
Job (i-j) Duration (days) 𝒕 𝒆 =
𝒕 𝟎 + 𝟒𝒕 𝒎 + 𝒕 𝒑
𝟔
𝝈 𝟐
Optimistic, 𝑡0 Most likely, 𝑡 𝑚 Pessimistic, 𝑡 𝑝
1-2 3 6 15 7 4
1-6 2 5 14 6 4
2-3 6 12 30 14 16
2-4 2 5 8 5 1
3-5 5 11 17 11 4
4-5 3 6 15 7 4
6-7 3 9 27 11 16
5-8 1 4 7 4 1
7-8 4 19 28 18 16
1
2
6
3
4 8
7
5
E = 0
L = 0
E2 = 7
L2 = 7
E4 = 12
L4 = 25
E7 = 17
L7 = 18
E6 = 6
L6 = 7
E3 = 21
L3 = 21
E5 = 32
L5 = 32
E8 = 36
L8 = 36
7
75
11
6
14
11
4
18
Module 3 B: Scheduling, Co-ordination and Control of Projects:
5th Semester BE, Mechanical, NHCE Page 11
iii) Scheduled time = 41 days
Expected (estimated time) = 36 days
∴ 𝑧 =
𝑠 𝑡−𝐸
√𝜎2
=
41−36
√25
=
5
5
= 1 for which p=0.84=84%
∴ 84% of jobs in critical path would be completed within 41 days of duration or 16% of jobs in critical
path would take longer than 41 days for completion.
UNCERTAINTY IN PROJECT SCHEDULES: On some projects, it is easy to estimate durations of
activities with confidence. On others, so many uncertainties exist that managers have far less confidence in
their ability to accurately estimate. However, project managers still need to tell sponsors and clients how long
they believe a project will take and then be held accountable for meeting those dates. One common strategy
for handling this potential problem is to construct the best schedule possible and then manage the project very
closely. A different strategy is to estimate a range of possible times each individual activity may take and
then see what impact that has one on the entire schedule. PERT and Monte Carlo are two methods sometimes
used for this approach.
Program Evaluation and Review Technique
Program evaluation and review technique was developed during the 1950’s to better understand how
variability in the individual activity durations impact the entire project schedule. To use PERT, a project team
starts by sequencing the activities into a network is as described below
Determine
new
product
features
5
Acquire
prototype
materials
20
Produce
prototype
10
Perform
Sales
Calls
25
Conduct
marketing
30
Design
Marketing
Campaign
10
Design
graphics
10
Two Pass Example Schedule Set up
Module 3 B: Scheduling, Co-ordination and Control of Projects:
5th Semester BE, Mechanical, NHCE Page 12
Determine
new
product
features
5
Acquire
prototype
materials
20
Produce
prototype
10
Perform
Sales
Calls
25
Conduct
marketing
30
Design
Marketing
Campaign
10
Design
graphics
10
0 A 5
5 B 25
25 C 35
5 D 15
15 E 25
15 F 45
45 G 70
Schedule Example First Pass Complete
Determine
new
product
features
5
Acquire
prototype
materials
20
Produce
prototype
10
Perform
Sales
Calls
25
Conduct
marketing
30
Design
Marketing
Campaign
10
Design
graphics
10
0 A 5
5 B 25
25 C 35
5 D 15
15 E 25
15 F 45
45 G 70
Schedule Example Second Pass Complete
0 5
15 35
35 45
35 45
15 45
5 15
45 70
Module 3 B: Scheduling, Co-ordination and Control of Projects:
5th Semester BE, Mechanical, NHCE Page 13
PATH DURATION
ABCG 5+20+10+25=60
ADEG 5+10+10+25=50
ADFG 5+10+30+25=70
However instead of creating one estimate for the time to complete each activity, they would create three
estimates: optimistic, most likely, and pessimistic. For example, the first activity. “Determine new product
features”, will most likely take five days, but it could take as little as four days if everything works well and
as long as 12 days if a variety of things interfere. The person scheduling the project then calculates the
estimated time to perform each activity as shown in following table.
Activity Optimistic,
to
Most likely,
tm
Pessimistic,
tp
Expected,𝒕 𝒆 =
𝒕 𝒐+𝟒𝒕 𝒎+𝒕 𝒑
𝟔
Determine new product features 4 5 12 6
Acquire prototype materials 16 20 30 21
Produce prototype 8 10 12 10
Design marketing campaign 9 10 14 10.5
Design Graphics 6 10 20 11
Conduct Marketing 28 30 50 33
Perform Sales Call 20 25 30 25
Determine
new
product
features
5
Acquire
prototype
materials
20
Produce
prototype
10
Perform
Sales
Calls
25
Conduct
marketing
30
Design
Marketing
Campaign
10
Design
graphics
10
0 A 5
5 B 25
5 D 15
15 E 25
15 F 45
45 G 70
0 5
15 35
35 45
35 45
15 45
5 15
45 70
Two-Pass Complete Schedule Example 25 C 35
Module 3 B: Scheduling, Co-ordination and Control of Projects:
5th Semester BE, Mechanical, NHCE Page 14
The primary advantage of PERT is that it helps everyone to realize how much uncertainty exists in the project
schedule. When people use single time estimates, sometimes there is a tendency to believe that the estimates
foretell exactly what will happen. On many projects, a great deal of uncertainty exists, and PERT helps to
make this visible. In addition to making overall uncertainty ore visible, calculations often show that the
expected time is usually longer than the most likely time can be saved, but if many things go terribly wrong
a great deal of time can be lost.
However, using PERT involves difficulties. First, it is often hard enough to create one estimate of how
long an activity will take, so it takes even more effort (and therefore money). to create three estimates. Second
there is no guarantee on how good any of the three estimates are. Third, PERT can underestimate the risk of
a schedule running long because it does not accurately address when two or more activities both need to be
accomplished before a third one can begin.
Since PERT highlights uncertainty in project duration, it logic is very useful to project managers.
However, since it has some problems, only a few project managers actually use it to fully calculate and
monitor project schedules. Some project managers informally use three estimates for a few key activities on
the critical path to get a sense for the amount of uncertainty and to better understand the activities that need
close monitoring. Other project managers who want to understand the potential variation use Monte Carlo
simulation. It is to be noted that both PERT and Monte Carlo simulations are sometimes used to help
understand uncertainty in project schedules.
Monte Carlo Simulation
Monte Carlo analysis is “a technique that computes, or iterates the project cost or project schedule
many times using the input values selected at random from probability distributions of possible costs or
durations, to calculate a distribution of possible total project costs or completion dates”. Monte Carlo is more
flexible than PERT in that an entire range of all possible time estimates can be used for any activity. The
project schedule is calculated many times (perhaps, 1000 or more), and each time the estimate for a particular
activity is generated based upon the likelihood of that estimate as determined by the project manager. For
example, suppose a project manager estimated that for a particular activity there was 10% chance of taking
five days, a 30% chance of taking six days, a 40% chance of taking seven days and remaining 20% chance
of taking eight days. Then for each 100 times the computer generated a project schedule, when it came to that
activity, 10 times it would choose seven days and 20 times it would choose eight days. The output from the
computer would include distribution of how often the project would be expected to take each possible length
of time. Many other possible outputs can also be generated for Monte Carlo simulations.
Other advantage of Monte Carlo analysis is the flexibility it provides. This allows more realistic
estimates. Another advantage is the extent of information it can provide regarding individual activities, the
overall project, and different paths through the project that may become critical.
A disadvantage of Monte Carlo is the amount of time necessary to estimate not just a most likely
duration for each activity, but an entire range of possible outcomes. Another disadvantage is that special
software and skill are necessary to effectively use Monte Carlo. This disadvantage is not as large as it once
was because more software is being developed.
Module 3 B: Scheduling, Co-ordination and Control of Projects:
5th Semester BE, Mechanical, NHCE Page 15
DIFFERENT SCHEDULING TECHNIQUES BAR (GANTT) CHARTS
A much easier to understand tool for communicating a project schedule is Gantt or bar chart. A graphic
display of schedule-related information. In the typical bar chart, schedule activities or work breakdown
structure components are listed down the left side of the chart, dates are shown across the top, and activity
durations are shown as date-placed horizontal bars. Also called a Gantt chart.
After the PERT/CPM analysis is completed, the following phase is to construct the GANTT chart and then
to reallocate resources and re-schedule if necessary.
Characteristics:
 The bar in each row identifies the corresponding task
 The horizontal position of the bar identifies start and end times of the task
 Bar length represents the duration of the task
 Task durations can be compared easily
 Good for allocating resources and re-scheduling
 Precedence relationships can be represented using arrows
 Critical activities are usually highlighted
 Slack times are represented using bars with doted lines
 The bar of each activity begins at the activity earliest start time (ES)
 The bar of each activity ends at the activity latest finish time (LF).
Advantages
 Simple
 Good visual communication to others
 Task durations can be compared easily
 Good for scheduling resources
Disadvantages
 Dependencies are more difficult to visualize
 Minor changes in data can cause major changes in the chart
CONSTRUCTING GANTT CHART:
The steps to construct a GANTT chart from the information obtained by PERT/CPM are:
1. Schedule the critical tasks in the correct position.
2. Place the time windows in which the non-critical tasks can be scheduled.
3. Schedule the non-critical tasks according to their earliest starting times.
4. Indicate precedence relationships between tasks
Module 3 B: Scheduling, Co-ordination and Control of Projects:
5th Semester BE, Mechanical, NHCE Page 16
Example of an early GANTT chart construction:
Step 1. Schedule critical tasks:
Step 2. Place time windows for non-critical tasks:
Step 3. Schedule non-critical tasks
Step 4. Indicate precedence relationships:
Module 3 B: Scheduling, Co-ordination and Control of Projects:
5th Semester BE, Mechanical, NHCE Page 17
DIFFERENCE BETWEEN GANTT CHARTS & PERT CHARTS
SI.no GANTT PERT
1 Gantt charts present information in the format of
a bar chart.
PERT, on the other hand, displays information
as a network model.
2 This presentation helps show the percentage of
work completed for each task.
This presentation helps show the sequence of
activities which cannot start until the
completion of precedence activity.
3 Interrelation between two tasks may or may not
exist.
Interrelation exists as no task can be started
without finishing the earlier.
4 Ideal for straightforward projects with few
interlinking tasks
Can be used for any complex type of projects
5 Gantt charts present project tasks and time
allocation as the only two pieces of data.
PERT charts, while also including project tasks
and time allocation, display dependency.
6 Gantt charts are easier to change as a task moves
along and it comes closer to completion.
Modification in any activity will affect entire
project.
7 It is not possible to identify critical activities or
critical path
It is easy by calculating different start and
finish times.
8 Gantt charts are simpler to read PERT charts extend an element of detail to the
project scheduling through both the network
model's ability to display dependency
9 Tasks in Gantt chart have single time Tasks in PERT chart have average of three
times.
PROJECT DIRECTION COMMUNICATION IN PROJECT
Project Direction: project direction refers to the use of authority to channelize the various activities of the
project on desired lines. It is mainly concerned with the implementation phase of the project. When schedules
are authorized, they become working documents. Executive agencies or individuals will then strictly follow
the plans and schedules.
Module 3 B: Scheduling, Co-ordination and Control of Projects:
5th Semester BE, Mechanical, NHCE Page 18
Project Communication: The entire process of direction, co-ordination and control in a project revolves
around communication. Through direction wields to coordination and control, direction itself is effective only
when there are two way communications all around about 60% of management problems are caused in whole
or in party by faulty management communication.
Communication does not merely mean passing on a message. But it most includes the understanding
of the message. If the message sent by the sender is not understood by the receiver, then no communication
is said to have taken place. Merely providing the channels for communication is not enough. Effort must be
directed towards clarifying and making sure that the receiver has received and clearly understood what was
intended to be conveyed.
E.g., A drawing is sent by the sender, but he does not care to check if it has been received and can be put to
use. The sender may even send the wrong drawing. The receiver of drawing also may not acknowledge the
receipt of the drawing.
When one person asks another what he thinks about an issue, the respondent would invariably repeat the
question first before making a reply. This is to make sure that he has correctly understood the question.
Communication has two dimensions, physical aspects include passing on a menu, data. instruction etc.,
while mental aspects include listening skills, empathy etc.,
Problems in Communication
Since the communication is the key to successful project management, every effort must be made to
ensure complete communication between all the members of the project. Both the physical and mental aspects
of communication must be taken care of some problems are:
 Organization Chart: The organization chart is supposed to provide the official communication
channel but some organization charts that are not very clear become a major hindrance of
communication.
Remedy: Departmentalization and chain of command must be allowed but they should not act as a
barrier for communication. The orders must flow along the chain of command but the information
flow-must not have any such restrictions.
 Physical Distance: The physical distance between two interacting groups will usually present a barrier
in communication. Though the people may be working in the same office, shutting from cabin to the
other can create a problem. The physical distance can also be created by making oneself
unapproachable even in open work environments.
Remedy: Have all the working groups in the same office and provide them with good communication
equipment.
 Absence of Communication Devices: Sometimes the two groups that are working may be such that
one is on the site while the other is in the office thus it is necessary to provide both the groups with
appropriate communication devices to bridge the distance between the two groups.
Sometimes it is better to over-communicate as to prevent rumors filling the voids created due
to the communication voids. Lack of clear communication can also lead to misunderstanding. lack of
trust, loss of confidence etc.,
Some actions that can be taken to improve communication are:
 Selection and installation of appropriate communication devices.
 Organizing review meeting at predetermined frequencies.
Module 3 B: Scheduling, Co-ordination and Control of Projects:
5th Semester BE, Mechanical, NHCE Page 19
 Installing a structure reporting program.
 Running an in house magazine.
 Using desktop computers for communication.
 Implementing a routine communication system and procedure.
ROLE OF MIS IN PROJECT CONTROL
The Project Management Information System (PMIS) is a standardized set of automated tools available
within the organization and integrated in to a system. The PMIS is used by the project management team to
support generation of a project charter, facilitate feedback as the document is refined, controlled changes to
the project charter, and release the approved document.
An information system consisting of the tools and techniques used to gather, integrate, and disseminate the
outputs of project management processes. It is used to support all aspects of the project from initiating through
closing, and can include both manual and automated systems.
Project management information system (e.g., an automated tool, such as a scheduling software tool, a
configuration management system, an information collection and distribution system, or web interfaces to
other online automated systems).
The project management information system, which is part of the environmental factors, provides access to
tools, such as a scheduling tool, a work authorization system, a configuration management system, an
information collection and distribution system, or interfaces to other online automated systems. Automated
gathering and reporting on key performance indicators (KPI) can be part of this system.
Basic Requirements for a Project Management Information System:
 Each project header must be able to update his project on a monthly basis utilizing project
management forms.
 The project manager must be able to manually device the information needed to measure the progress
if the project from the reporting systems.
 The project leader must be allowed to review his project plans and predict the cash required every
week or month to complete the project.
 Analysis of the reasons in the exception report must be done by the project manager.
 The analysis reports must be then typed up for distribution.
Optimum Project Management Information System may be described as follows:
 The existing information system are reduced to 3 elements:
 Human resources
 Financial resources
 Material resources
 Direct entry of data is via terminals with cathode ray tube (CRT’s)
 Individual reports may be generated for other than project management needs.
 Information is formulated along with estimates supplied by the project leader to display a current
summary, plan and analysis on the CRT or as a hard copy.
 Project plans can be transferred by project leaders to line management via a CRT
Module 3 B: Scheduling, Co-ordination and Control of Projects:
5th Semester BE, Mechanical, NHCE Page 20
 The system will have the capability to access central pertinent files
 The system will have the capability for data correction at the original sources, thus reducing the labor
required.
PERFORMANCE CONTROL
A project on its completion must perform. Failure of the project to come up in time or budget can be
tolerated, but failure to perform will never be condoned. Personnel are criticized not only for the time and
cost over-run, but for non-performance they are cursed day in and day out by the plant operation personnel.
Performance control like progress control will require continuous monitoring during the production
phase. This must however, be preceded by right specification, selection of right vendors, contractors and
above all right contractual stipulations regarding warranties and guarantees. The warrantees in this context
specifies the quality or performance the purchaser has a right to rely upon. The guarantee concerns what will
be done by the seller, contractor or manufacture in the vent if goods are found defective or do not meet certain
standards of performance. This warranty normally deals with a specific period of time and performance and
this is what the purchaser bargains and pays for. The guarantee is a liquidate damage clause that refers to
broken warranties. A guarantee costs the seller or contractor or manufacturer money or its equivalent in
material parts or services. But, a project cannot simply depend on the supplier’s warranties and guarantees.
Due to project slippage, the warranty period may often expire before the project is completed. What the owner
may get in terms of liquidated damages even if they could ever be realized, would be a poor compensation
for the perpetual headache caused by a non performing plant. Ongoing performance control is therefore
essential.
Performance control starts with identification of performance parameters. Which performance
parameters are critical for viability of the project must be first establish in clear terms. Output certainly is one
performance parameter: raw materials, power consumption per unit of production could be others. The design
and specification must be made to meet these performance requirements. The subsequent stages of project
execution, like ordering and manufacture must ensure that these requirements are not traded off for some
other short term benefits. Thus a single performance parameter would require to be tracked through all the
stages of the project execution till the final performance guarantee confirms achievement of the performance.
SCHEDULE CONTROL
Schedule control is to ensure adherence to the agreed time schedule for the project. It is not an
independent activity. Schedule has to be used as a basis for direction, communication, coordination and
progress control or else there can be no schedule control. Schedules and scheduling systems have to form an
inseparable part of the project execution for exercise of schedule control.
Why Schedule control?
The thrust is to convert all available inputs to outputs by taking commitments from the working groups.
But since input for one group has to come from the output of another, all the groups have to progress in a
desired way or else, the progress will be uneven. If this happens the project completion will be delayed. It is
also possible that a working group has achieved 99% progress and yet due to lack of single input completion,
it can be delayed by several months. Monitoring and control of project and time becomes essential besides
progress control to ensure adherence to project schedule.
Module 3 B: Scheduling, Co-ordination and Control of Projects:
5th Semester BE, Mechanical, NHCE Page 21
Types of Schedule Control
 Preventive schedule control: It is good practice to keep a close watch on the areas which normally
delay a project and take all possible steps to make sure that delays do not occur. This means that,
project management can use past experiences of similar nature to forecast vulnerable areas and act in
advance instead of reacting to the forecast of completion dates of the current project. Delays occur
more in the beginnings of the project than towards the end. The delays that often experience at the
later part of the project are usually a hangover of the past. Thus schedule control must start at the
beginning of the work and it is here that past experiences will prove invaluable.
 Predictive Schedule Control: Starts with the forecast of project completion if the forecast indicates
that the project completion requirements are going to be met, no action is initiated. This forecast is to
be provided to the controlling authority in the form of the feedback report. If the forecast indicates
that the project completion data may not be met, immediate investigations are ordered to find out the
ways and means of bringing the project back to schedule.
COST CONTROL
Cost control is not only monitoring of costs and recording massive quantities of data, but also analyzing
the data in order to take corrective action before it is too late. Cost control must be performed by all personnel
who incur costs. It is the cost which reflects performance in all areas. A well-managed project will incur
lower cost than one which is not. If the project cost can be brought down without compromising on the
parameters that would make a project to perform efficiently. It would indicate excellent cost management.
Cost control therefore should not be mere accounting of costs to report expenditures but must also include
monitoring all the cost components thus ensuring the completion of the project at optimal cost.
On-going cost reduction must be involved with lowering costs, without lowering the performance. Any
revision in the cost estimate made must be treated as only a revised forecast of the total project cost and must
not be treated as licenses for additional expenditure. Cost control should therefore refer to the manipulative
efforts during the various phases of the project for reducing the cost not yet incurred.
Cost control must include;
 Cost estimation
 Company cash flow
 Cost accounting
 Direct labor costing
 Project cash flow
 Overhead rate costing
 Incentives, penalties and profit sharing
COST CONTROL: Tools and Techniques
 Cost Change Control System: A cost change control system, documented in the cost management plan,
defines the procedures by which the cost baseline can be changed. It includes the forms, documentation,
tracking systems, and approval levels necessary for authorizing changes. The cost change control
system is integrated with the integrated change control process.
Module 3 B: Scheduling, Co-ordination and Control of Projects:
5th Semester BE, Mechanical, NHCE Page 22
 Performance Measurement Analysis: Performance measurement techniques help to assess the
magnitude of any variances that will invariably occur. The earned value technique (EVT) compares the
cumulative value of the budgeted cost of work performed (earned) at the original allocated budgeted
amount to both the budgeted cost of work scheduled (planned) and to the actual cost of work performed
(actual). This technique especially useful for cost control, resource management, and production.
An important part of cost control is to determine the cause of a variance, the magnitude of the
variance, and to decide if the variance requires corrective action. The earned value techniques use the
cost baseline contained in the project management plan to assess project progress and the magnitude of
any variations that occur.
The earned value technique involves developing these key values for each schedule activity,
work package, or control account:
 Planned Value (PV): PV is the budgeted cost for the work scheduled to be completed on an
activity or WBS component up to a given point in time.
 Earned Value (EV): EV is the budgeted amount for the work actually completed on the schedule
activity or WBS component during a given time period.
 Actual Cost (AC): AC is the total cost incurred in accomplishing work on the schedule activity
or WBS component during a given time period. This AC must correspond in definition and
coverage to whatever was budgeted for the PV and the EV (e.g., direct hours only, direct costs
only, or all costs including indirect costs)
 Estimate to complete (ETC) and Estimate at completion (EAC): The PV, EV, and AC values
are used in combination to provide performance measures of whether or not work is being
accomplished as planned at any given point in time. The most commonly used measures are
cost variance (CV) and schedule variance (SV). The amount of variance of the CV and SV
values tend to work being accomplished. Predetermined acceptable variance values that will
decrease over time as the project progresses towards completion can be established in the cost
management plan.
 Cost Variance (CV): CV equals earned value (EV) minus actual cost (AC). The cost
variance at the end of the project will be the difference between the budget at completion
(BAC) and the actual amount spent. Formula: CV = EV – AC
 Scheduled Variance (SV): SV equals earned value (EV) minus planned value (PV).
Schedule variance will ultimately equal zero when the project is completed because all
of the planned values will have been earned. Formula: SV = EV – PV
These two values, the CV and SV, can be converted to efficiency indicators to
reflect the cost and schedule performance of any project.
 Cost Performance Index(CPI): A CPI value less than 1.0 indicates a cost overrun of the
estimates. A CPI value greater than 1.0 indicates a cost underrun of the estimated. CPI
equals the ratio of the EV to the AC. The CPI is the most commonly used cost-efficiency
indicator. Formula: CPI = EV/AC
 Cumulative Cost Performance Index(CPIC
) The cumulative CPI is widely used to
forecast project costs at implementation. CPIC
equals the sum of the periodic earned
Module 3 B: Scheduling, Co-ordination and Control of Projects:
5th Semester BE, Mechanical, NHCE Page 23
values (EVC
) divided by the sum of the individual actual costs (ACC
). Formula:
CPIC
=EVC
/ACC
.
 Schedule Performance Index (SPI): The SPI is used in addition to the schedule status,
to predict the completion date and is sometimes used in conjunction with the CPI to
forecast the project completion estimates. SPI equals to the ratio of the EV to the PV.
Formula: SPI = EV/PV
Fig shows S-curves to display cumulative EV data for a project that is over
budget and behind the work plan.
The earned value technique in its various forms is a commonly used method of performance
measurement. It integrates project scope, cost (or resource) and schedule measures to help the project
management team assess project performance.
 Forecasting: Forecasting includes making estimates or predictions of conditions in the project’s future
based on information and knowledge available at the time of the forecast. Forecasts are generated,
updated, and reissued based on work performance information provided as the project is executed and
progressed. The work performance information is about the project’s performance and any information
that could impact the project in the future, for example, estimate at completion and estimate to
complete.
Module 3 B: Scheduling, Co-ordination and Control of Projects:
5th Semester BE, Mechanical, NHCE Page 24
The earned value technique parameters of BAC, actual cost (ACC
) to date, and the cumulative
CPIC
efficiency indicator are used to calculate ETC and EAC, where the BAC is equal to the total PV
at completion for a schedule activity, work package, control account, or other WBS component.
Formula: BAC = total cumulative PV at completion
Forecasting techniques help to assess the cost or the amount of work to complete schedule
activities, which is called the EAC, Forecasting techniques also help to determine the ETC, which is
the estimate for completing the remaining work for a schedule activity, work package, or control
account. While the earned value technique of determining EAC and ETC is quick and automatic, it is
not as the project team. The ETC forecasting technique based upon the performing organization
providing the estimate to compete is:
 ETC based on new estimate: ETC equals the revised estimate for the work remaining, as
determined by the performing organization. This more accurate and comprehensive completion
estimate is an independent, non-calculated estimate to complete for all the work remaining, and
considers the performance or production of the resource(s) to date.
Alternatively, to calculate ETC using the earned value data, one of two formulas is
typically used:
 ETC based on atypical variances: This approach is most often used when the current variances
are seen as atypical and the project management team expectations are that similar variances
will not occur in the future variances will not occur in the future. ETC equals the BAC minus
the cumulative earned value to date (EVC
). Formula: ETC = (BAC-EVC
)
 ETC based on typical variances: This approach is often used when current variances are seen
as typical of future variances. ETC equals the BAC minus the cumulative EVC
(the remaining
PV) divided by the cumulative cost performance index (CPIC
).
Formula: ETC = (BAC-EVC
)/CPIC
An EAC is a forecast of the most likely total value based on project performance and risk
quantification. EAC is the projected or anticipated total final value for a schedule activity, WBS
component, or project when the defined work of the project is completed. On EAC is forecasting
technique is based upon the performing organization providing an estimate at completion:
 EAC using a new estimate: EAC equals the actual costs to date (ACC
) plus a new ETC that is
provided by the performing organization. This approach is most often used when past
performance shows that the original estimating assumptions were fundamentally flawed or that
are no longer relevant due to a change in conditions.
Formula: EAC = ACC
+ ETC
The most common forecasting techniques for calculating EAC using earned value data
are some variations of:
 EAC using remain budget: EAC equals ACC
plus the budget required to complete the remaining
work, which is the budget at completion (BAC) minus the earned value (EV). This approach is
most often used when current variances are seen as atypical and the project management team
expectations are that similar variances will not occur in the future.
Formula: EAC = ACC
+ BAC-EVC
Module 3 B: Scheduling, Co-ordination and Control of Projects:
5th Semester BE, Mechanical, NHCE Page 25
 EAC using CPIC
: EAC equals actual costs to date (ACC
) plus the budget required to complete
the remaining work, which is the BAC minus the EV, modified by a performance factor (often
the CPIC
). This approach is most often used when current variances are seen as typical of future
variances/ Formula: EAC = ACC
+ ((BAC – EVC
)/CPIC
)
Each of these approaches can be the correct approach for any given project and will
provide the project management team with a single if the EAC forecasts are not within
acceptable tolerances.
 Project Performance Reviews: Performance reviews compare cost performance over time, schedule
activities or work packages overrunning and underrunning budget (planned value), milestones due, and
milestones met.
Performance reviews are meetings held to assess schedule activity, work package, or cost
account status and progress, and are typically used in conjunction with one or more of the following
performance-reporting techniques:
 Variance analysis: Variance analysis involves comparing actual project performance to planned
or expected performance. Cost and schedule variances are the most frequently analyzed , but
variances are the most frequently analyzed, but variances from plan in the areas of project scope,
resource, quality, and risk are often of equal or greater importance.
 Trend analysis: Trend analysis involves examining project performance over time to determine
if performance is improving or deteriorating.
 Earned value technique: The earned value technique compares planned performance to actual
performance.
 Project Management Software: Project management software, such as computerized spreadsheets, is
often used to monitor PV versus AC, and to forecast the effects of changes or variances.
 Variance Management: The cost management plan describes how cost variances will be managed, for
example, having different responses to major or minor problems. the amount of variance tends to
decrease as more work is accomplished. The larger variances allowed at the start of the project can be
decreased as the project nears completion.
Example: Use the following information to answer parts a through f. Describe what the results of each
calculation mean to you as a project manager. What do you propose to do?
PV = $500,000
EV = $350,000
AC = $550,000
BAC = $1,200,000
a) Calculate the schedule variance (SV)
b) Calculate the cost variance (CV)
c) Calculate the schedule performance index (SPI)
d) Calculate the cost performance index (CPI)
e) Calculate the estimate to complete (ETC)
f) Calculate the estimate at completion (EAC)
Solution:
Module 3 B: Scheduling, Co-ordination and Control of Projects:
5th Semester BE, Mechanical, NHCE Page 26
a) Schedule variance (SV) = EV – PV = 350000-500000 = - $150000 (Project is behind the
schedule because the variation is negative i.e., unfavorable)
b) Cost variance (CV) = EV – AC = 350000 – 550000 = - $200000 (over budget because the variation
is negative i.e., unfavorable)
c) Schedule Performance Index (SPI) = EV/PV = 350000/500000 = 0.7 = 70% (project is behind
schedule because work accomplished is 70% of planned)
d) Cost Performance Index (CPI) = EV/AC = 350000/550000 = 0.63 = 63% (Project is over budget
because it has only received $0.63 worth of results for every dollar spent)
e) Estimate to Complete (ETC) = (BAC – EV)/CPI = (1200000 – 350000)/63% = $ 1,349,206 (It is
expect to pay more for the remaining project work than it originally expected to pay for the entire
project)
f) Estimate at Completion (EAC) = AC + ETC = 550000 + 1349206 = $1,899,206 (Because project
cost efficiency is 63% of actual plan (as learned from CPI), unless work become more efficient, it can
expect to pay double the original estimation)

Scheduling coordination and control of projects

  • 1.
    2017-2018 Module 3B: Scheduling, Co-ordination and Control of Projects: 17MEE55 Compiled by: Somashekar S M, Assistant Professor DEPARTMENT OF MECHANICAL ENGINEERING, NEW HORIZON COLLEGE OF ENGINEERING, BENGALURU
  • 2.
    Module 3 B:Scheduling, Co-ordination and Control of Projects: 5th Semester BE, Mechanical, NHCE Page 1 CONTENTS  Purpose of a project schedule,  Historical development,  Uncertainty in project schedules,  Different scheduling techniques bar (GANTT) charts,  Bar charts for combined activities,  Project evaluation and review techniques,  PERT planning  Project direction communication in a project,  Role of MIS in project control,  Performance control,  Schedule control,  Cost control cases. SCHEDULING: Scheduling may be defined as the assignment of work to the facility with the specifications of time and the sequence in which the work is to be done. The facility may be man power, machine or both. PROJECT SCHEDULE: In a project management, a schedule is a listing of project’s milestones, activities, and deliverables, usually with intended start and finished dates. A schedule is commonly used in the project planning and project portfolio management parts of project management. The project schedule is the tool that communicates what work needs to be performed, which resources of the organization will perform the work and the time frames in which that work needs to be performed. The project schedule should reflect all of the work associated with the delivering the project on time. Without a full and complete schedule, the project manager will be unable to communicate the complete effort, in terms of cost and resources, necessary to deliver the project. PURPOSES OF PROJECT SCHEDULE: Projects are undertaken to accomplish important business purposes and people often want to be able to use the project results as quickly as possible. Many specific questions such as the following can be answered by having a complete and workable schedule.  When will be the project complete?  What is the earliest date at a particular activity can start, and when will it end?  What activity must begin before which other activities can take place?  What would happen if a delivery of material was one week late?  Can a key worker take a week of vacation the first week of March?  If one worker is assigned to do two activities, which one must go first?  How many hours do we need from each worker next week or month?  Which worker or other resource is a bottleneck, limiting the speed of our project?  What will the impact be if the client wants to add another module?  If I am willing to spend an extra Rs 10,00,000, how much faster can the project be completed?  Are all of the activities completed that should be by now?
  • 3.
    Module 3 B:Scheduling, Co-ordination and Control of Projects: 5th Semester BE, Mechanical, NHCE Page 2 HISTORICAL DEVDELOPMENT OF PROJECT SCHEDULES: Understanding how project scheduling developed to its current state is very helpful. Throughout history, projects have been performed, but many early projects such as great cathedrals in Europe took decades or longer to complete. As competition drove the need for more rapid project completion, systematic methods are developed for scheduling projects. In the 1950’s, two project scheduling methods are developed: program evaluation technique (PERT) and critical path method. The critical path method (CPM) is formally defined as “a schedule network analysis technique used to determine the amount of scheduling flexibility (the amount of float) on various logical network paths in the project schedule network, and to determine the minimum total project duration.” Both CPM and PERT were founded on the concepts still in place today of identifying activities, determining their logical order, and estimating the duration for each. Networks representing the activities were developed on the schedule calculated. Each of the techniques also boasted a capability the other did not possess. PERT was developed in the Navy’s Special Program Office because the Navy was developing the Polaris Weapon System. This system was extremely large and complex. To complete it as quickly as possible, many activities needed to be worked on simultaneously. Furthermore, many aspects of the Polaris used unproven technology. There was considerable uncertainty regarding how long some of the new technology would take to develop. Given the extreme complexity and uncertainty, PERT enabled project managers to not only estimate the most likely amount of time needed to complete a project, but also the level of confidence in completing it in a particular time. This has proven to be especially useful in R&D projects involving individual activities that are hard to estimate precisely. CPM was developed in the Engineering Services Division of DuPont needed to plan very large projects when it built and refurbished enormous plants. Planners using CPM estimated the time for each individual work activity using a single time estimate. The focus was on understanding the longest sequence of activities, which determined how long the project would take. CPM enabled project managers to ask what-if question such as “If the project needs to be finished three weeks early, which activities should be speeded up and how much will it cost?” This proved to be especially useful in the construction industry where delays such as rain often necessitate the acceleration of a project. PERT and CPM originally used a method for displaying the work activities called an activity on arrow (AOA) or arrow diagramming method (ADM), in which schedule activities are represented by arrows and connected at points called nodes. Because it often confusing to draw an accurate AOA network, this method is rarely used today. The more common method used today is called activity on node (AON) or the precedence diagram method (PDM). AON or PDM is “a schedule network diagramming technique in which the scheduled activities are represented by boxes or nodes. Schedule activities are graphically linked by one or more logical relationships to show the sequence in which the activities are performed”. A small project schedule is shown as below, B A C D
  • 4.
    Module 3 B:Scheduling, Co-ordination and Control of Projects: 5th Semester BE, Mechanical, NHCE Page 3 with work activities A through D connected by arrows showing logical relationships (A must be complete before B and C can begin and both B and C must finish before D can begin). Originally, the only relationship showing using AON was a finish-to-start relationship where the first activity must be complete before the next one can start, or one activity must be complete two days before the next one can start. Most modern project scheduling software makes use of AON representation of the project schedule. The basic logic of these techniques still serves as the backbone of many project schedules today. However, other advances have added to scheduling capability. One is that since computers are so much powerful and easier to use, many additional features have been added to project schedules. Another trend is that with many organizations operating in a “lean” mode, resource limitations rather than just the logical order of activities are a major determinant of many project schedules. INTRODUCTION TO BASIC DEFINTIONS IN NETWORK ANALYSIS  A project such as setting up of a new milk plant, research and development in an organization, development of new product, marketing of a product etc., is a combination of interrelated activities (tasks) which must be executed in a certain order before the entire task can be completed.  The activities are interrelated in a logical sequence in such a way that same activities cannot start until some are completed.  An activity in a project usually viewed as a job requiring resource for its completion.  The objective of project management can be desired in terms of successful project which has been finished on time, within the budgeted cost and to technical specifications & to the satisfaction levels of end users.  Normally for any project, one may be interested in answering questions such as,  What will be the expected time of project completion?  What is the effect of delay of any activity on the overall completion of project?  How to reduce the time to perform certain activities ion case of availability of additional funds?  What is probability of completion of project in time?  Different techniques are used for planning, scheduling and controlling large complex projects are often referred to as “network analysis”.  A network is a graphical representation consisting of certain configurations of arrows and nodes for shoeing the logical sequence of various tasks to be performed to achieve project objectives.  Around 5 decades ago the planning tool was “Gantt bar chart” which specifies start and finish time for each activity on a horizontal time scale.  The disadvantage is that there is no interdependency among the many activities such which control the progress of the project.
  • 5.
    Module 3 B:Scheduling, Co-ordination and Control of Projects: 5th Semester BE, Mechanical, NHCE Page 4  Now a day’s technical tool for planning, scheduling and controlling stages of projects known as Critical Path Method (CPM) & Program/Project Evaluation Review Technique (PERT).  The techniques of CPM/PERT prove extremely valuable in assisting managers handling such projects and thus discharging their management responsibilities both at planning and controlling stages of the projects.  Both are basically time oriented methods laid to determination of time schedule for project.  The main difference between the two techniques is that PERT is a “probabilistic approach” for the determination of time estimated of different activities not exactly known to us.  In the case of CPM, different estimates are known as “deterministic in nature”.  But now days both these techniques are used for one purpose. Initially the PERT technique was applied to research & development projects while the CPM was used towards construction projects. METHODOLOGY IN CPM/PERT TECHNIQUES The methodology involved in network scheduling by CPM/PERT for any project consists of the following four stages.  Planning: It is started by splitting the total project into smaller projects. The smaller projects are further divided into different activities and are analyzed by a department or section. The relationship of each activity with respect to other activities are defined and established.  Scheduling: The objective of scheduling is to give the earliest and the latest allowable start and finish time of each activity as well as its relationship with other activities in the project. The schedule must pinpoint the critical path i.e., time activities which require special attention if the project is to completed in time.  Allocation of resource: Allocation of resources is performed to achieve the desired objective. Resource is a physical variable such as labor, finance, space, equipment etc., which will impose a limitation for a completion of project.  Controlling: The final phase in the project management is controlling. After making the network plan & identification of the critical path the project is controlled by checking the progress against the schedule, assigning scheduling mana power & equipment & analyzing the effect of delays. IMPORTANT DEFINITIONS:  Network or Arrow diagram: In project scheduling, first step is to sketch an arrow diagram which show interdependencies and precedence relationship among activities of project.  Activity: Any individual operation which uses resources is called activity. An activity is represented by an arrow with its head indicating the direction of progress in the project. The length, shape and direction of arrows has no relation to the size of activity. Ex: Designing of parts, assembly of parts, mixing of concrete etc.  Predecessor activity: Activity that must be completed immediately prior to the start of another activity.  Successor activity: Activity that can’t be started until one or more of other activities are completed.  Concurrent activity: Simultaneously occurring activity.  Dummy activity: Activity which doesn’t consume any kind of resource and has technological dependence.
  • 6.
    Module 3 B:Scheduling, Co-ordination and Control of Projects: 5th Semester BE, Mechanical, NHCE Page 5  Event: The beginning and end points of an activity are called events or nodes. It is represented by a circle in the network. Ex: Assign, Completed, Design started. The event has three types  Merge Event: When more than one activity comes and joins an event, such an event is known as merge events.  Burst Event: When more than one activity leaves an event is known as burst event. Burst Event  Merge and Burst Event: Combination of both  Path: An unbroken chain of activity arrows connecting the initial event to some other event is called a path. Example: Various activities for a project of erection of steel work for a shed is given below: Activity Description Preceded by A Erection site workshop - B Fence site - C Bend reinforcement A D Dig foundation B E Fabricate A F Install concrete pillars B G Place reinforcement C, D H Concrete foundation G, F I Erect steel work E J Paint steel work H, I K Give finishing work J Merge Event A B E F D G C JH I K 1 987 6 54 3 2
  • 7.
    Module 3 B:Scheduling, Co-ordination and Control of Projects: 5th Semester BE, Mechanical, NHCE Page 6 TIME ESTIMATES AND CRITICAL PATH IN NETWORK ANALYSIS: Once the network of the project is constructed, the time analysis of network becomes essential for planning various activities of project. The critical path of a network gives the shortest time in which the entire project can be completed. It is the chain of activities with longest time durations. These activities are critical activities (They are critical because any delay in their activity results in the delay of project completion. There may be more than one critical path in a network). Critical path analysis consists of following steps:  Calculate total completion time for the project- It involves calculation of project completion time.  Calculate time schedule for each activity- It involves the determination of time by which an activity must begin and the time before which it must be completed. The time schedule data for each activity include the calculation of EST, EFT LST, LFT and the float.  Identify the critical activities and critical path. Note: Some important definitions i) EST (Early Start Time): It represents the time at which an activity can begin at the earliest. ii) EFT (Early Finish Time): EST + Tij These two are determined through forward pass method by proceeding progressively from left to right (or) start event to end event. The EST for start event is zero. iii) LFT (Latest Finish Time): It represents the time at which an activity can be completed without delaying the completion of project. iv) LST (Latest Start Time): LFT - Tij These two are determined through backward pass method by proceeding progressively from right to left or end event to start event. The LFT for end event is equal to its EST. v) Float: Float of an activity is defined as the amount of time by which the completion of an activity can be delayed without delaying the total project duration. Float = LFT – EFT or Float = LST – EST Float is thus, the positive difference between the finish or start times. vi) Slack: It is the amount of time by which occurrence of an event ca be delayed. It is the difference between latest occurrence time and earliest occurrence time of an event. i.e., Slack, S = LFT - EST (Head event) S = LST – EFT (Tail event) PROGRAM EVALUATION AND REVIEW TECHNIQUE (PERT) In CPM system of networks, the time values are deterministic or variations in time are insignificant. It is based on single time estimate (average time) required to execute the project activity. In PERT system of networks, the time duration of each activity is not a single time estimate due to uncertainties. The activity time follows β-distribution (mean and variance). PERT system is based on three time estimates which provide the measure of uncertainty associated with that activity. They are, i) Optimistic time (to): The shortest possible time required for the completion of an activity if everything goes extremely well. NO provisions are made for delays while estimating this time.
  • 8.
    Module 3 B:Scheduling, Co-ordination and Control of Projects: 5th Semester BE, Mechanical, NHCE Page 7 ii) Pessimistic time (tp): The maximum possible time required for the completion of activity, if nothing goes well or everything goes bad/wrong. However major uncertainties such as earthquakes, floods, fire and labor troubles are not considered while estimating this time. iii) Most likely time (tm): The time of an activity will take if executed under normal conditions. This assumes normal delays. If a graph is plotted with time of completion in that time period, then most likely time time will represent the highest frequency. iv) Expected time: The average time an activity will take if it were to be repeated in large number of times. And is based on the assumption that the activity time follows Beta-distribution. Expected time is taken equal to mean. 𝑡 𝑒 = 𝜇 = 𝑡0 + 4𝑡 𝑚 + 𝑡 𝑝 6 v) Variance: Variance of an activity is given by 𝒗 = 𝝈 𝟐 = ( 𝑡 𝑝−𝑡 𝑜 𝟔 ) 𝟐 Variance or standard deviation is used to find the probability of completing the whole project by a given date (using normal distribution table). Steps in the PERT Planning Process PERT planning involves the following steps: 1. Identify the specific activities and milestones. 2. Determine the proper sequence of the activities. 3. Construct a network diagram. 4. Estimate the time required for each activity. 5. Determine the critical path 6. Update the PERT chart as the project progresses 1. Identify Activities and Milestones The activities are the tasks required to complete the project. The milestones are the events marking the beginning and end of one or more activities. It is helpful to list the tasks in a table that in later steps can be expanded to include information on sequence and duration. 2. Determine Activity Sequence
  • 9.
    Module 3 B:Scheduling, Co-ordination and Control of Projects: 5th Semester BE, Mechanical, NHCE Page 8 This step may be combined with the activity identification step since the activity sequence is evident for some tasks. Other tasks may require more analysis to determine the exact order in which they must be performed. 3. Construct the Network Diagram Using the activity sequence information, a network diagram can be drawn showing the sequence of the serial and parallel activities. For the original activity-on-arc model, the activities are depicted by arrowed lines and milestones are depicted by circles or "bubbles". If done manually, several drafts may be required to correctly portray the relationships among activities. Software packages simplify this step by automatically converting tabular activity information into a network diagram. 4. Estimate Activity Times Weeks are a commonly used unit of time for activity completion, but any consistent unit of time can be used. A distinguishing feature of PERT is its ability to deal with uncertainty in activity completion times. For each activity, the model usually includes three time estimates:  Optimistic time-generally the shortest time in which the activity can be completed. It is common practice to specify optimistic times to be three standard deviations from the mean so that there is approximately 1% chance that the activity will be completed within the optimistic time.  Most likely time – the completion time having the highest probability. Note that this time is different from the expected time.  Pessimistic time – the longest time that an activity might require. Three standard deviations from the mean is commonly used for the pessimistic time. PERT assumes a beta probability distribution for the time estimates. For a beta distribution, the expected time for each activity can be approximated using the following weighted average: Expected time, 𝑡 𝑒 = 𝜇 = 𝑡0+4𝑡 𝑚+𝑡 𝑝 6 This expected time may be displayed on the network diagram. To calculate the variance for each activity completion time, if three standard deviation times were selected for the optimistic and pessimistic times, then there are six standard deviations between them, so the variance is given by: 𝒗 = 𝝈 𝟐 = ( 𝑡 𝑝−𝑡 𝑜 𝟔 ) 𝟐 5. Determine the critical path: The critical path is determined by adding the times for the activities in each sequence and determining the longest path in the project. The critical path determines the total calendar time required for the project. If activities outside the critical path speed up or slow down (within limits), the total project time does not change. The amount of time that a non – critical path activity can be delayed without the project is referred to as a slack time. If the critical path is not immediately obvious, it may be helpful to determine the following four quantities for each activity: ES – Earliest Start time EF - Earliest Finish time LS – Latest Start time LF - Latest Finish time
  • 10.
    Module 3 B:Scheduling, Co-ordination and Control of Projects: 5th Semester BE, Mechanical, NHCE Page 9 These times are calculated using the expected time for the relevant activities. The earliest start and finish times of each activity are determined by working forward through the network and determining the earliest time at which an activity can start and finish considering its predecessor’s activities. The latest start and finish times are the latest times that an activity can start and finish without delaying the project. LS and LF are found by working backward through the network. The difference in the latest and earliest finish of each activity is that activity’s slack. The critical path then is the path through the network in which none of the activities have slack. Since the critical path determines the completion date of the project, the project can be accelerated by adding the resources required to decrease the time for the activities in the critical path. Such a shortening of the project sometimes is referred to as project crashing. 6. Update the PERT chart as the project progresses: Make adjustments in the PERT chart as the project progresses. As the project unfolds, the estimated times can be replaced with actual times. In cases where there are delays, additional resources may be needed to stay on schedule and the PERT chart may be modified to reflect the new situation. BENEFITS OF PERT: PERT is useful because it provides the following information  Expected project completion time;  Probability of completion before a specified date  The critical path activities that directly impact the completion time;  The activities that have slack time and that can be lend resources to critical path activities;  Activity start and end date. PREREQUISITES:  Personnel should already have a good understanding of formal project management terminology, tools, and techniques  PERT form template of equivalent tool (e.g. software)  Create of project plan  Choose the most appropriate scheduling method  Select and organize a team to perform project tasks.
  • 11.
    Module 3 B:Scheduling, Co-ordination and Control of Projects: 5th Semester BE, Mechanical, NHCE Page 10 Example -1: The following table lists the jobs of a network with their estimates Job (i-j) Duration (days) Optimistic, 𝑡0 Most likely, 𝑡 𝑚 Pessimistic, 𝑡 𝑝 1-2 3 6 15 1-6 2 5 14 2-3 6 12 30 2-4 2 5 8 3-5 5 11 17 4-5 3 6 15 6-7 3 9 27 5-8 1 4 7 7-8 4 19 28 i) Draw the project network ii) Calculate the length and variance of critical project iii) What is the approximate probability that the jobs on the critical path will be completed in 41 days i) ii) The critical path is 1-2-3-5-8 Length of critical path is 36 days Variance of critical path is 4 + 16 + 4 + 1 = 25 Job (i-j) Duration (days) 𝒕 𝒆 = 𝒕 𝟎 + 𝟒𝒕 𝒎 + 𝒕 𝒑 𝟔 𝝈 𝟐 Optimistic, 𝑡0 Most likely, 𝑡 𝑚 Pessimistic, 𝑡 𝑝 1-2 3 6 15 7 4 1-6 2 5 14 6 4 2-3 6 12 30 14 16 2-4 2 5 8 5 1 3-5 5 11 17 11 4 4-5 3 6 15 7 4 6-7 3 9 27 11 16 5-8 1 4 7 4 1 7-8 4 19 28 18 16 1 2 6 3 4 8 7 5 E = 0 L = 0 E2 = 7 L2 = 7 E4 = 12 L4 = 25 E7 = 17 L7 = 18 E6 = 6 L6 = 7 E3 = 21 L3 = 21 E5 = 32 L5 = 32 E8 = 36 L8 = 36 7 75 11 6 14 11 4 18
  • 12.
    Module 3 B:Scheduling, Co-ordination and Control of Projects: 5th Semester BE, Mechanical, NHCE Page 11 iii) Scheduled time = 41 days Expected (estimated time) = 36 days ∴ 𝑧 = 𝑠 𝑡−𝐸 √𝜎2 = 41−36 √25 = 5 5 = 1 for which p=0.84=84% ∴ 84% of jobs in critical path would be completed within 41 days of duration or 16% of jobs in critical path would take longer than 41 days for completion. UNCERTAINTY IN PROJECT SCHEDULES: On some projects, it is easy to estimate durations of activities with confidence. On others, so many uncertainties exist that managers have far less confidence in their ability to accurately estimate. However, project managers still need to tell sponsors and clients how long they believe a project will take and then be held accountable for meeting those dates. One common strategy for handling this potential problem is to construct the best schedule possible and then manage the project very closely. A different strategy is to estimate a range of possible times each individual activity may take and then see what impact that has one on the entire schedule. PERT and Monte Carlo are two methods sometimes used for this approach. Program Evaluation and Review Technique Program evaluation and review technique was developed during the 1950’s to better understand how variability in the individual activity durations impact the entire project schedule. To use PERT, a project team starts by sequencing the activities into a network is as described below Determine new product features 5 Acquire prototype materials 20 Produce prototype 10 Perform Sales Calls 25 Conduct marketing 30 Design Marketing Campaign 10 Design graphics 10 Two Pass Example Schedule Set up
  • 13.
    Module 3 B:Scheduling, Co-ordination and Control of Projects: 5th Semester BE, Mechanical, NHCE Page 12 Determine new product features 5 Acquire prototype materials 20 Produce prototype 10 Perform Sales Calls 25 Conduct marketing 30 Design Marketing Campaign 10 Design graphics 10 0 A 5 5 B 25 25 C 35 5 D 15 15 E 25 15 F 45 45 G 70 Schedule Example First Pass Complete Determine new product features 5 Acquire prototype materials 20 Produce prototype 10 Perform Sales Calls 25 Conduct marketing 30 Design Marketing Campaign 10 Design graphics 10 0 A 5 5 B 25 25 C 35 5 D 15 15 E 25 15 F 45 45 G 70 Schedule Example Second Pass Complete 0 5 15 35 35 45 35 45 15 45 5 15 45 70
  • 14.
    Module 3 B:Scheduling, Co-ordination and Control of Projects: 5th Semester BE, Mechanical, NHCE Page 13 PATH DURATION ABCG 5+20+10+25=60 ADEG 5+10+10+25=50 ADFG 5+10+30+25=70 However instead of creating one estimate for the time to complete each activity, they would create three estimates: optimistic, most likely, and pessimistic. For example, the first activity. “Determine new product features”, will most likely take five days, but it could take as little as four days if everything works well and as long as 12 days if a variety of things interfere. The person scheduling the project then calculates the estimated time to perform each activity as shown in following table. Activity Optimistic, to Most likely, tm Pessimistic, tp Expected,𝒕 𝒆 = 𝒕 𝒐+𝟒𝒕 𝒎+𝒕 𝒑 𝟔 Determine new product features 4 5 12 6 Acquire prototype materials 16 20 30 21 Produce prototype 8 10 12 10 Design marketing campaign 9 10 14 10.5 Design Graphics 6 10 20 11 Conduct Marketing 28 30 50 33 Perform Sales Call 20 25 30 25 Determine new product features 5 Acquire prototype materials 20 Produce prototype 10 Perform Sales Calls 25 Conduct marketing 30 Design Marketing Campaign 10 Design graphics 10 0 A 5 5 B 25 5 D 15 15 E 25 15 F 45 45 G 70 0 5 15 35 35 45 35 45 15 45 5 15 45 70 Two-Pass Complete Schedule Example 25 C 35
  • 15.
    Module 3 B:Scheduling, Co-ordination and Control of Projects: 5th Semester BE, Mechanical, NHCE Page 14 The primary advantage of PERT is that it helps everyone to realize how much uncertainty exists in the project schedule. When people use single time estimates, sometimes there is a tendency to believe that the estimates foretell exactly what will happen. On many projects, a great deal of uncertainty exists, and PERT helps to make this visible. In addition to making overall uncertainty ore visible, calculations often show that the expected time is usually longer than the most likely time can be saved, but if many things go terribly wrong a great deal of time can be lost. However, using PERT involves difficulties. First, it is often hard enough to create one estimate of how long an activity will take, so it takes even more effort (and therefore money). to create three estimates. Second there is no guarantee on how good any of the three estimates are. Third, PERT can underestimate the risk of a schedule running long because it does not accurately address when two or more activities both need to be accomplished before a third one can begin. Since PERT highlights uncertainty in project duration, it logic is very useful to project managers. However, since it has some problems, only a few project managers actually use it to fully calculate and monitor project schedules. Some project managers informally use three estimates for a few key activities on the critical path to get a sense for the amount of uncertainty and to better understand the activities that need close monitoring. Other project managers who want to understand the potential variation use Monte Carlo simulation. It is to be noted that both PERT and Monte Carlo simulations are sometimes used to help understand uncertainty in project schedules. Monte Carlo Simulation Monte Carlo analysis is “a technique that computes, or iterates the project cost or project schedule many times using the input values selected at random from probability distributions of possible costs or durations, to calculate a distribution of possible total project costs or completion dates”. Monte Carlo is more flexible than PERT in that an entire range of all possible time estimates can be used for any activity. The project schedule is calculated many times (perhaps, 1000 or more), and each time the estimate for a particular activity is generated based upon the likelihood of that estimate as determined by the project manager. For example, suppose a project manager estimated that for a particular activity there was 10% chance of taking five days, a 30% chance of taking six days, a 40% chance of taking seven days and remaining 20% chance of taking eight days. Then for each 100 times the computer generated a project schedule, when it came to that activity, 10 times it would choose seven days and 20 times it would choose eight days. The output from the computer would include distribution of how often the project would be expected to take each possible length of time. Many other possible outputs can also be generated for Monte Carlo simulations. Other advantage of Monte Carlo analysis is the flexibility it provides. This allows more realistic estimates. Another advantage is the extent of information it can provide regarding individual activities, the overall project, and different paths through the project that may become critical. A disadvantage of Monte Carlo is the amount of time necessary to estimate not just a most likely duration for each activity, but an entire range of possible outcomes. Another disadvantage is that special software and skill are necessary to effectively use Monte Carlo. This disadvantage is not as large as it once was because more software is being developed.
  • 16.
    Module 3 B:Scheduling, Co-ordination and Control of Projects: 5th Semester BE, Mechanical, NHCE Page 15 DIFFERENT SCHEDULING TECHNIQUES BAR (GANTT) CHARTS A much easier to understand tool for communicating a project schedule is Gantt or bar chart. A graphic display of schedule-related information. In the typical bar chart, schedule activities or work breakdown structure components are listed down the left side of the chart, dates are shown across the top, and activity durations are shown as date-placed horizontal bars. Also called a Gantt chart. After the PERT/CPM analysis is completed, the following phase is to construct the GANTT chart and then to reallocate resources and re-schedule if necessary. Characteristics:  The bar in each row identifies the corresponding task  The horizontal position of the bar identifies start and end times of the task  Bar length represents the duration of the task  Task durations can be compared easily  Good for allocating resources and re-scheduling  Precedence relationships can be represented using arrows  Critical activities are usually highlighted  Slack times are represented using bars with doted lines  The bar of each activity begins at the activity earliest start time (ES)  The bar of each activity ends at the activity latest finish time (LF). Advantages  Simple  Good visual communication to others  Task durations can be compared easily  Good for scheduling resources Disadvantages  Dependencies are more difficult to visualize  Minor changes in data can cause major changes in the chart CONSTRUCTING GANTT CHART: The steps to construct a GANTT chart from the information obtained by PERT/CPM are: 1. Schedule the critical tasks in the correct position. 2. Place the time windows in which the non-critical tasks can be scheduled. 3. Schedule the non-critical tasks according to their earliest starting times. 4. Indicate precedence relationships between tasks
  • 17.
    Module 3 B:Scheduling, Co-ordination and Control of Projects: 5th Semester BE, Mechanical, NHCE Page 16 Example of an early GANTT chart construction: Step 1. Schedule critical tasks: Step 2. Place time windows for non-critical tasks: Step 3. Schedule non-critical tasks Step 4. Indicate precedence relationships:
  • 18.
    Module 3 B:Scheduling, Co-ordination and Control of Projects: 5th Semester BE, Mechanical, NHCE Page 17 DIFFERENCE BETWEEN GANTT CHARTS & PERT CHARTS SI.no GANTT PERT 1 Gantt charts present information in the format of a bar chart. PERT, on the other hand, displays information as a network model. 2 This presentation helps show the percentage of work completed for each task. This presentation helps show the sequence of activities which cannot start until the completion of precedence activity. 3 Interrelation between two tasks may or may not exist. Interrelation exists as no task can be started without finishing the earlier. 4 Ideal for straightforward projects with few interlinking tasks Can be used for any complex type of projects 5 Gantt charts present project tasks and time allocation as the only two pieces of data. PERT charts, while also including project tasks and time allocation, display dependency. 6 Gantt charts are easier to change as a task moves along and it comes closer to completion. Modification in any activity will affect entire project. 7 It is not possible to identify critical activities or critical path It is easy by calculating different start and finish times. 8 Gantt charts are simpler to read PERT charts extend an element of detail to the project scheduling through both the network model's ability to display dependency 9 Tasks in Gantt chart have single time Tasks in PERT chart have average of three times. PROJECT DIRECTION COMMUNICATION IN PROJECT Project Direction: project direction refers to the use of authority to channelize the various activities of the project on desired lines. It is mainly concerned with the implementation phase of the project. When schedules are authorized, they become working documents. Executive agencies or individuals will then strictly follow the plans and schedules.
  • 19.
    Module 3 B:Scheduling, Co-ordination and Control of Projects: 5th Semester BE, Mechanical, NHCE Page 18 Project Communication: The entire process of direction, co-ordination and control in a project revolves around communication. Through direction wields to coordination and control, direction itself is effective only when there are two way communications all around about 60% of management problems are caused in whole or in party by faulty management communication. Communication does not merely mean passing on a message. But it most includes the understanding of the message. If the message sent by the sender is not understood by the receiver, then no communication is said to have taken place. Merely providing the channels for communication is not enough. Effort must be directed towards clarifying and making sure that the receiver has received and clearly understood what was intended to be conveyed. E.g., A drawing is sent by the sender, but he does not care to check if it has been received and can be put to use. The sender may even send the wrong drawing. The receiver of drawing also may not acknowledge the receipt of the drawing. When one person asks another what he thinks about an issue, the respondent would invariably repeat the question first before making a reply. This is to make sure that he has correctly understood the question. Communication has two dimensions, physical aspects include passing on a menu, data. instruction etc., while mental aspects include listening skills, empathy etc., Problems in Communication Since the communication is the key to successful project management, every effort must be made to ensure complete communication between all the members of the project. Both the physical and mental aspects of communication must be taken care of some problems are:  Organization Chart: The organization chart is supposed to provide the official communication channel but some organization charts that are not very clear become a major hindrance of communication. Remedy: Departmentalization and chain of command must be allowed but they should not act as a barrier for communication. The orders must flow along the chain of command but the information flow-must not have any such restrictions.  Physical Distance: The physical distance between two interacting groups will usually present a barrier in communication. Though the people may be working in the same office, shutting from cabin to the other can create a problem. The physical distance can also be created by making oneself unapproachable even in open work environments. Remedy: Have all the working groups in the same office and provide them with good communication equipment.  Absence of Communication Devices: Sometimes the two groups that are working may be such that one is on the site while the other is in the office thus it is necessary to provide both the groups with appropriate communication devices to bridge the distance between the two groups. Sometimes it is better to over-communicate as to prevent rumors filling the voids created due to the communication voids. Lack of clear communication can also lead to misunderstanding. lack of trust, loss of confidence etc., Some actions that can be taken to improve communication are:  Selection and installation of appropriate communication devices.  Organizing review meeting at predetermined frequencies.
  • 20.
    Module 3 B:Scheduling, Co-ordination and Control of Projects: 5th Semester BE, Mechanical, NHCE Page 19  Installing a structure reporting program.  Running an in house magazine.  Using desktop computers for communication.  Implementing a routine communication system and procedure. ROLE OF MIS IN PROJECT CONTROL The Project Management Information System (PMIS) is a standardized set of automated tools available within the organization and integrated in to a system. The PMIS is used by the project management team to support generation of a project charter, facilitate feedback as the document is refined, controlled changes to the project charter, and release the approved document. An information system consisting of the tools and techniques used to gather, integrate, and disseminate the outputs of project management processes. It is used to support all aspects of the project from initiating through closing, and can include both manual and automated systems. Project management information system (e.g., an automated tool, such as a scheduling software tool, a configuration management system, an information collection and distribution system, or web interfaces to other online automated systems). The project management information system, which is part of the environmental factors, provides access to tools, such as a scheduling tool, a work authorization system, a configuration management system, an information collection and distribution system, or interfaces to other online automated systems. Automated gathering and reporting on key performance indicators (KPI) can be part of this system. Basic Requirements for a Project Management Information System:  Each project header must be able to update his project on a monthly basis utilizing project management forms.  The project manager must be able to manually device the information needed to measure the progress if the project from the reporting systems.  The project leader must be allowed to review his project plans and predict the cash required every week or month to complete the project.  Analysis of the reasons in the exception report must be done by the project manager.  The analysis reports must be then typed up for distribution. Optimum Project Management Information System may be described as follows:  The existing information system are reduced to 3 elements:  Human resources  Financial resources  Material resources  Direct entry of data is via terminals with cathode ray tube (CRT’s)  Individual reports may be generated for other than project management needs.  Information is formulated along with estimates supplied by the project leader to display a current summary, plan and analysis on the CRT or as a hard copy.  Project plans can be transferred by project leaders to line management via a CRT
  • 21.
    Module 3 B:Scheduling, Co-ordination and Control of Projects: 5th Semester BE, Mechanical, NHCE Page 20  The system will have the capability to access central pertinent files  The system will have the capability for data correction at the original sources, thus reducing the labor required. PERFORMANCE CONTROL A project on its completion must perform. Failure of the project to come up in time or budget can be tolerated, but failure to perform will never be condoned. Personnel are criticized not only for the time and cost over-run, but for non-performance they are cursed day in and day out by the plant operation personnel. Performance control like progress control will require continuous monitoring during the production phase. This must however, be preceded by right specification, selection of right vendors, contractors and above all right contractual stipulations regarding warranties and guarantees. The warrantees in this context specifies the quality or performance the purchaser has a right to rely upon. The guarantee concerns what will be done by the seller, contractor or manufacture in the vent if goods are found defective or do not meet certain standards of performance. This warranty normally deals with a specific period of time and performance and this is what the purchaser bargains and pays for. The guarantee is a liquidate damage clause that refers to broken warranties. A guarantee costs the seller or contractor or manufacturer money or its equivalent in material parts or services. But, a project cannot simply depend on the supplier’s warranties and guarantees. Due to project slippage, the warranty period may often expire before the project is completed. What the owner may get in terms of liquidated damages even if they could ever be realized, would be a poor compensation for the perpetual headache caused by a non performing plant. Ongoing performance control is therefore essential. Performance control starts with identification of performance parameters. Which performance parameters are critical for viability of the project must be first establish in clear terms. Output certainly is one performance parameter: raw materials, power consumption per unit of production could be others. The design and specification must be made to meet these performance requirements. The subsequent stages of project execution, like ordering and manufacture must ensure that these requirements are not traded off for some other short term benefits. Thus a single performance parameter would require to be tracked through all the stages of the project execution till the final performance guarantee confirms achievement of the performance. SCHEDULE CONTROL Schedule control is to ensure adherence to the agreed time schedule for the project. It is not an independent activity. Schedule has to be used as a basis for direction, communication, coordination and progress control or else there can be no schedule control. Schedules and scheduling systems have to form an inseparable part of the project execution for exercise of schedule control. Why Schedule control? The thrust is to convert all available inputs to outputs by taking commitments from the working groups. But since input for one group has to come from the output of another, all the groups have to progress in a desired way or else, the progress will be uneven. If this happens the project completion will be delayed. It is also possible that a working group has achieved 99% progress and yet due to lack of single input completion, it can be delayed by several months. Monitoring and control of project and time becomes essential besides progress control to ensure adherence to project schedule.
  • 22.
    Module 3 B:Scheduling, Co-ordination and Control of Projects: 5th Semester BE, Mechanical, NHCE Page 21 Types of Schedule Control  Preventive schedule control: It is good practice to keep a close watch on the areas which normally delay a project and take all possible steps to make sure that delays do not occur. This means that, project management can use past experiences of similar nature to forecast vulnerable areas and act in advance instead of reacting to the forecast of completion dates of the current project. Delays occur more in the beginnings of the project than towards the end. The delays that often experience at the later part of the project are usually a hangover of the past. Thus schedule control must start at the beginning of the work and it is here that past experiences will prove invaluable.  Predictive Schedule Control: Starts with the forecast of project completion if the forecast indicates that the project completion requirements are going to be met, no action is initiated. This forecast is to be provided to the controlling authority in the form of the feedback report. If the forecast indicates that the project completion data may not be met, immediate investigations are ordered to find out the ways and means of bringing the project back to schedule. COST CONTROL Cost control is not only monitoring of costs and recording massive quantities of data, but also analyzing the data in order to take corrective action before it is too late. Cost control must be performed by all personnel who incur costs. It is the cost which reflects performance in all areas. A well-managed project will incur lower cost than one which is not. If the project cost can be brought down without compromising on the parameters that would make a project to perform efficiently. It would indicate excellent cost management. Cost control therefore should not be mere accounting of costs to report expenditures but must also include monitoring all the cost components thus ensuring the completion of the project at optimal cost. On-going cost reduction must be involved with lowering costs, without lowering the performance. Any revision in the cost estimate made must be treated as only a revised forecast of the total project cost and must not be treated as licenses for additional expenditure. Cost control should therefore refer to the manipulative efforts during the various phases of the project for reducing the cost not yet incurred. Cost control must include;  Cost estimation  Company cash flow  Cost accounting  Direct labor costing  Project cash flow  Overhead rate costing  Incentives, penalties and profit sharing COST CONTROL: Tools and Techniques  Cost Change Control System: A cost change control system, documented in the cost management plan, defines the procedures by which the cost baseline can be changed. It includes the forms, documentation, tracking systems, and approval levels necessary for authorizing changes. The cost change control system is integrated with the integrated change control process.
  • 23.
    Module 3 B:Scheduling, Co-ordination and Control of Projects: 5th Semester BE, Mechanical, NHCE Page 22  Performance Measurement Analysis: Performance measurement techniques help to assess the magnitude of any variances that will invariably occur. The earned value technique (EVT) compares the cumulative value of the budgeted cost of work performed (earned) at the original allocated budgeted amount to both the budgeted cost of work scheduled (planned) and to the actual cost of work performed (actual). This technique especially useful for cost control, resource management, and production. An important part of cost control is to determine the cause of a variance, the magnitude of the variance, and to decide if the variance requires corrective action. The earned value techniques use the cost baseline contained in the project management plan to assess project progress and the magnitude of any variations that occur. The earned value technique involves developing these key values for each schedule activity, work package, or control account:  Planned Value (PV): PV is the budgeted cost for the work scheduled to be completed on an activity or WBS component up to a given point in time.  Earned Value (EV): EV is the budgeted amount for the work actually completed on the schedule activity or WBS component during a given time period.  Actual Cost (AC): AC is the total cost incurred in accomplishing work on the schedule activity or WBS component during a given time period. This AC must correspond in definition and coverage to whatever was budgeted for the PV and the EV (e.g., direct hours only, direct costs only, or all costs including indirect costs)  Estimate to complete (ETC) and Estimate at completion (EAC): The PV, EV, and AC values are used in combination to provide performance measures of whether or not work is being accomplished as planned at any given point in time. The most commonly used measures are cost variance (CV) and schedule variance (SV). The amount of variance of the CV and SV values tend to work being accomplished. Predetermined acceptable variance values that will decrease over time as the project progresses towards completion can be established in the cost management plan.  Cost Variance (CV): CV equals earned value (EV) minus actual cost (AC). The cost variance at the end of the project will be the difference between the budget at completion (BAC) and the actual amount spent. Formula: CV = EV – AC  Scheduled Variance (SV): SV equals earned value (EV) minus planned value (PV). Schedule variance will ultimately equal zero when the project is completed because all of the planned values will have been earned. Formula: SV = EV – PV These two values, the CV and SV, can be converted to efficiency indicators to reflect the cost and schedule performance of any project.  Cost Performance Index(CPI): A CPI value less than 1.0 indicates a cost overrun of the estimates. A CPI value greater than 1.0 indicates a cost underrun of the estimated. CPI equals the ratio of the EV to the AC. The CPI is the most commonly used cost-efficiency indicator. Formula: CPI = EV/AC  Cumulative Cost Performance Index(CPIC ) The cumulative CPI is widely used to forecast project costs at implementation. CPIC equals the sum of the periodic earned
  • 24.
    Module 3 B:Scheduling, Co-ordination and Control of Projects: 5th Semester BE, Mechanical, NHCE Page 23 values (EVC ) divided by the sum of the individual actual costs (ACC ). Formula: CPIC =EVC /ACC .  Schedule Performance Index (SPI): The SPI is used in addition to the schedule status, to predict the completion date and is sometimes used in conjunction with the CPI to forecast the project completion estimates. SPI equals to the ratio of the EV to the PV. Formula: SPI = EV/PV Fig shows S-curves to display cumulative EV data for a project that is over budget and behind the work plan. The earned value technique in its various forms is a commonly used method of performance measurement. It integrates project scope, cost (or resource) and schedule measures to help the project management team assess project performance.  Forecasting: Forecasting includes making estimates or predictions of conditions in the project’s future based on information and knowledge available at the time of the forecast. Forecasts are generated, updated, and reissued based on work performance information provided as the project is executed and progressed. The work performance information is about the project’s performance and any information that could impact the project in the future, for example, estimate at completion and estimate to complete.
  • 25.
    Module 3 B:Scheduling, Co-ordination and Control of Projects: 5th Semester BE, Mechanical, NHCE Page 24 The earned value technique parameters of BAC, actual cost (ACC ) to date, and the cumulative CPIC efficiency indicator are used to calculate ETC and EAC, where the BAC is equal to the total PV at completion for a schedule activity, work package, control account, or other WBS component. Formula: BAC = total cumulative PV at completion Forecasting techniques help to assess the cost or the amount of work to complete schedule activities, which is called the EAC, Forecasting techniques also help to determine the ETC, which is the estimate for completing the remaining work for a schedule activity, work package, or control account. While the earned value technique of determining EAC and ETC is quick and automatic, it is not as the project team. The ETC forecasting technique based upon the performing organization providing the estimate to compete is:  ETC based on new estimate: ETC equals the revised estimate for the work remaining, as determined by the performing organization. This more accurate and comprehensive completion estimate is an independent, non-calculated estimate to complete for all the work remaining, and considers the performance or production of the resource(s) to date. Alternatively, to calculate ETC using the earned value data, one of two formulas is typically used:  ETC based on atypical variances: This approach is most often used when the current variances are seen as atypical and the project management team expectations are that similar variances will not occur in the future variances will not occur in the future. ETC equals the BAC minus the cumulative earned value to date (EVC ). Formula: ETC = (BAC-EVC )  ETC based on typical variances: This approach is often used when current variances are seen as typical of future variances. ETC equals the BAC minus the cumulative EVC (the remaining PV) divided by the cumulative cost performance index (CPIC ). Formula: ETC = (BAC-EVC )/CPIC An EAC is a forecast of the most likely total value based on project performance and risk quantification. EAC is the projected or anticipated total final value for a schedule activity, WBS component, or project when the defined work of the project is completed. On EAC is forecasting technique is based upon the performing organization providing an estimate at completion:  EAC using a new estimate: EAC equals the actual costs to date (ACC ) plus a new ETC that is provided by the performing organization. This approach is most often used when past performance shows that the original estimating assumptions were fundamentally flawed or that are no longer relevant due to a change in conditions. Formula: EAC = ACC + ETC The most common forecasting techniques for calculating EAC using earned value data are some variations of:  EAC using remain budget: EAC equals ACC plus the budget required to complete the remaining work, which is the budget at completion (BAC) minus the earned value (EV). This approach is most often used when current variances are seen as atypical and the project management team expectations are that similar variances will not occur in the future. Formula: EAC = ACC + BAC-EVC
  • 26.
    Module 3 B:Scheduling, Co-ordination and Control of Projects: 5th Semester BE, Mechanical, NHCE Page 25  EAC using CPIC : EAC equals actual costs to date (ACC ) plus the budget required to complete the remaining work, which is the BAC minus the EV, modified by a performance factor (often the CPIC ). This approach is most often used when current variances are seen as typical of future variances/ Formula: EAC = ACC + ((BAC – EVC )/CPIC ) Each of these approaches can be the correct approach for any given project and will provide the project management team with a single if the EAC forecasts are not within acceptable tolerances.  Project Performance Reviews: Performance reviews compare cost performance over time, schedule activities or work packages overrunning and underrunning budget (planned value), milestones due, and milestones met. Performance reviews are meetings held to assess schedule activity, work package, or cost account status and progress, and are typically used in conjunction with one or more of the following performance-reporting techniques:  Variance analysis: Variance analysis involves comparing actual project performance to planned or expected performance. Cost and schedule variances are the most frequently analyzed , but variances are the most frequently analyzed, but variances from plan in the areas of project scope, resource, quality, and risk are often of equal or greater importance.  Trend analysis: Trend analysis involves examining project performance over time to determine if performance is improving or deteriorating.  Earned value technique: The earned value technique compares planned performance to actual performance.  Project Management Software: Project management software, such as computerized spreadsheets, is often used to monitor PV versus AC, and to forecast the effects of changes or variances.  Variance Management: The cost management plan describes how cost variances will be managed, for example, having different responses to major or minor problems. the amount of variance tends to decrease as more work is accomplished. The larger variances allowed at the start of the project can be decreased as the project nears completion. Example: Use the following information to answer parts a through f. Describe what the results of each calculation mean to you as a project manager. What do you propose to do? PV = $500,000 EV = $350,000 AC = $550,000 BAC = $1,200,000 a) Calculate the schedule variance (SV) b) Calculate the cost variance (CV) c) Calculate the schedule performance index (SPI) d) Calculate the cost performance index (CPI) e) Calculate the estimate to complete (ETC) f) Calculate the estimate at completion (EAC) Solution:
  • 27.
    Module 3 B:Scheduling, Co-ordination and Control of Projects: 5th Semester BE, Mechanical, NHCE Page 26 a) Schedule variance (SV) = EV – PV = 350000-500000 = - $150000 (Project is behind the schedule because the variation is negative i.e., unfavorable) b) Cost variance (CV) = EV – AC = 350000 – 550000 = - $200000 (over budget because the variation is negative i.e., unfavorable) c) Schedule Performance Index (SPI) = EV/PV = 350000/500000 = 0.7 = 70% (project is behind schedule because work accomplished is 70% of planned) d) Cost Performance Index (CPI) = EV/AC = 350000/550000 = 0.63 = 63% (Project is over budget because it has only received $0.63 worth of results for every dollar spent) e) Estimate to Complete (ETC) = (BAC – EV)/CPI = (1200000 – 350000)/63% = $ 1,349,206 (It is expect to pay more for the remaining project work than it originally expected to pay for the entire project) f) Estimate at Completion (EAC) = AC + ETC = 550000 + 1349206 = $1,899,206 (Because project cost efficiency is 63% of actual plan (as learned from CPI), unless work become more efficient, it can expect to pay double the original estimation)