The document covers project management, defining it as the planning, scheduling, and controlling of resources for a major output. It discusses the work breakdown structure (WBS), three types of projects (pure, functional, matrix), and techniques like PERT and CPM for managing project timelines and costs. Additionally, it addresses project planning phases, the critical path method, and concepts such as slack time and project crashing for optimizing project delivery.


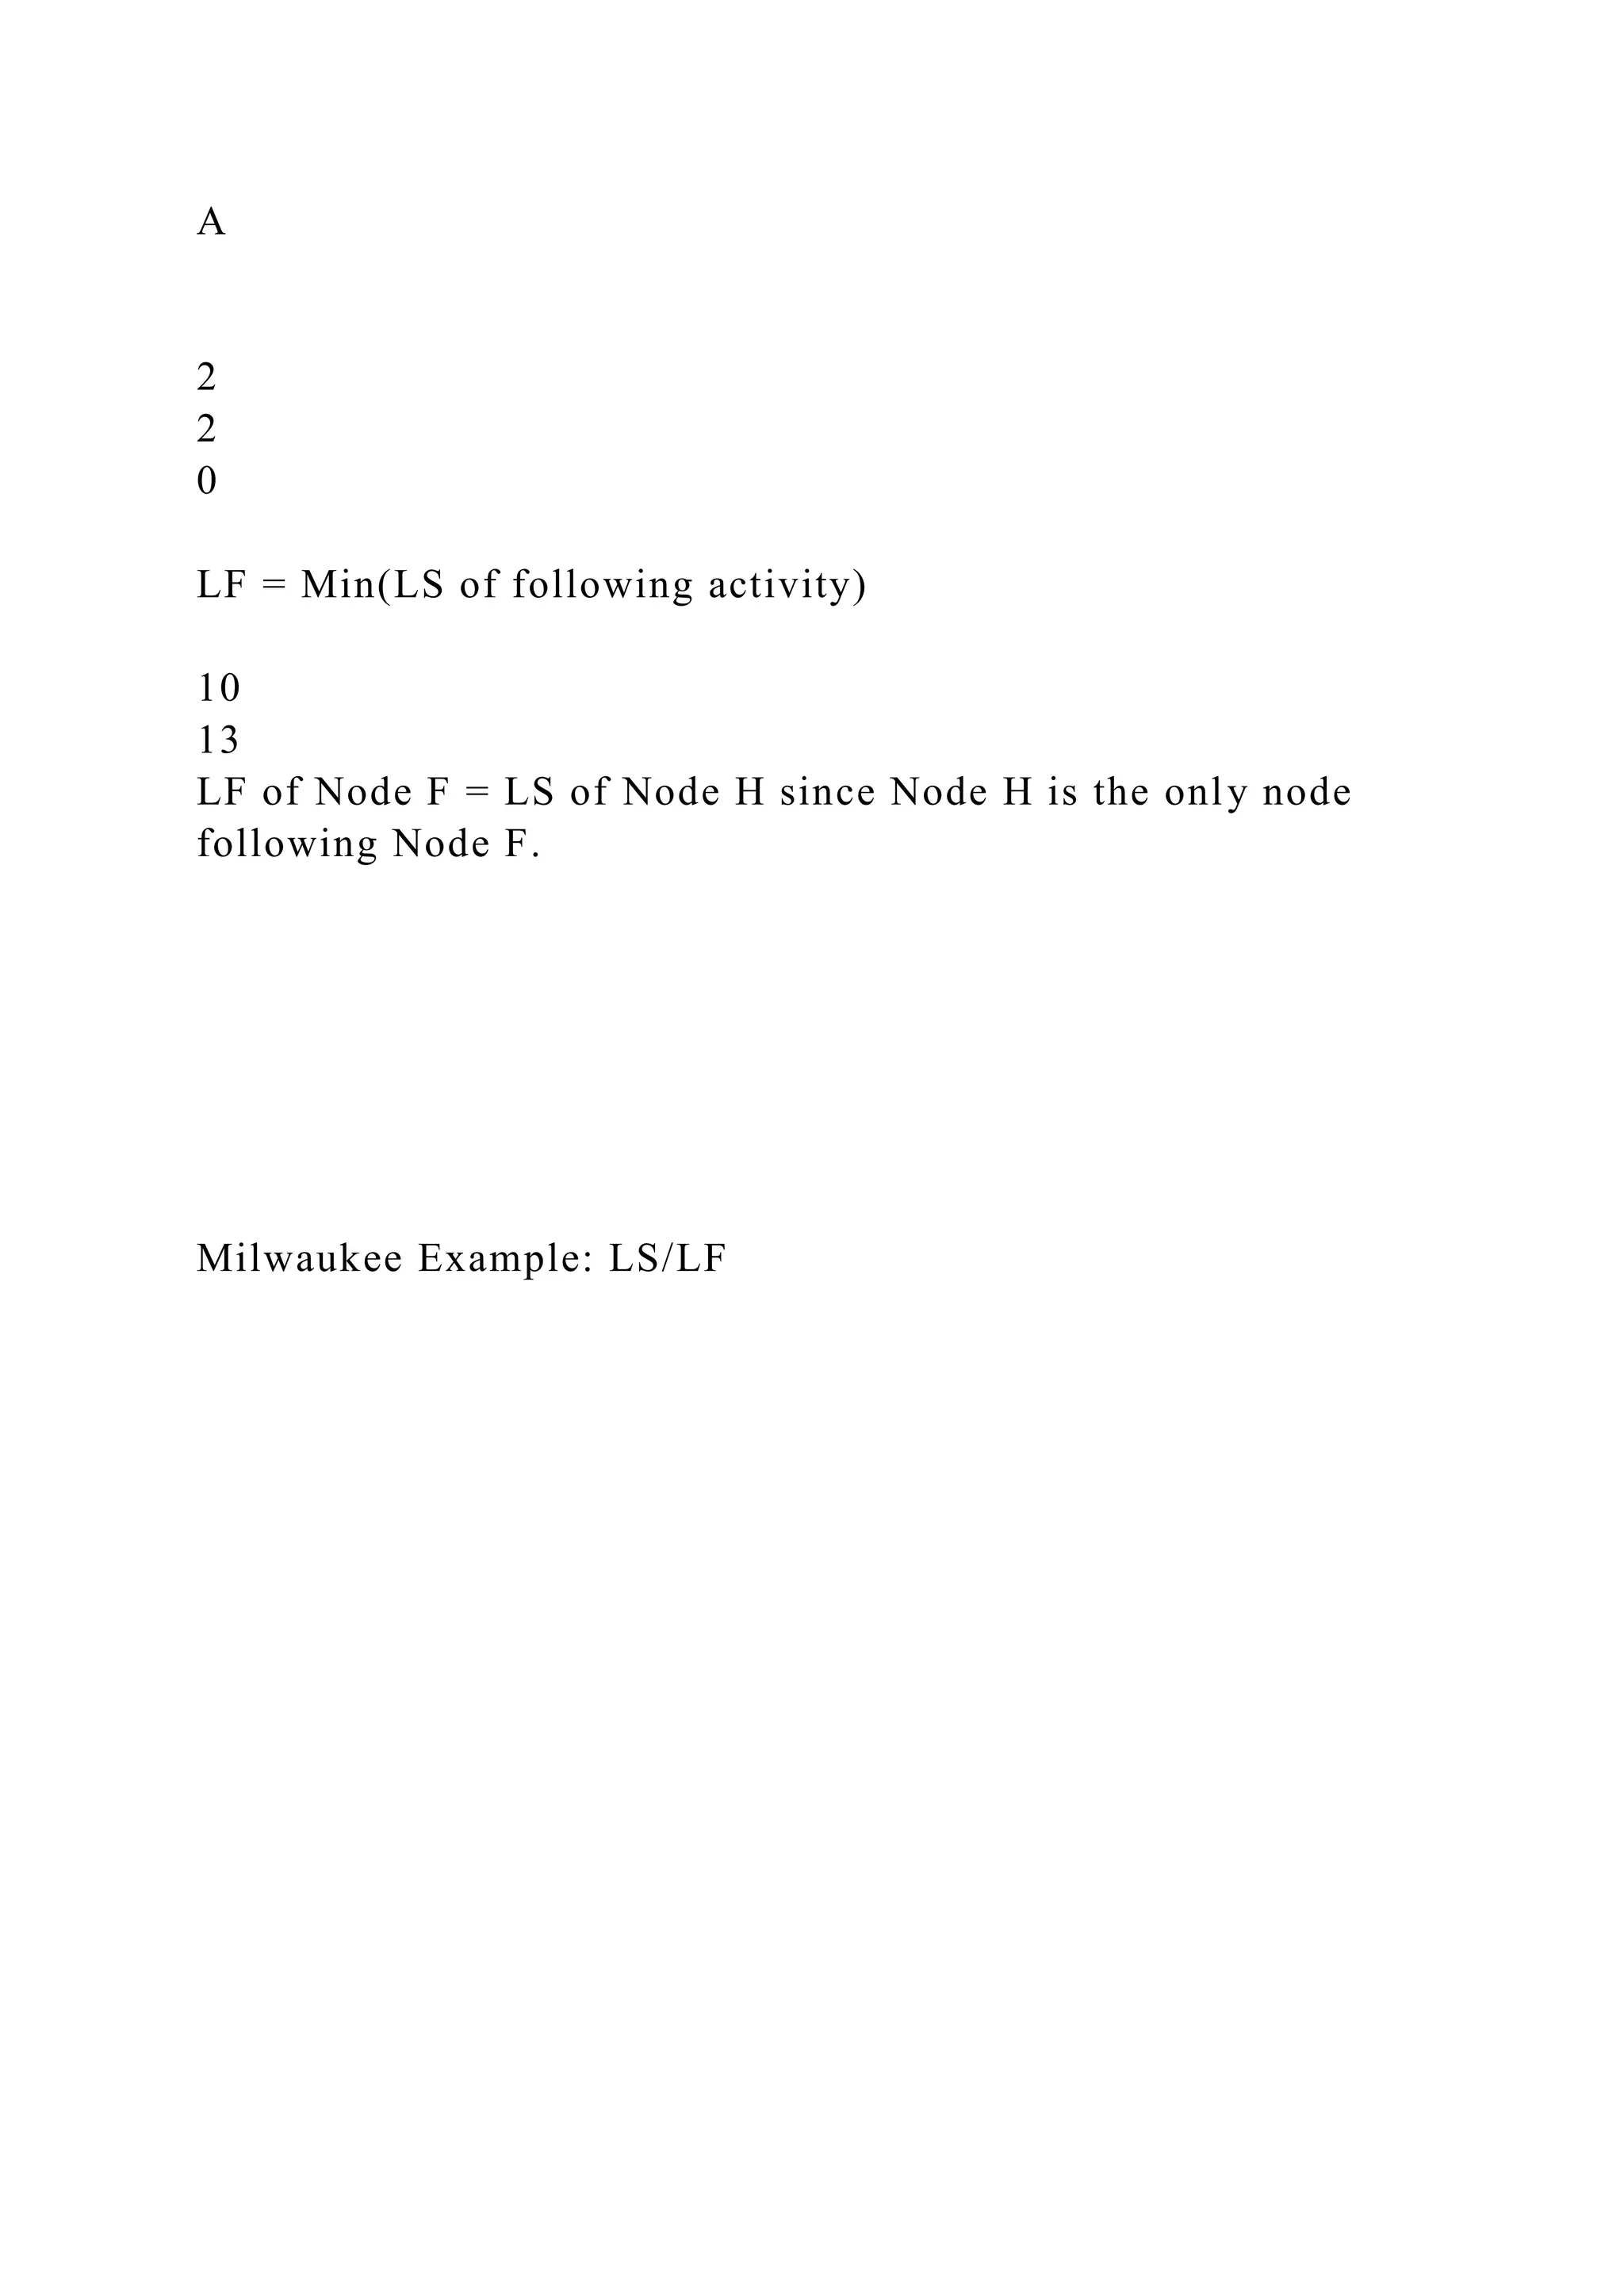


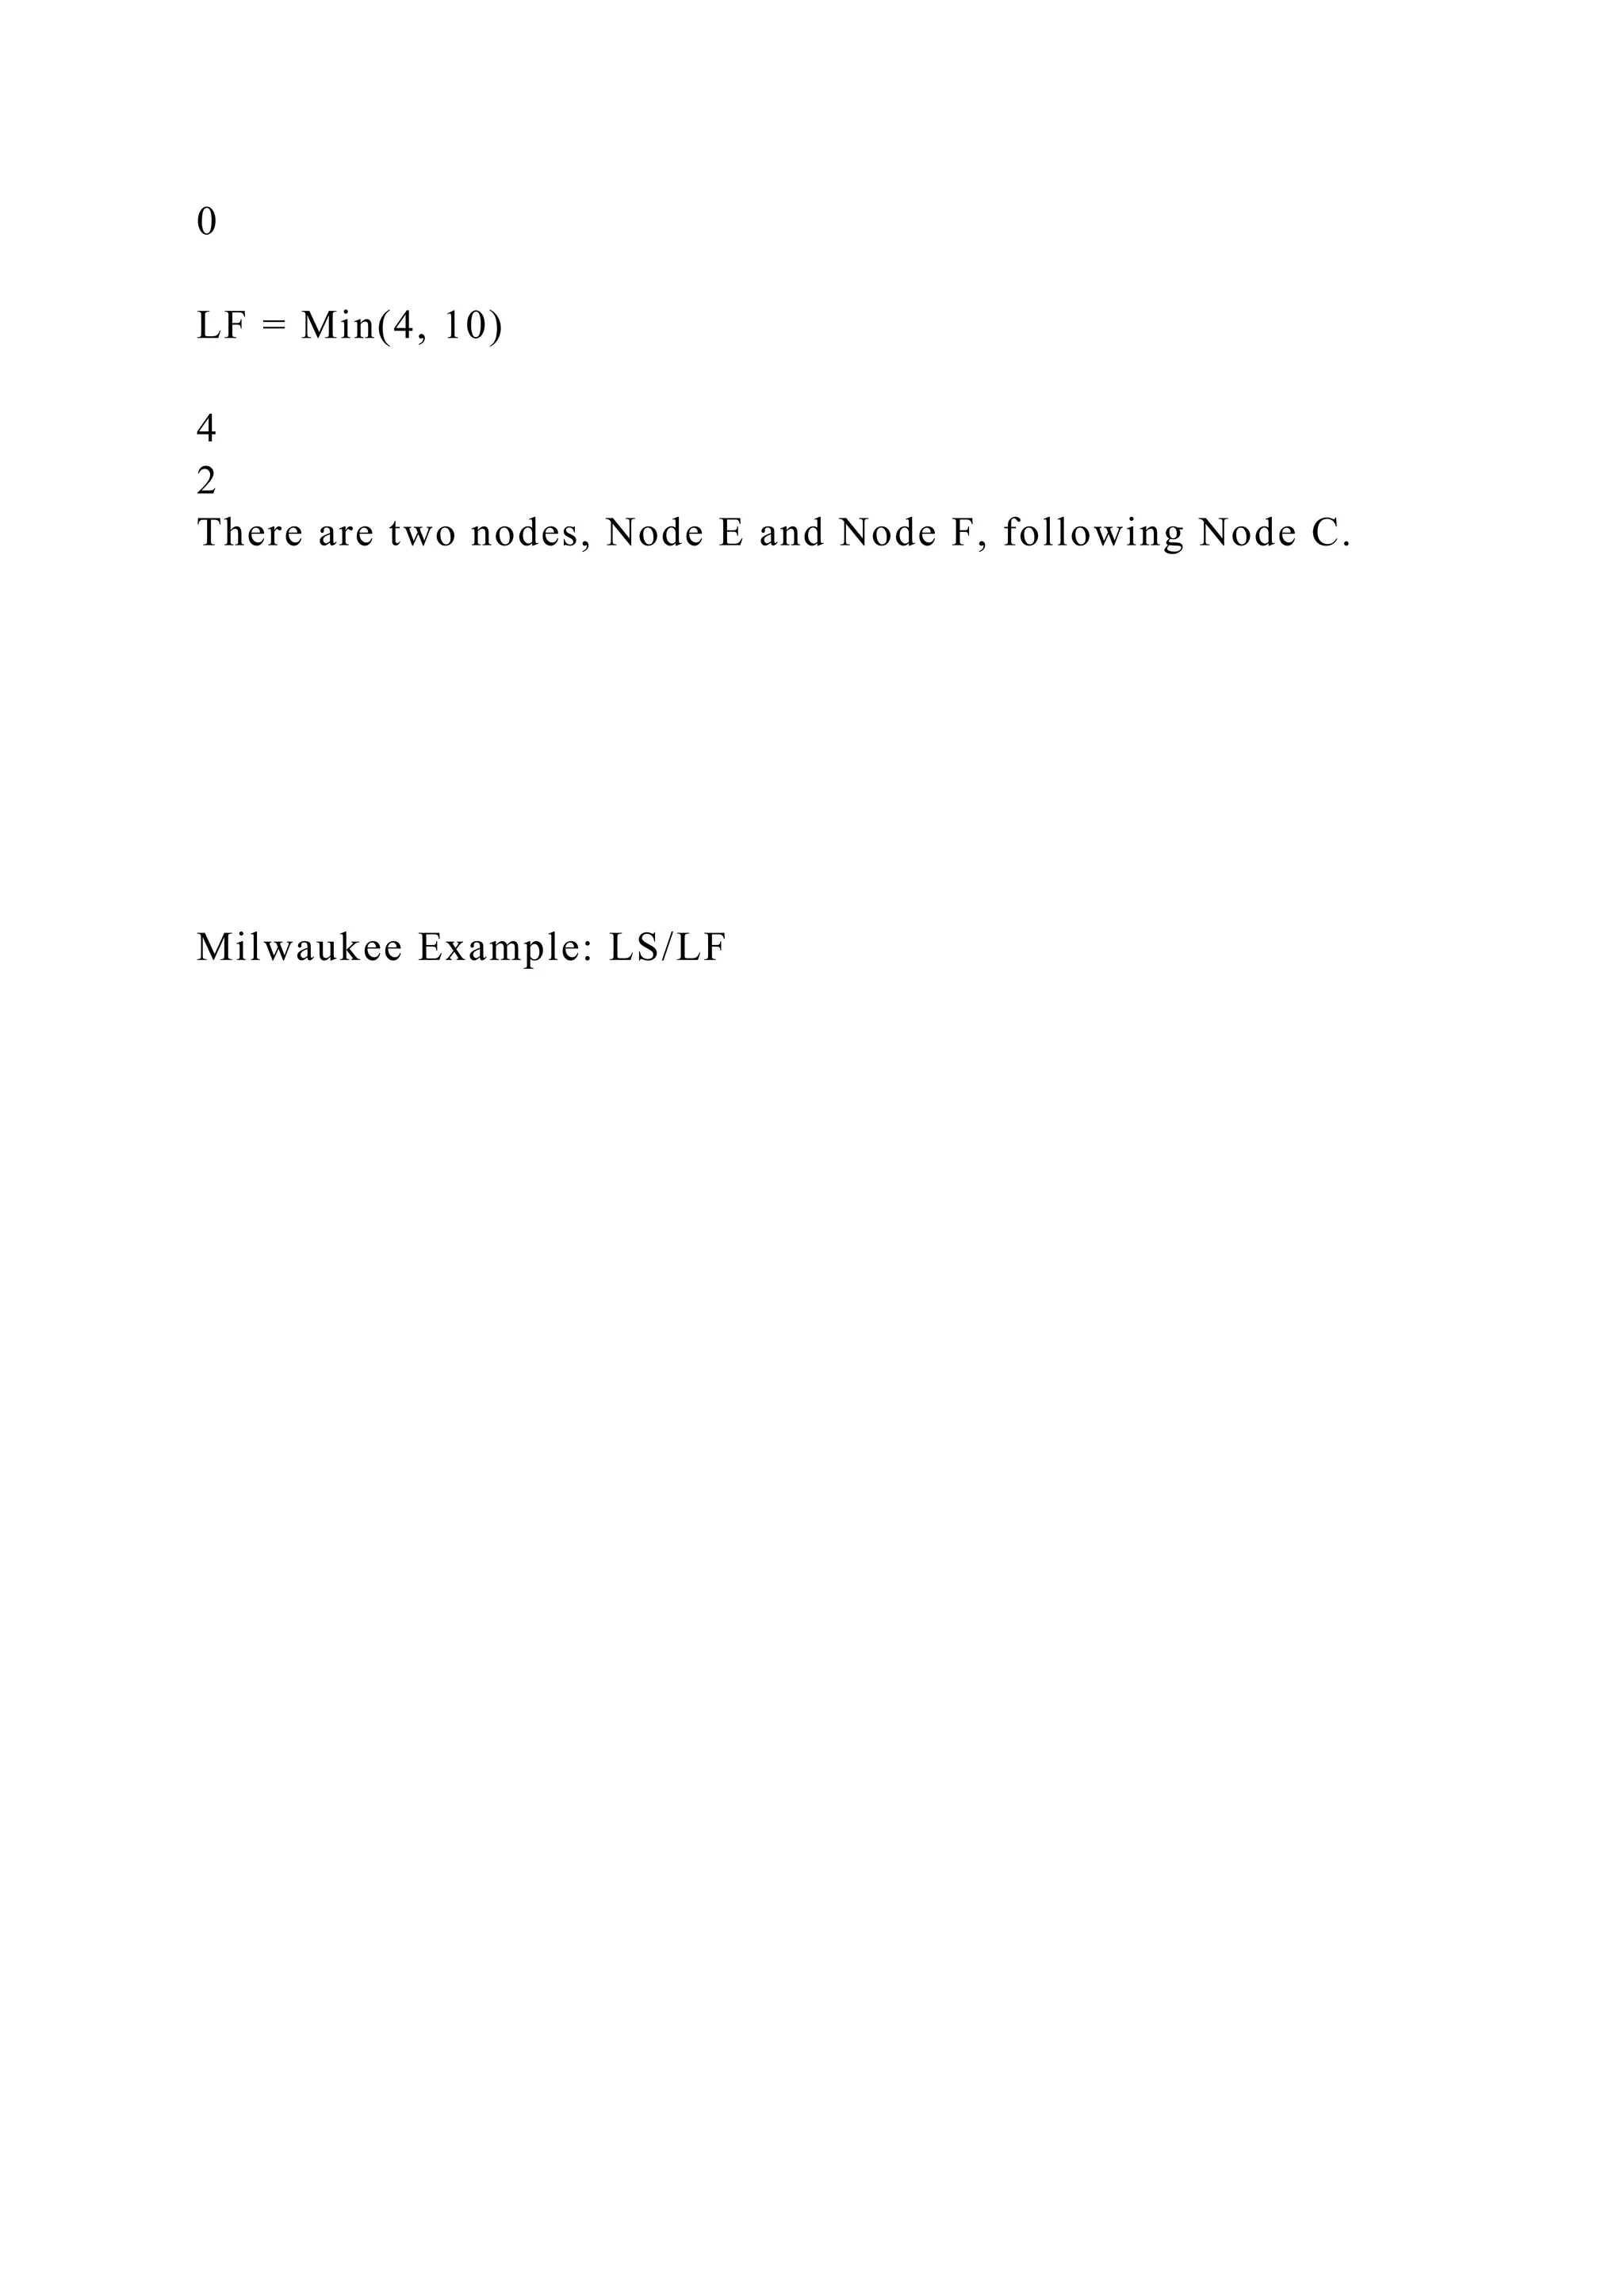


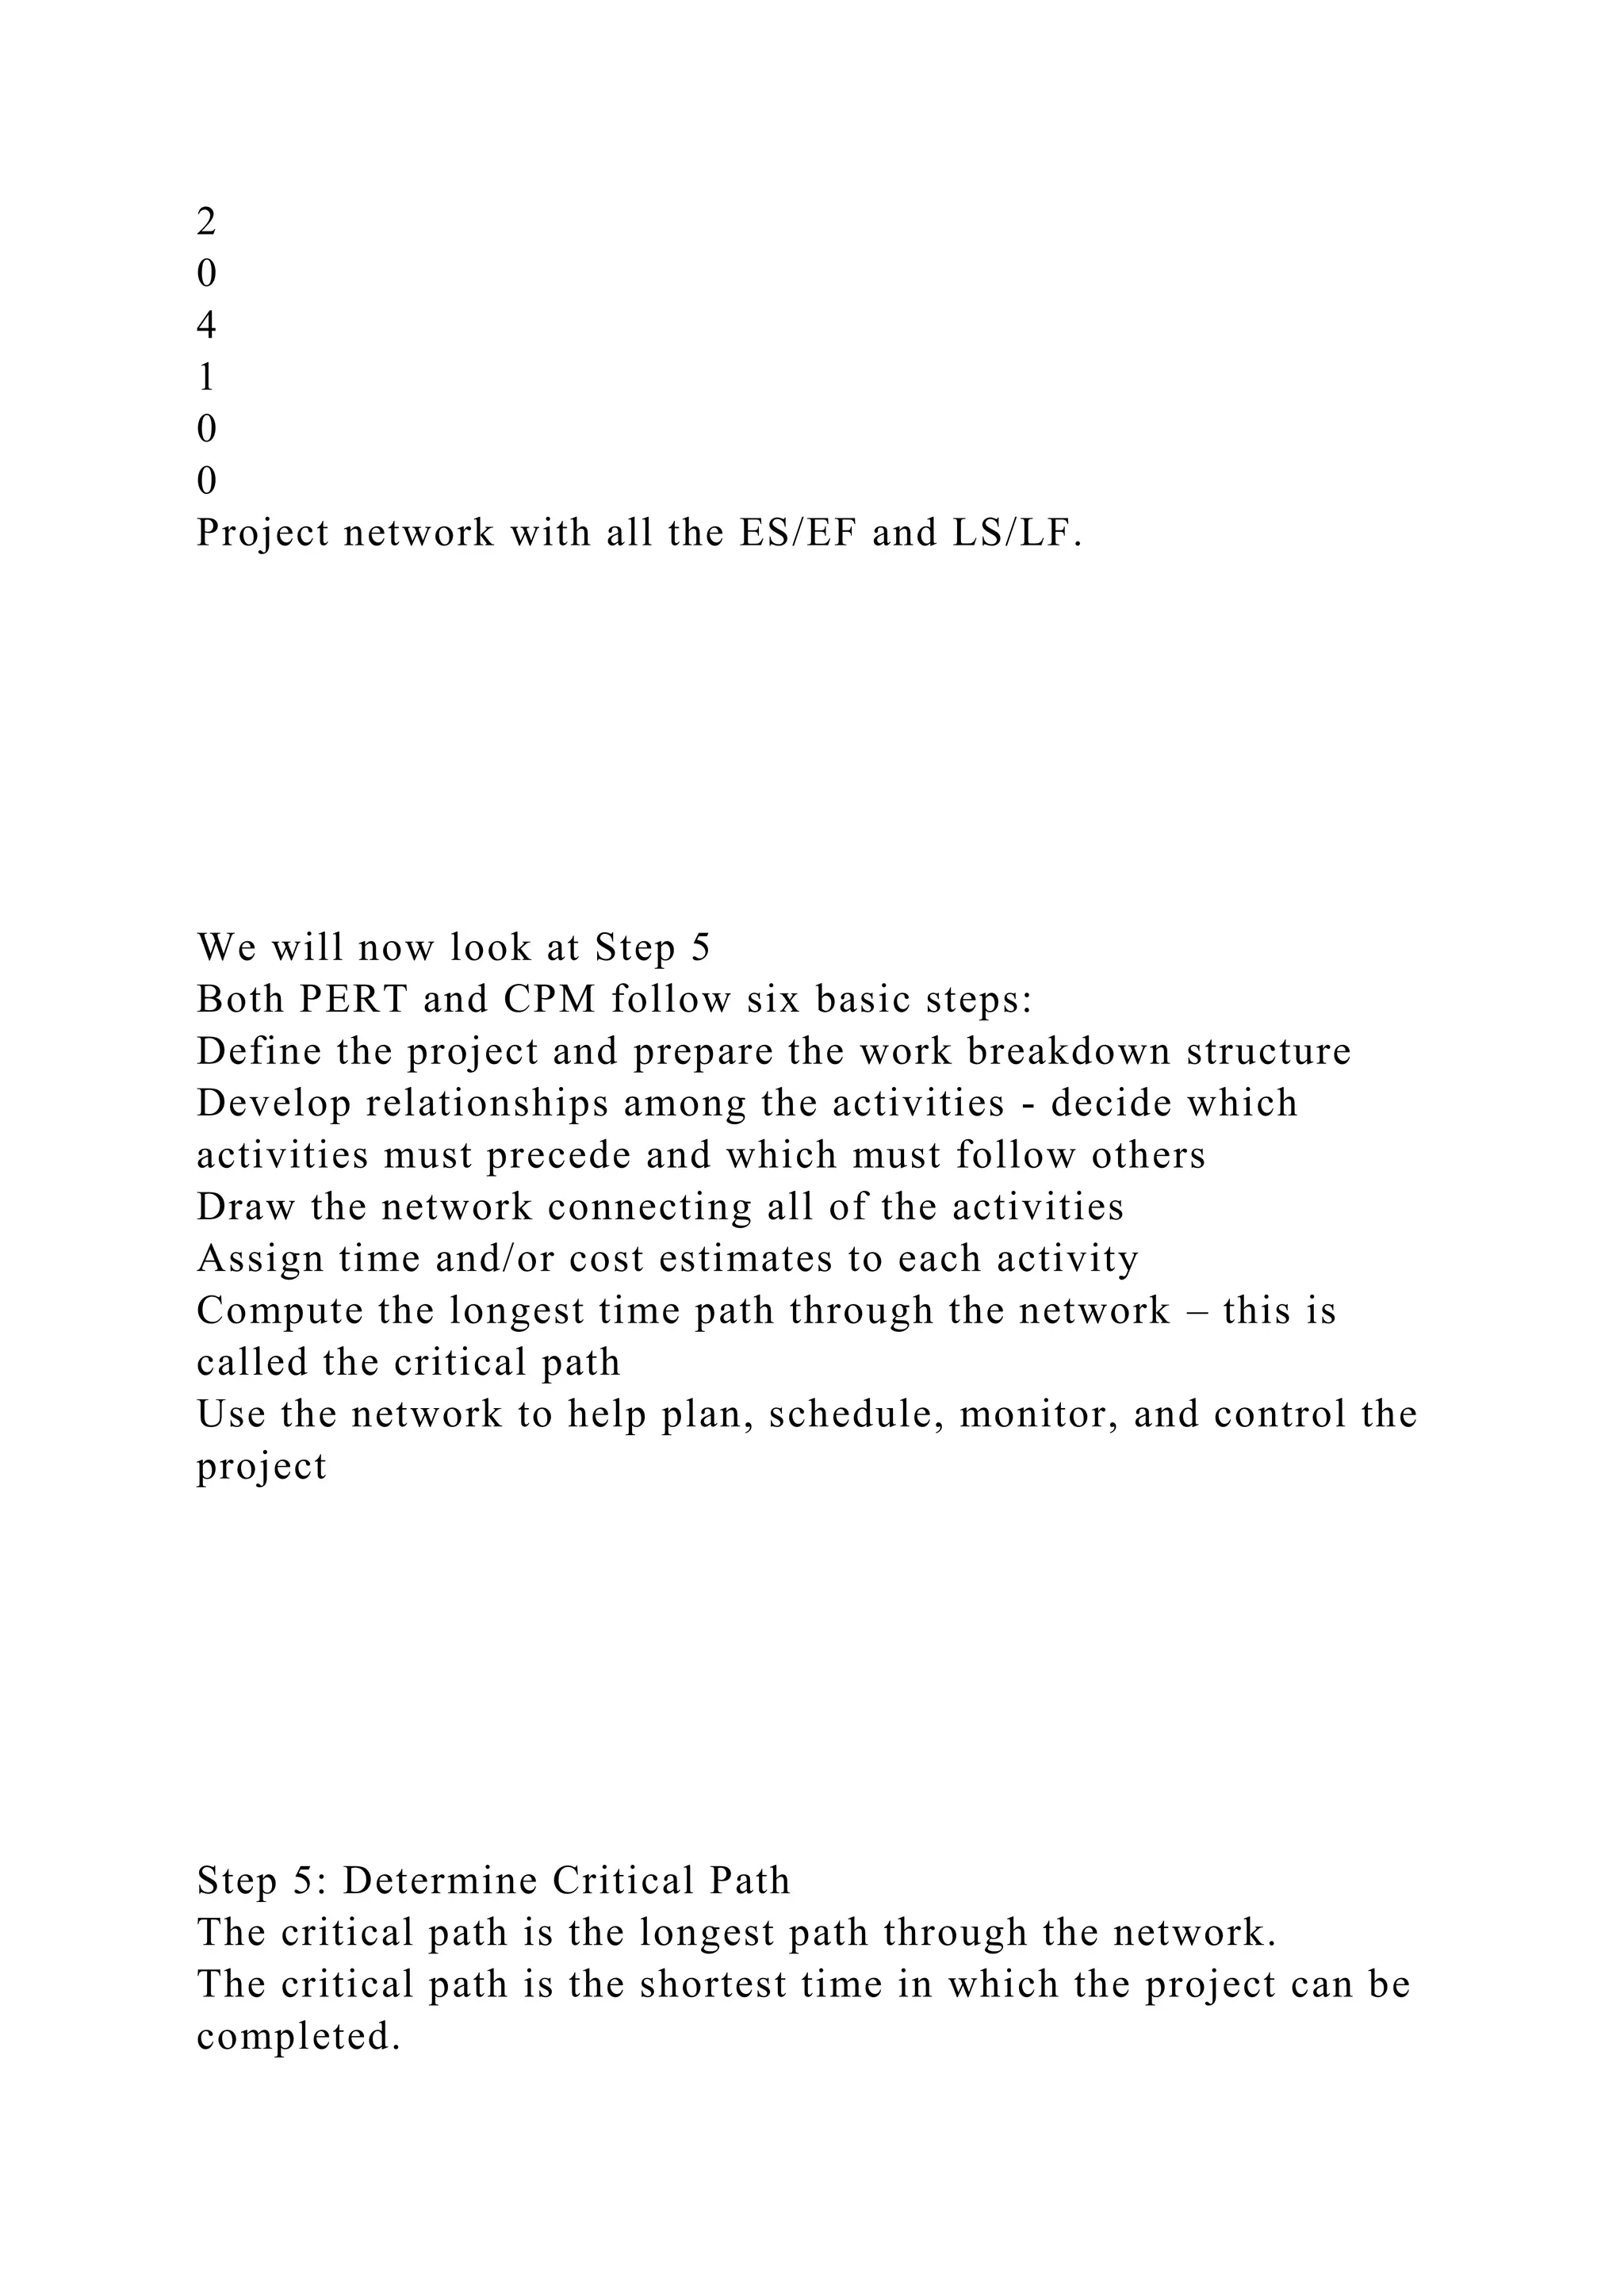


![the final grade.
Two Exams
There will be two non-cumulative exams in total. Each accounts
for 35% of the final grade. The exams will be individual, timed,
and open-book/notes. Only multiple-choice questions will be
given on the exams.
Contact information
Course Website: https://www.uhv.edu/elearning/login.aspx
Email: [email protected] or via “Messages” function in Learn 9
My Office: Room 338, Brazos Hall, UHSSL
Office Hours: 4:00 pm – 5:00 pm on Tuesdays or by
appointment (You can either drop by my office in Brazos Hall
or meet me online at: https://meetonline.uhv.edu/su15oscm/)
Office Phone number: 832-842-2958
For technical questions about Learn 9, please email our online
support technicians at [email protected] .](https://image.slidesharecdn.com/operationsandsupplychainmanagementmgmt3306lecture02i-221112193111-565653d9/75/Operations-and-Supply-Chain-ManagementMGMT-3306Lecture-02I-docx-74-2048.jpg)