Downloaded 24 times


This document outlines the use of scenarios in Excel for data analysis, highlighting their function as tools for 'what-if' analysis to predict outcomes based on changing variables. It explains how to create, edit, and switch between scenarios, as well as how to generate reports from them. Additionally, it provides guidance on adding scenarios and leveraging pivot tables for further analysis.
Introduction to scenarios in Excel as tools for data analysis, providing a snapshot of outcomes based on changing conditions.
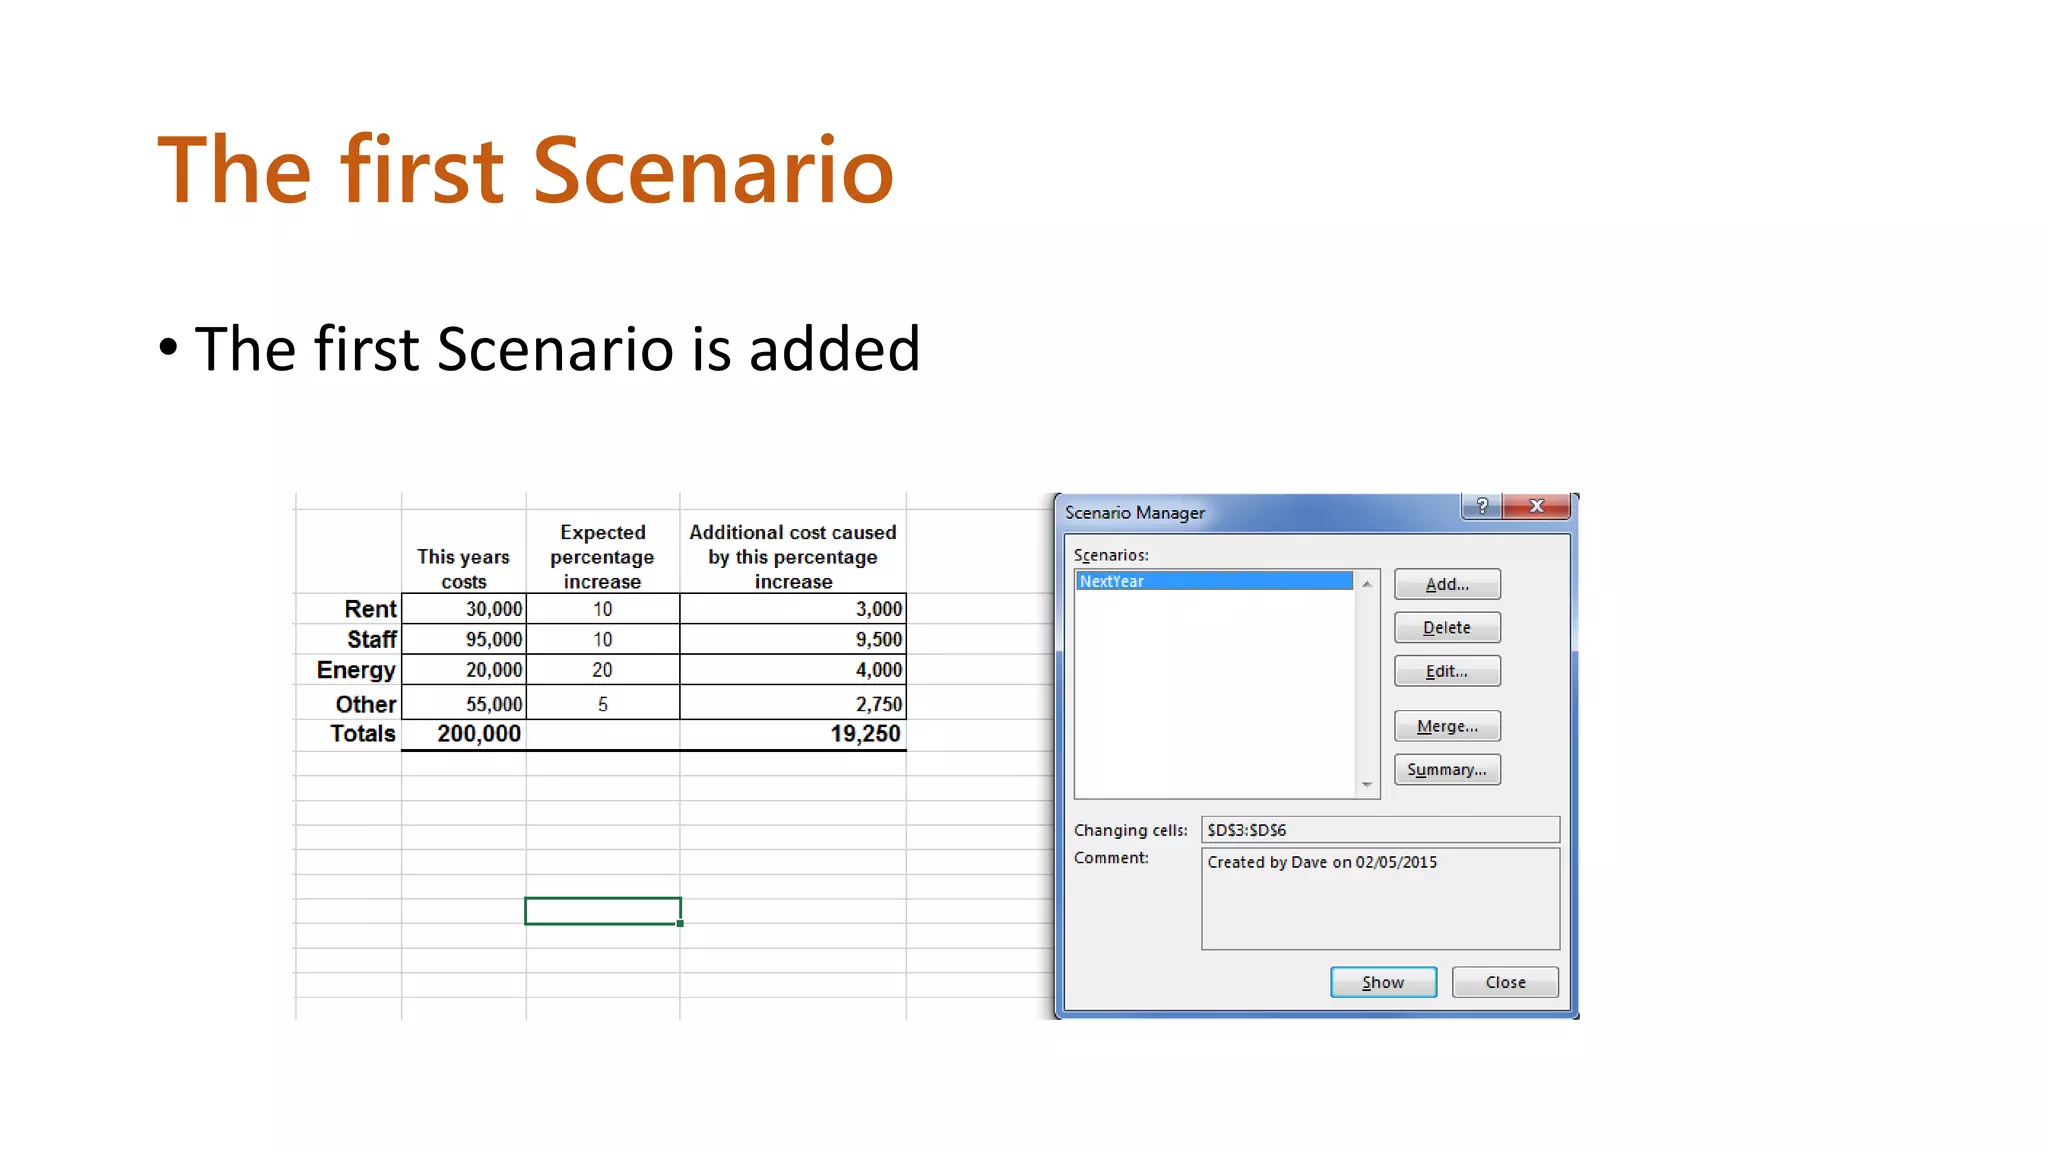
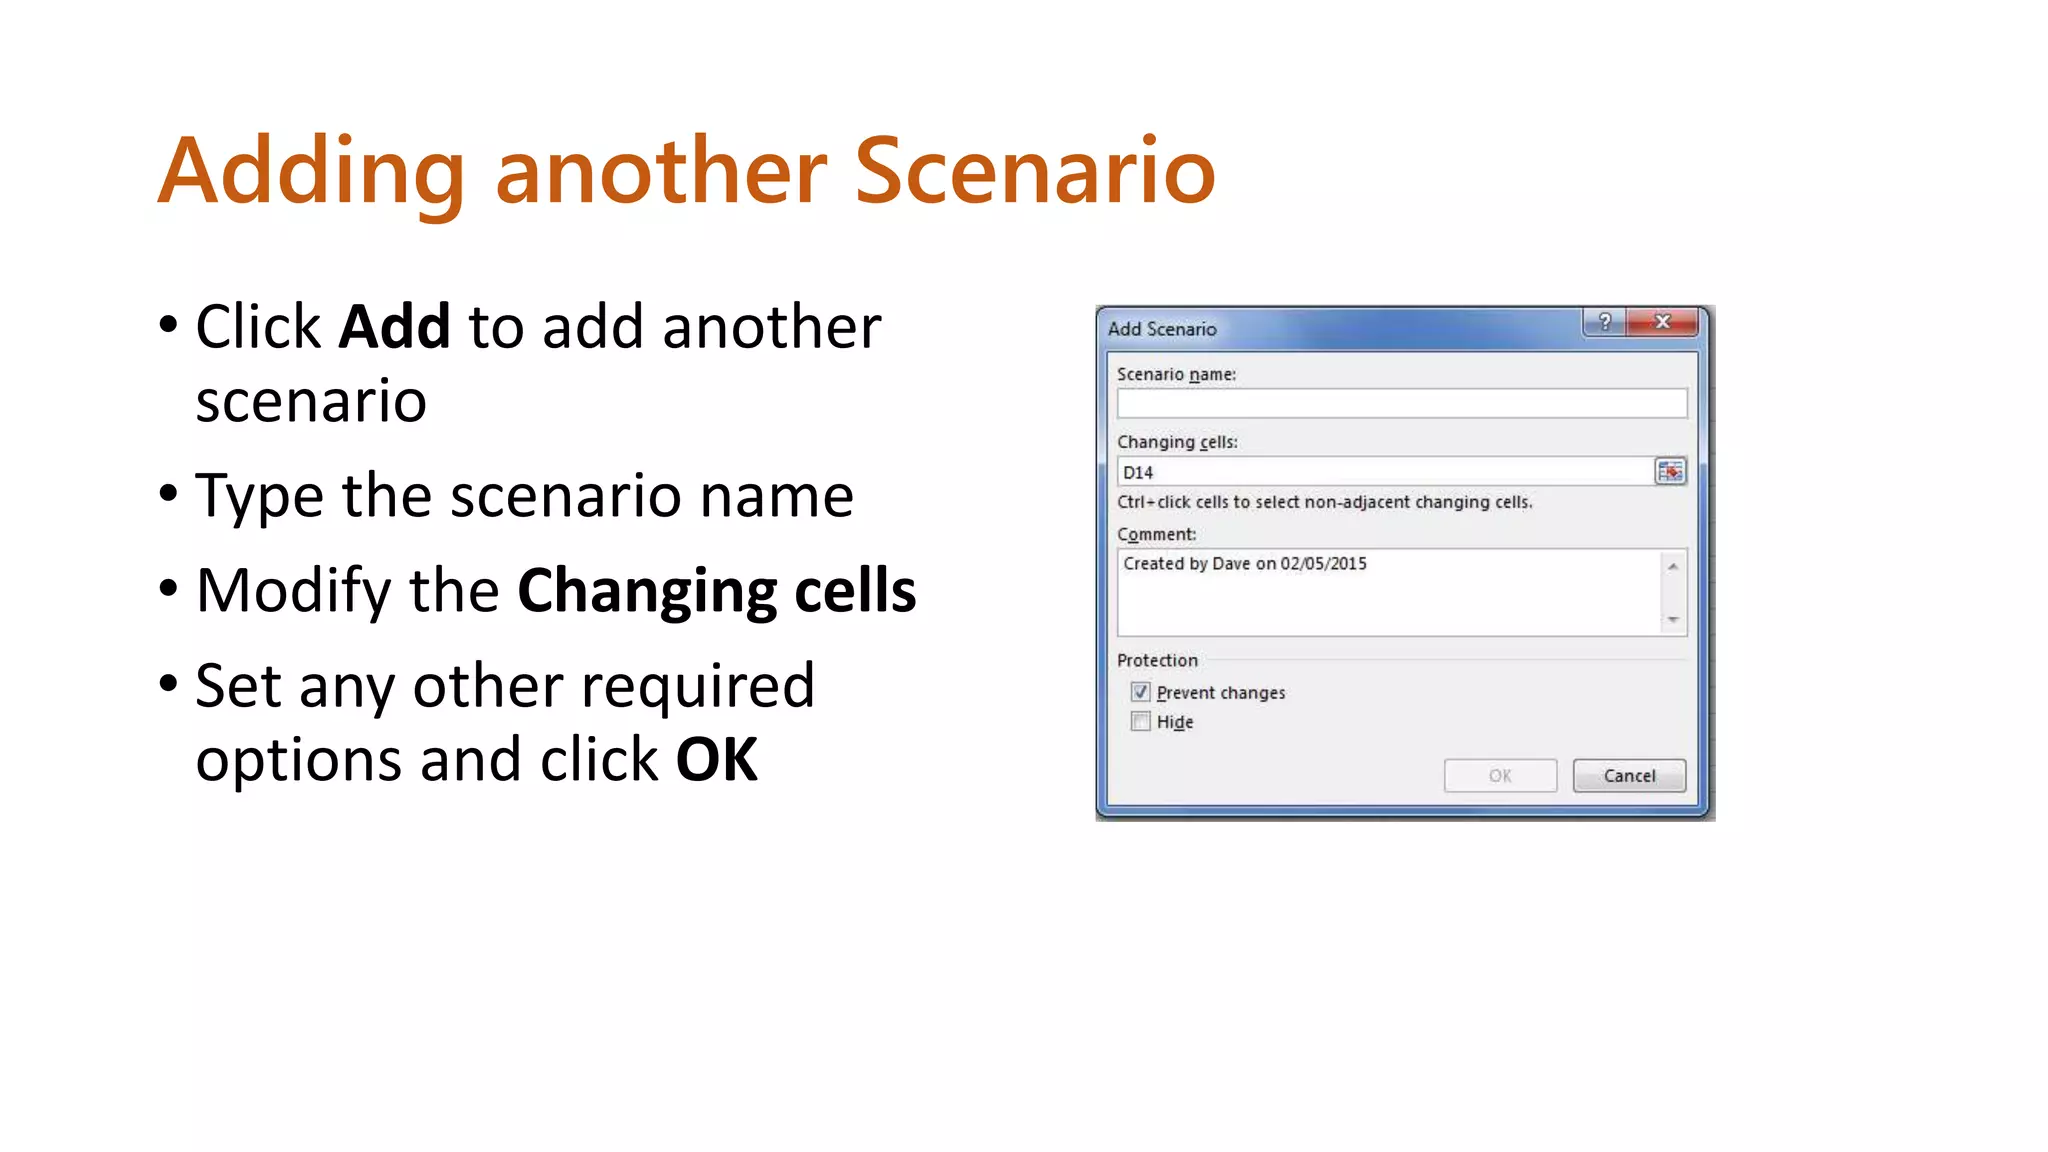
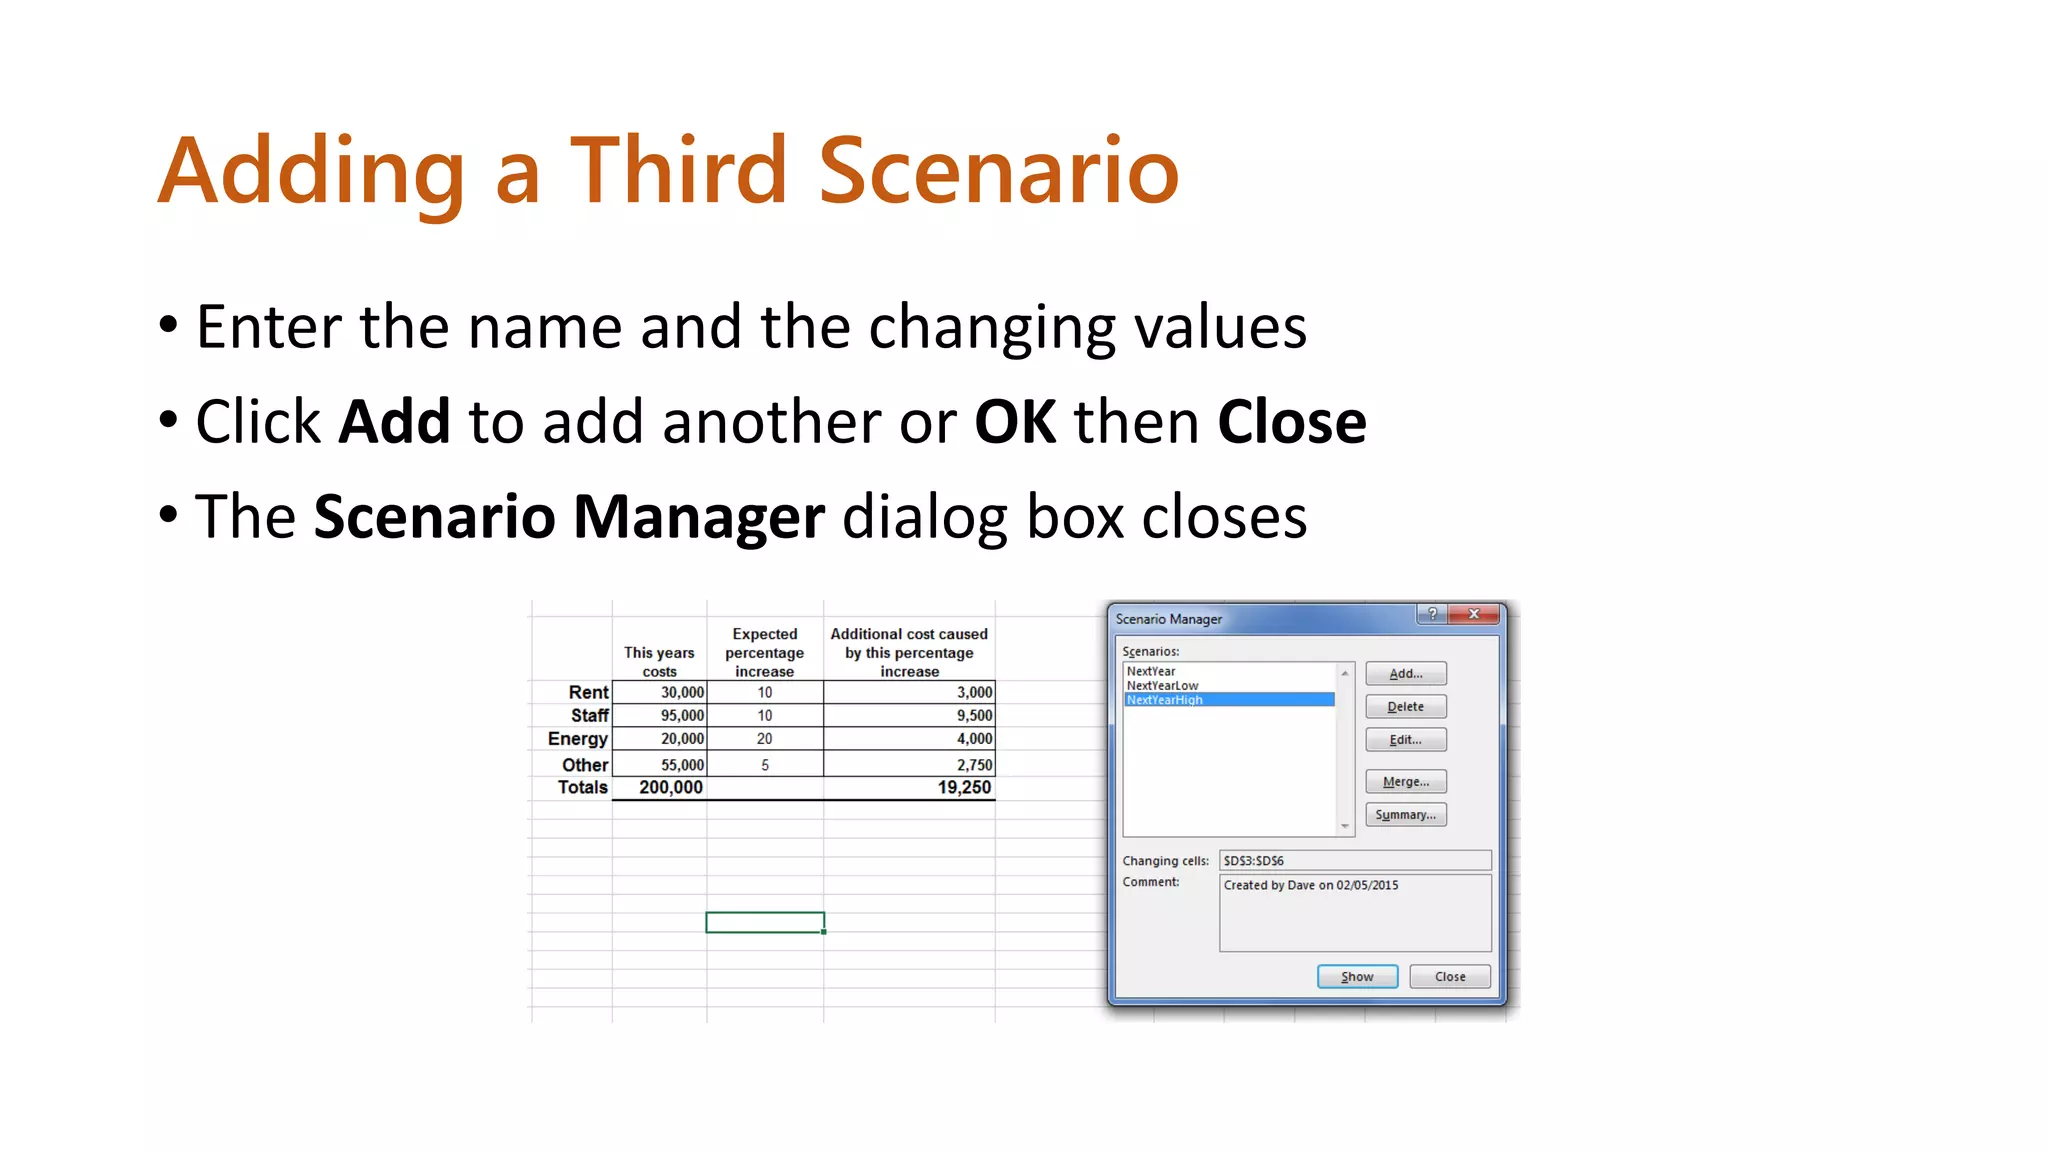
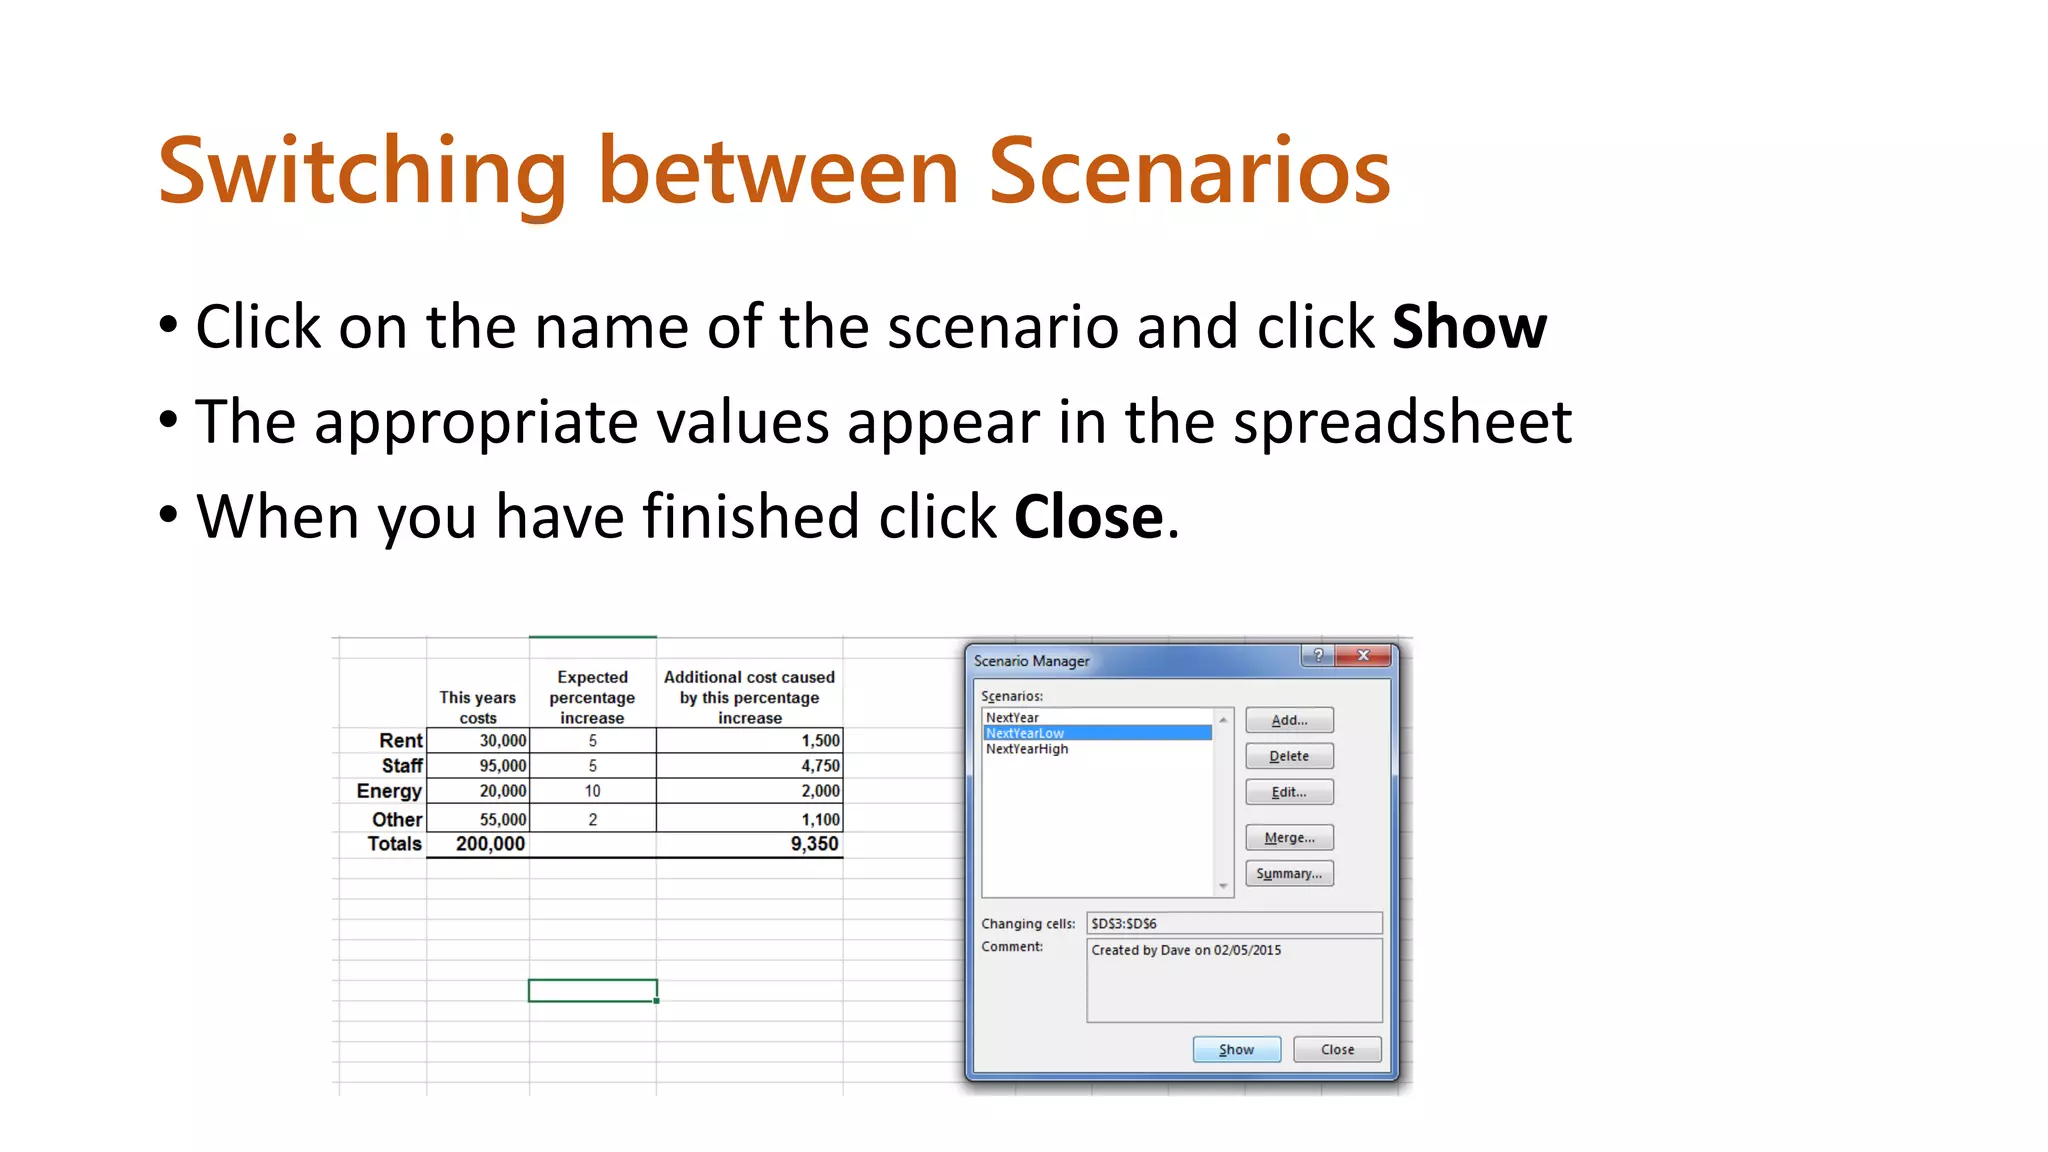
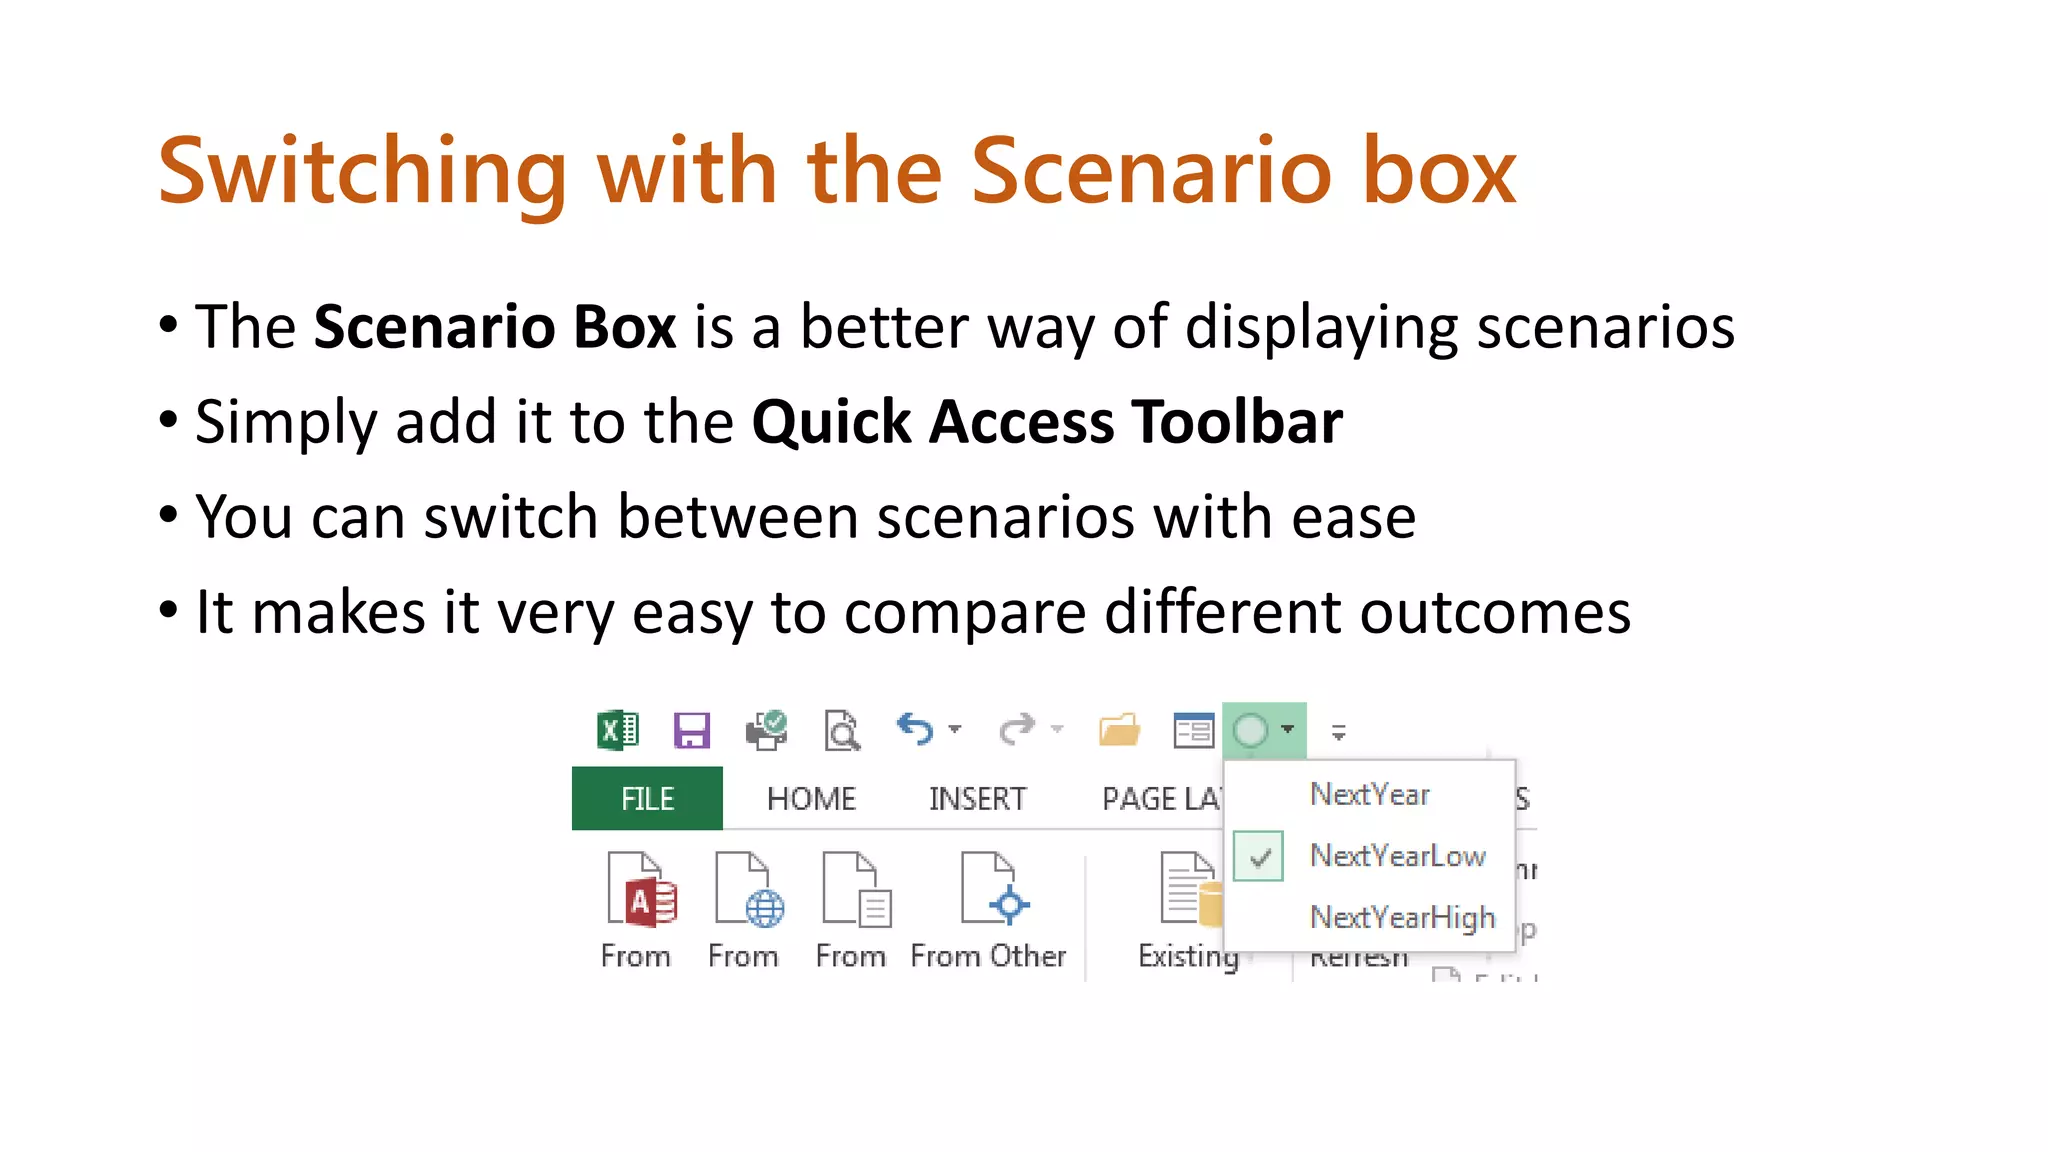
Step-by-step guide on adding and editing scenarios in Excel, including how to switch between them and manage data input.
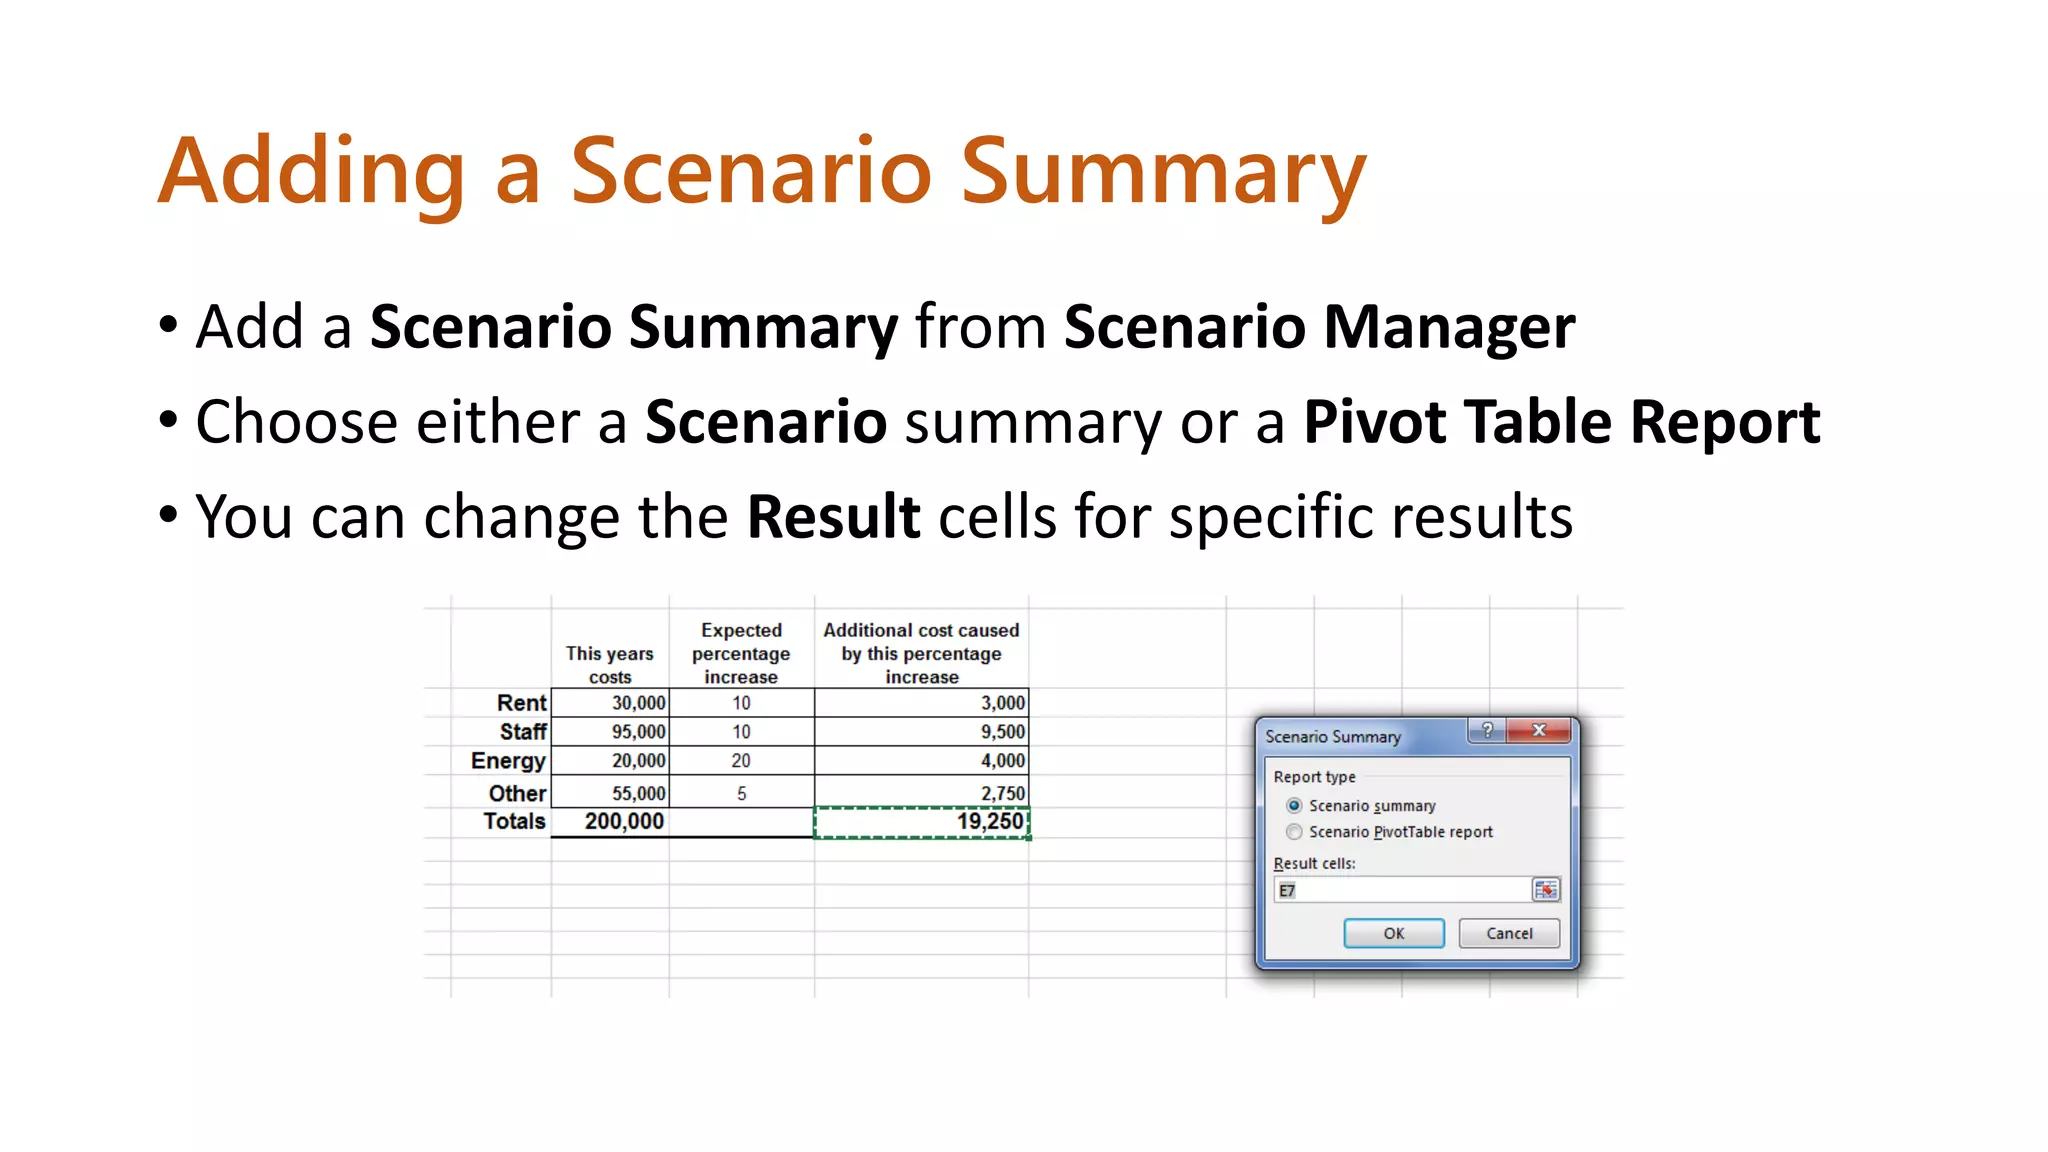
Instructions on creating Scenario Reports and Pivot Table Reports, offering tools for summarizing and analyzing scenario data.
A closing note encouraging further learning about Outlook through the provided website.


