This document provides information on sampling and sample size calculation. It defines key terms related to sampling such as population, sample, sampling unit, sampling frame, parameter, and statistic. It discusses the need for sampling and what constitutes a good sample. Various sampling designs and methods for calculating sample sizes for means, proportions, rates, and comparing two proportions/means are presented along with examples. Formulas used to calculate sample sizes are provided.
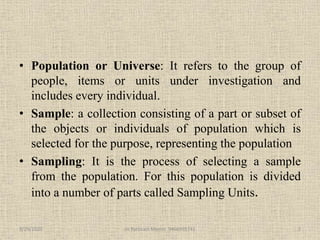


![COMPARISON OF TWO
PROPORTION
• 2x(u+v) ² ]px(1-p)]/(p1-p2)
• p= p2+p1/2
• p1,p2 - Proportions
• u -one –sided percentage point of normal
distribution corresponding to 100%-power.
• v- two-sided percentage point of normal
distribution corresponding to required
significance level
9/29/2020 29Dr Rattiram Meena 9460995741](https://image.slidesharecdn.com/samplingtechniques-200929035054/85/Sampling-techniques-29-320.jpg)


![• 2x(u+v) ² ]px(1-p)]/(p1-p2)
• N = 2x (1.64+2.58)²x(0.265)(1-0.265)/(0.28-
0.25)
• =7707 Therefore 7707 subjects are needed to
be studied in each group.
9/29/2020 32Dr Rattiram Meena 9460995741](https://image.slidesharecdn.com/samplingtechniques-200929035054/85/Sampling-techniques-32-320.jpg)