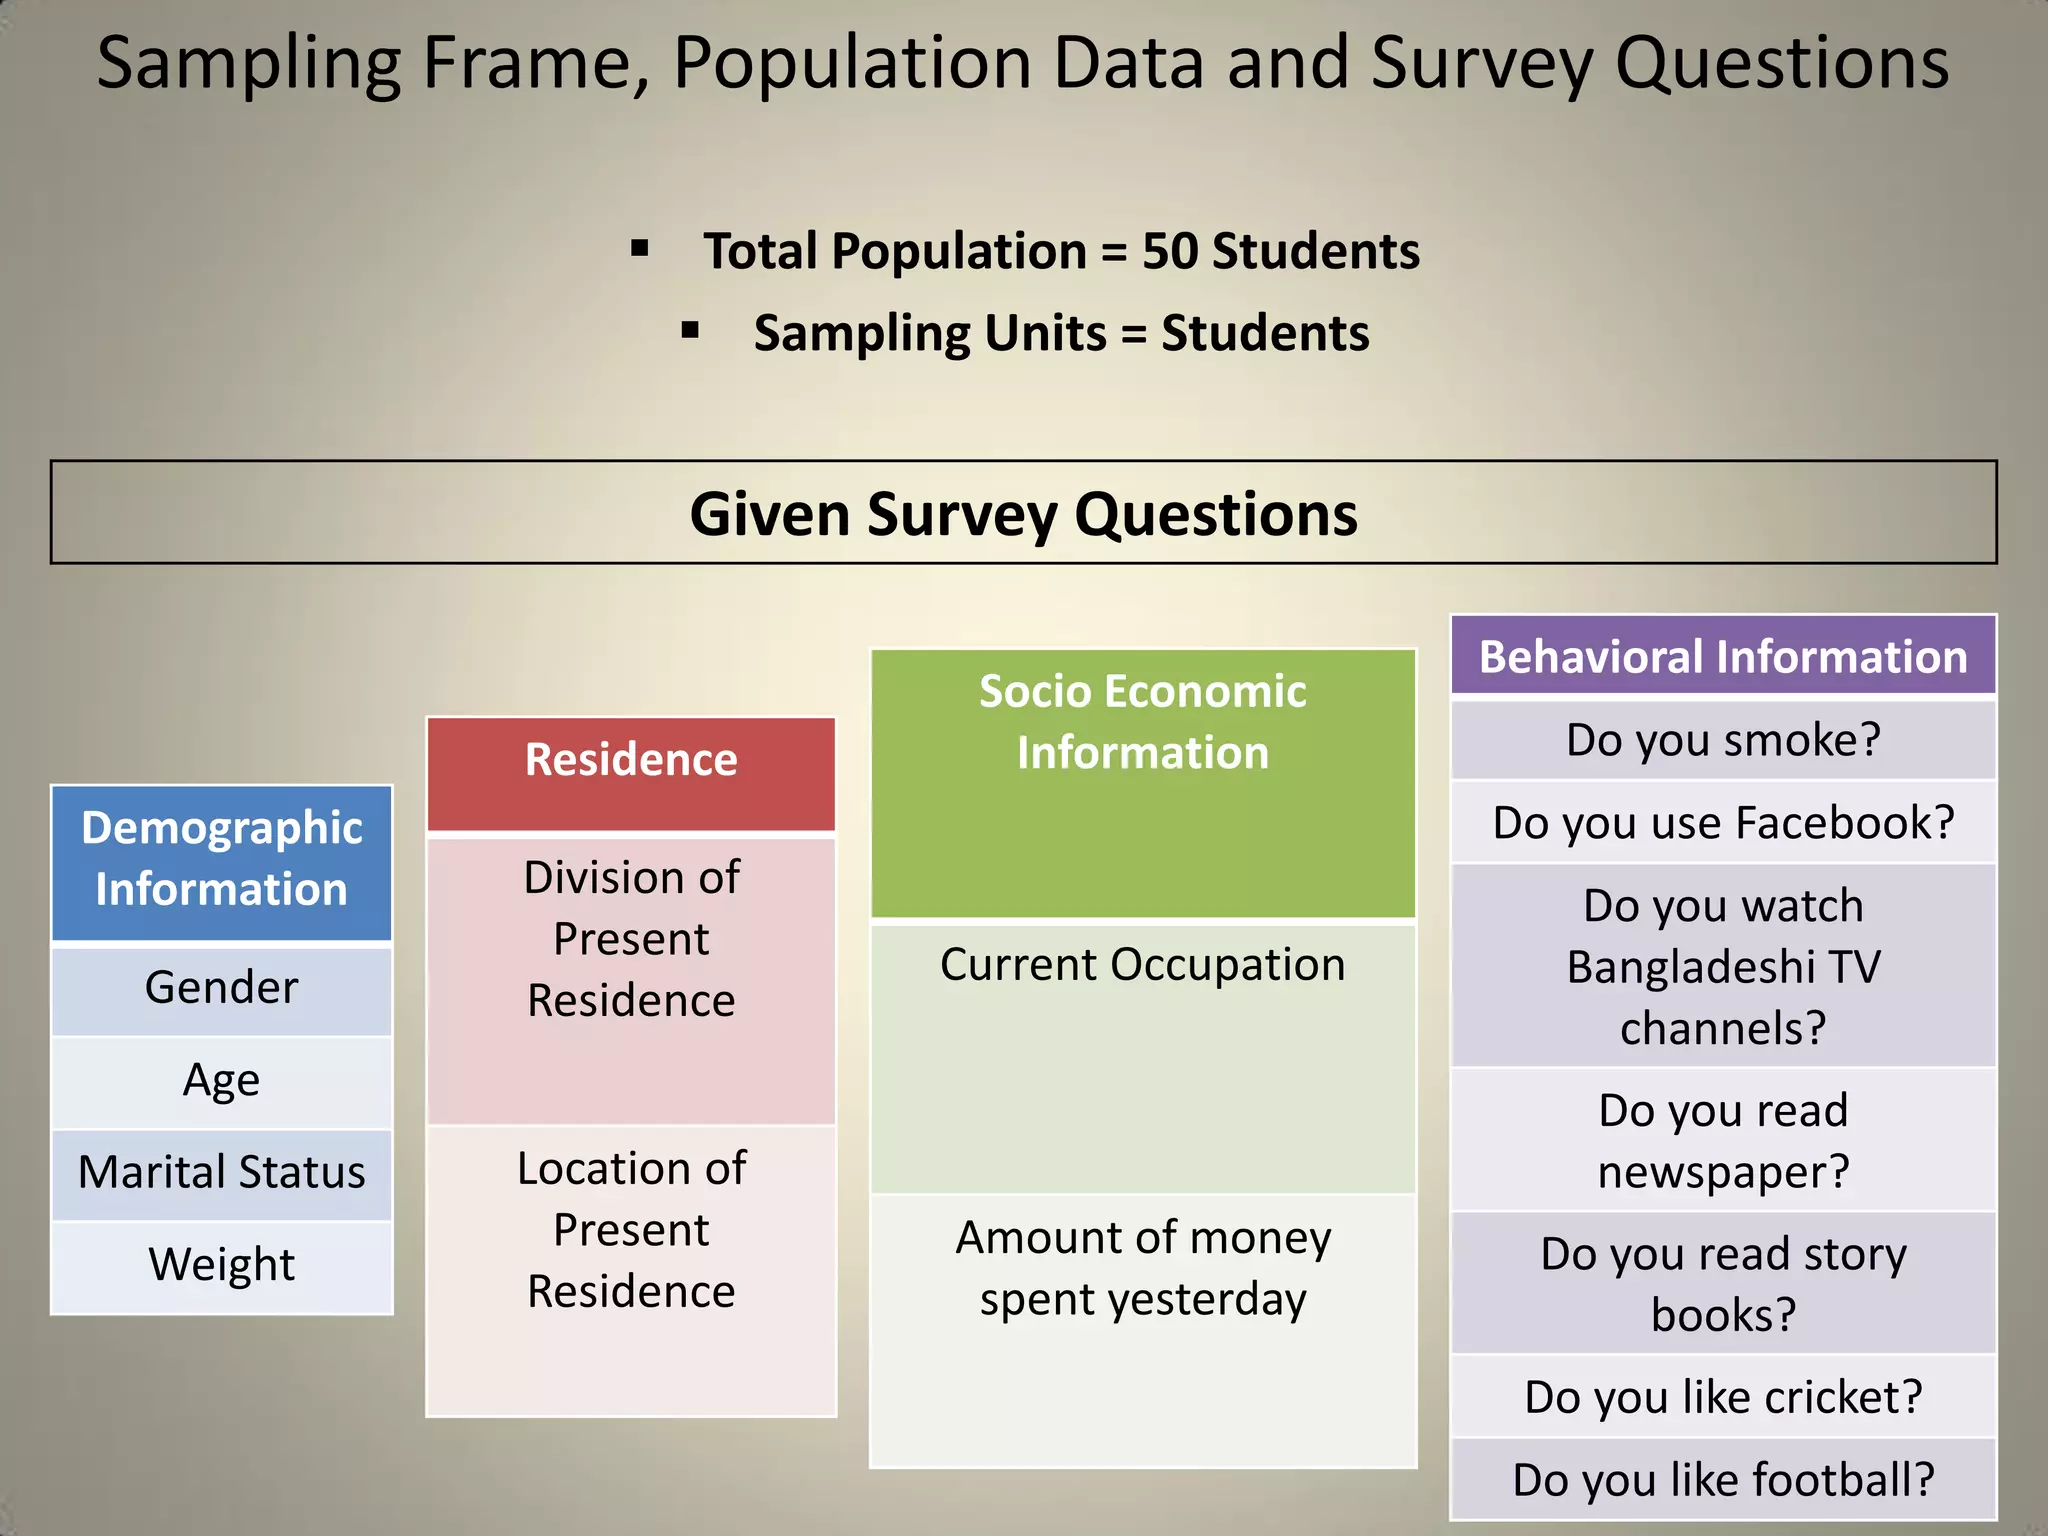
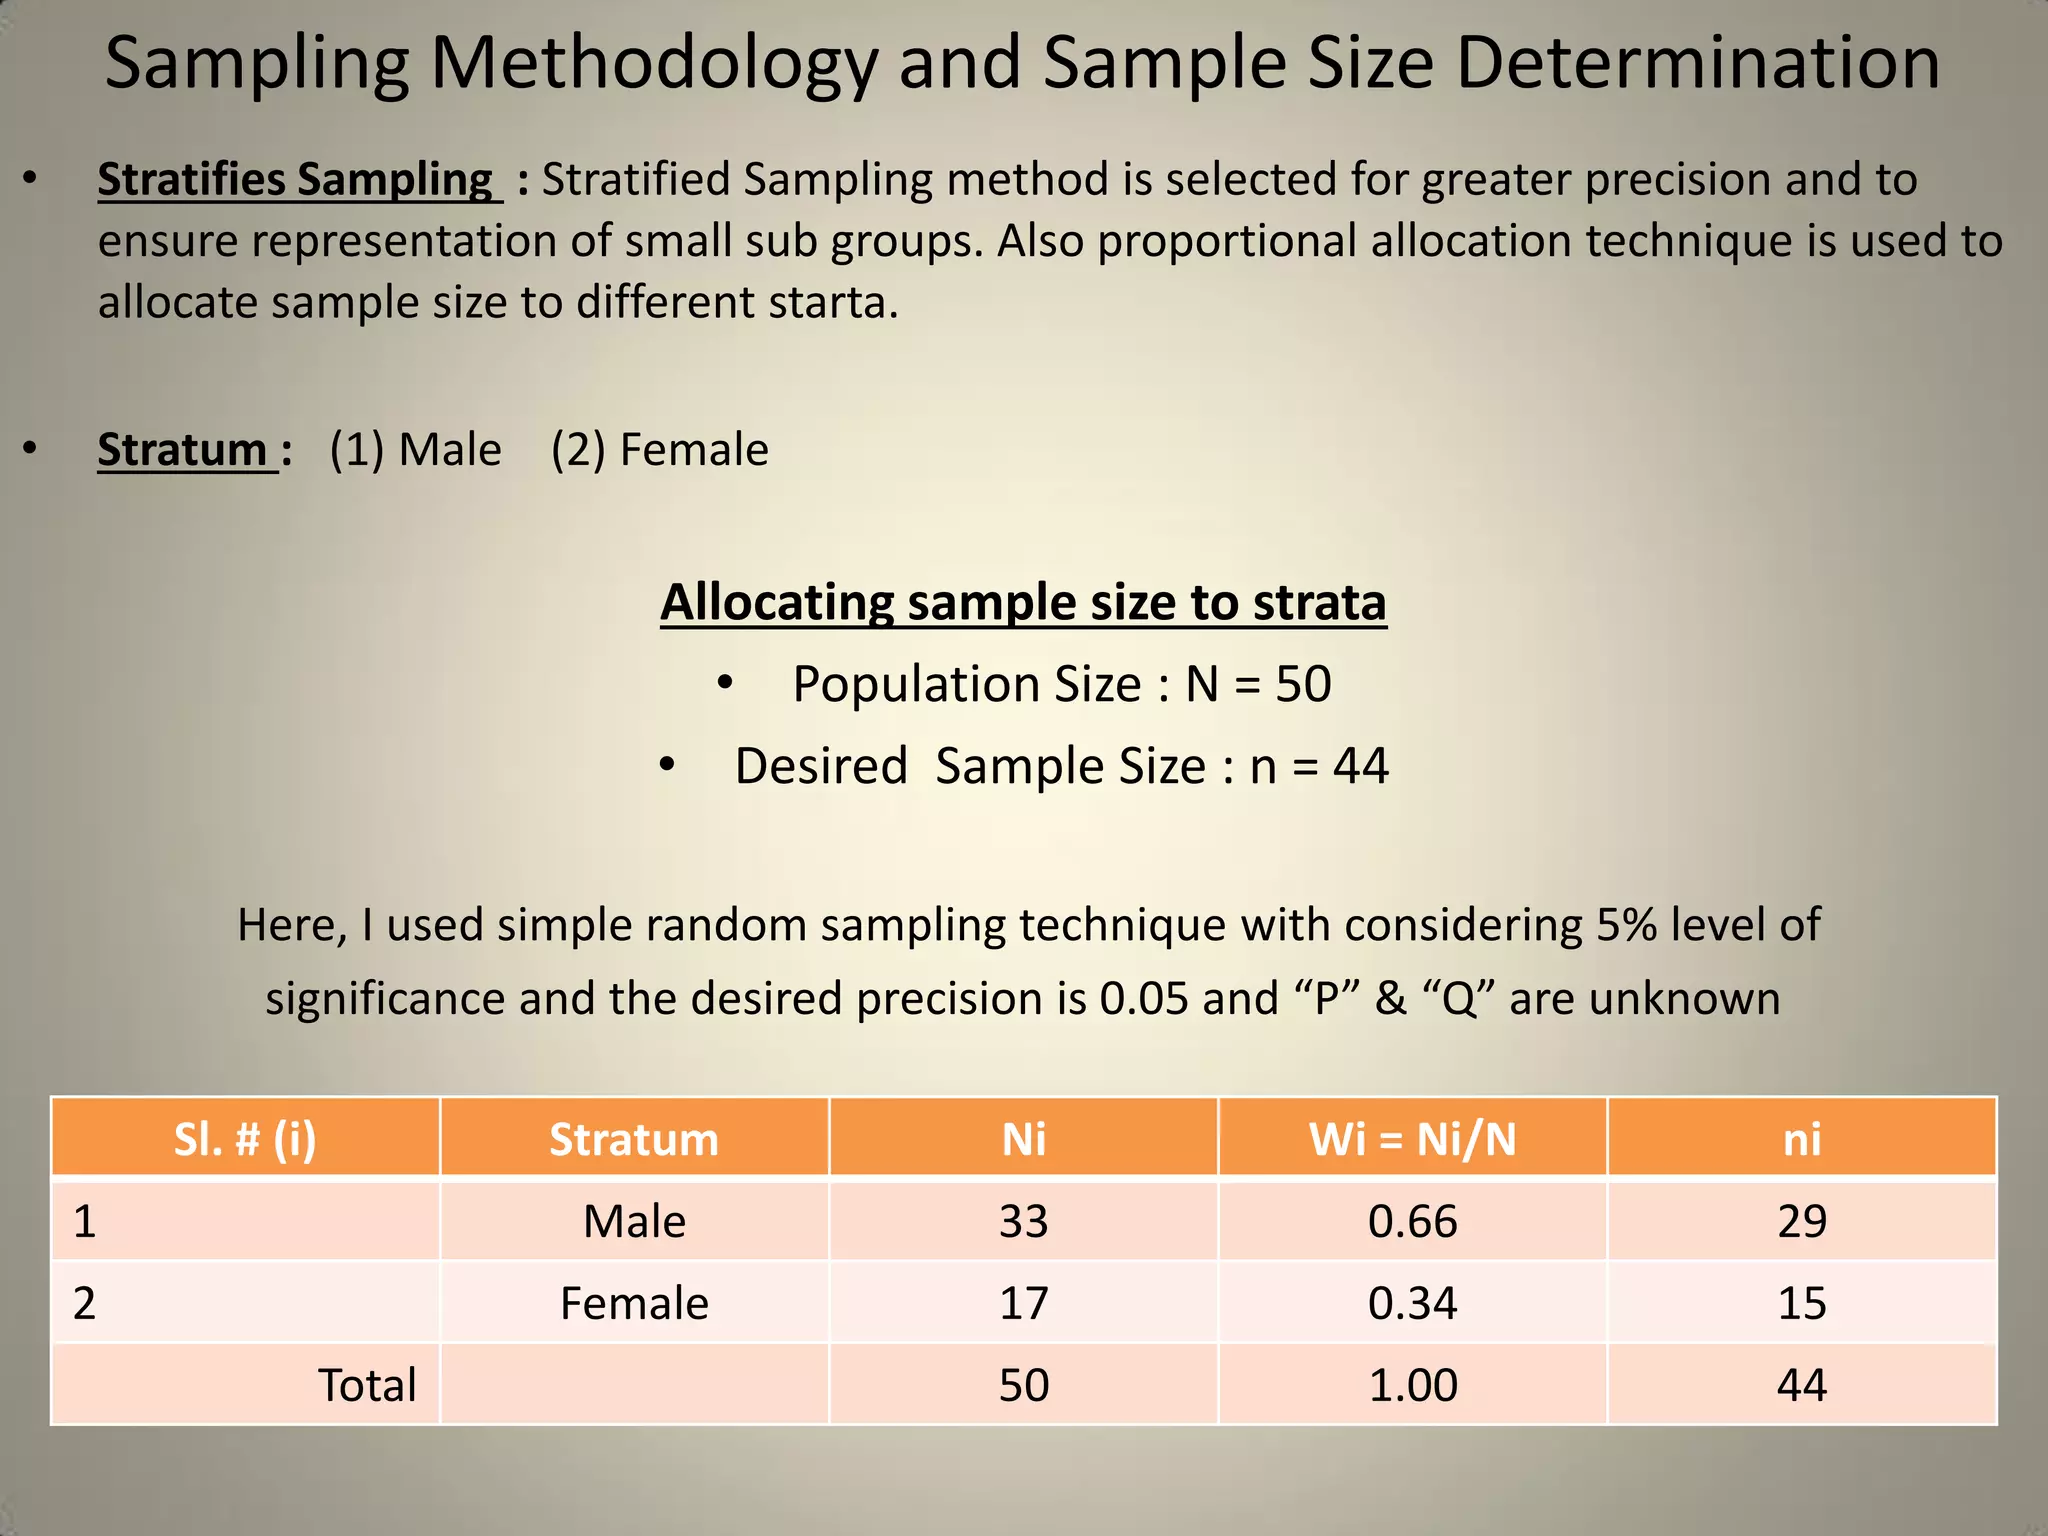
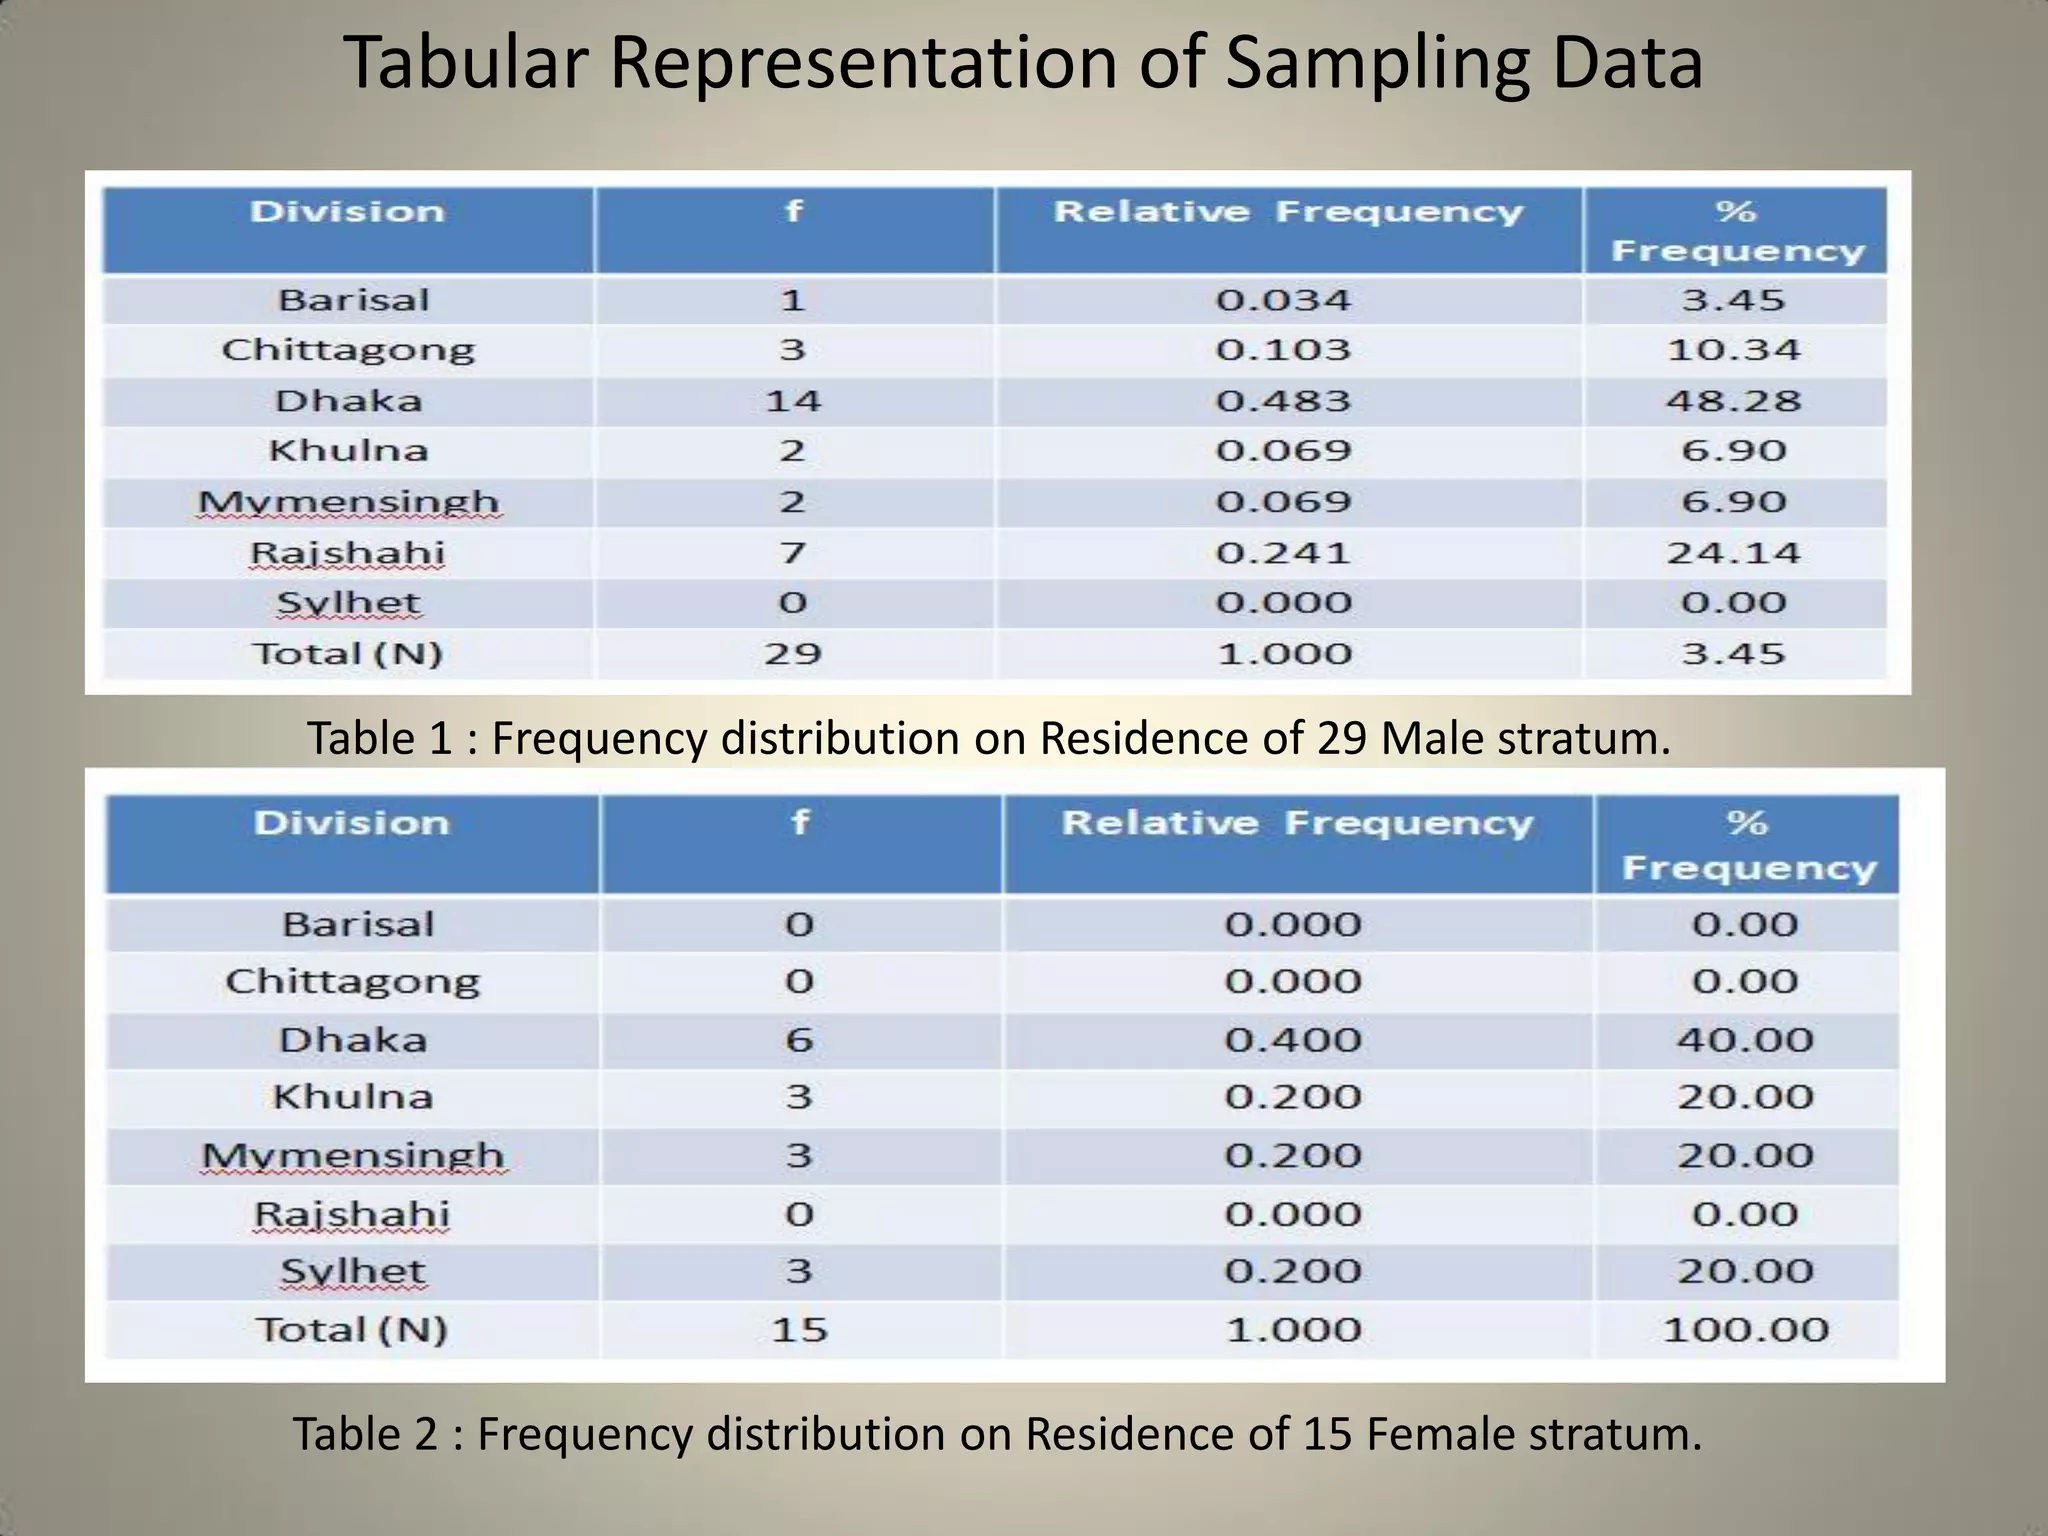
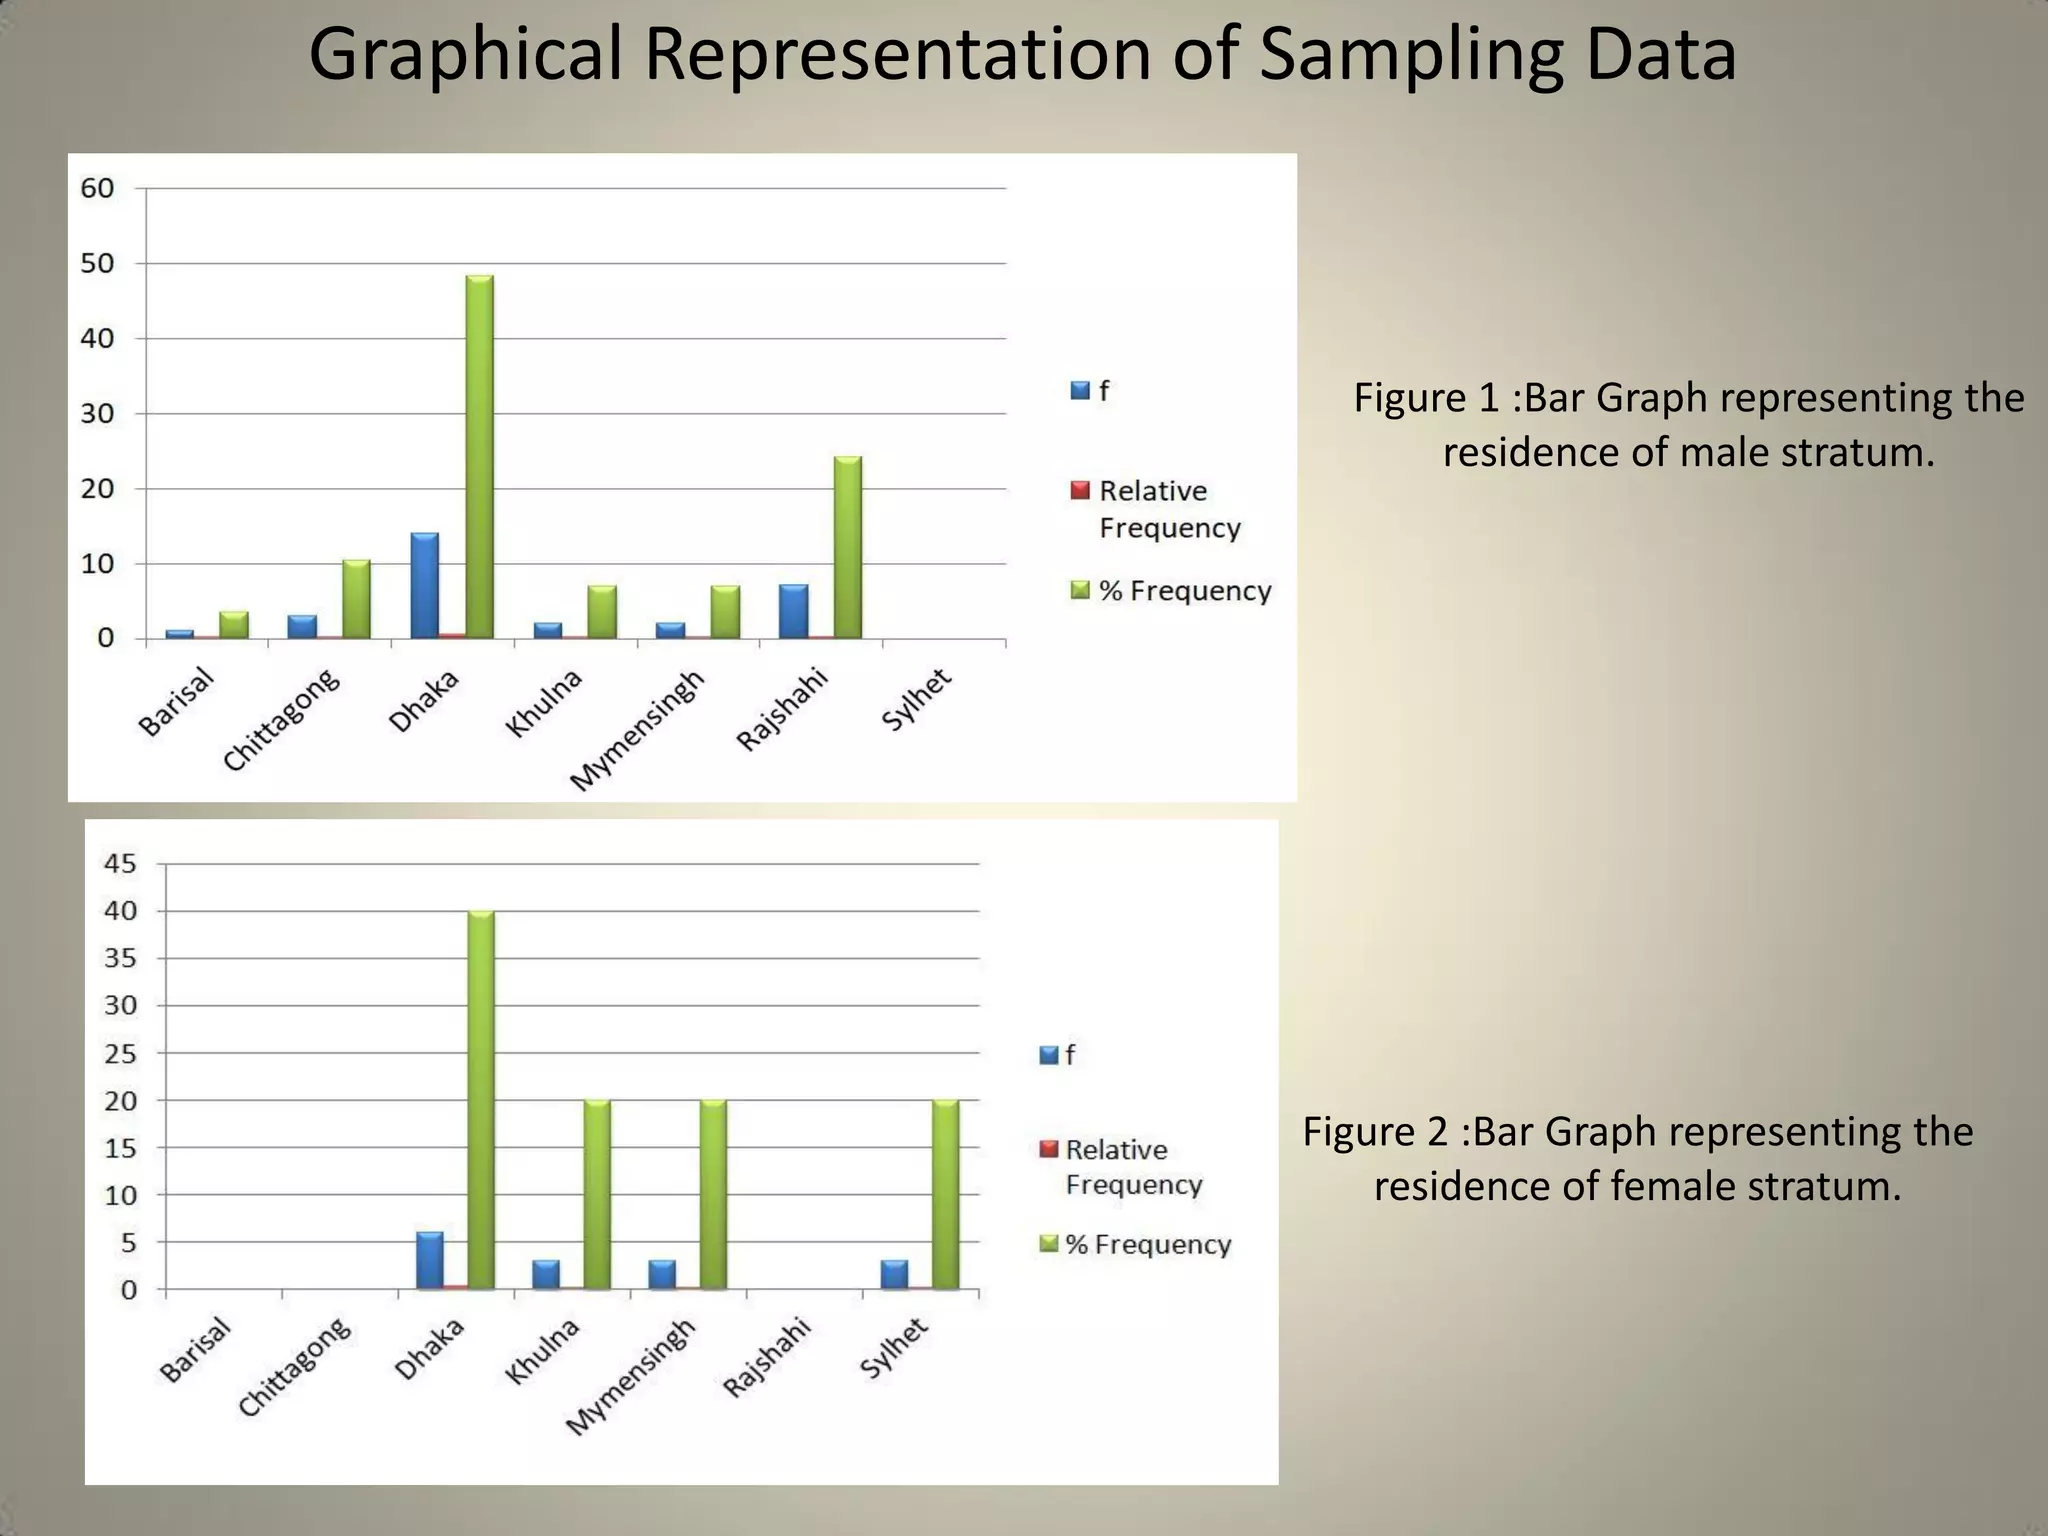
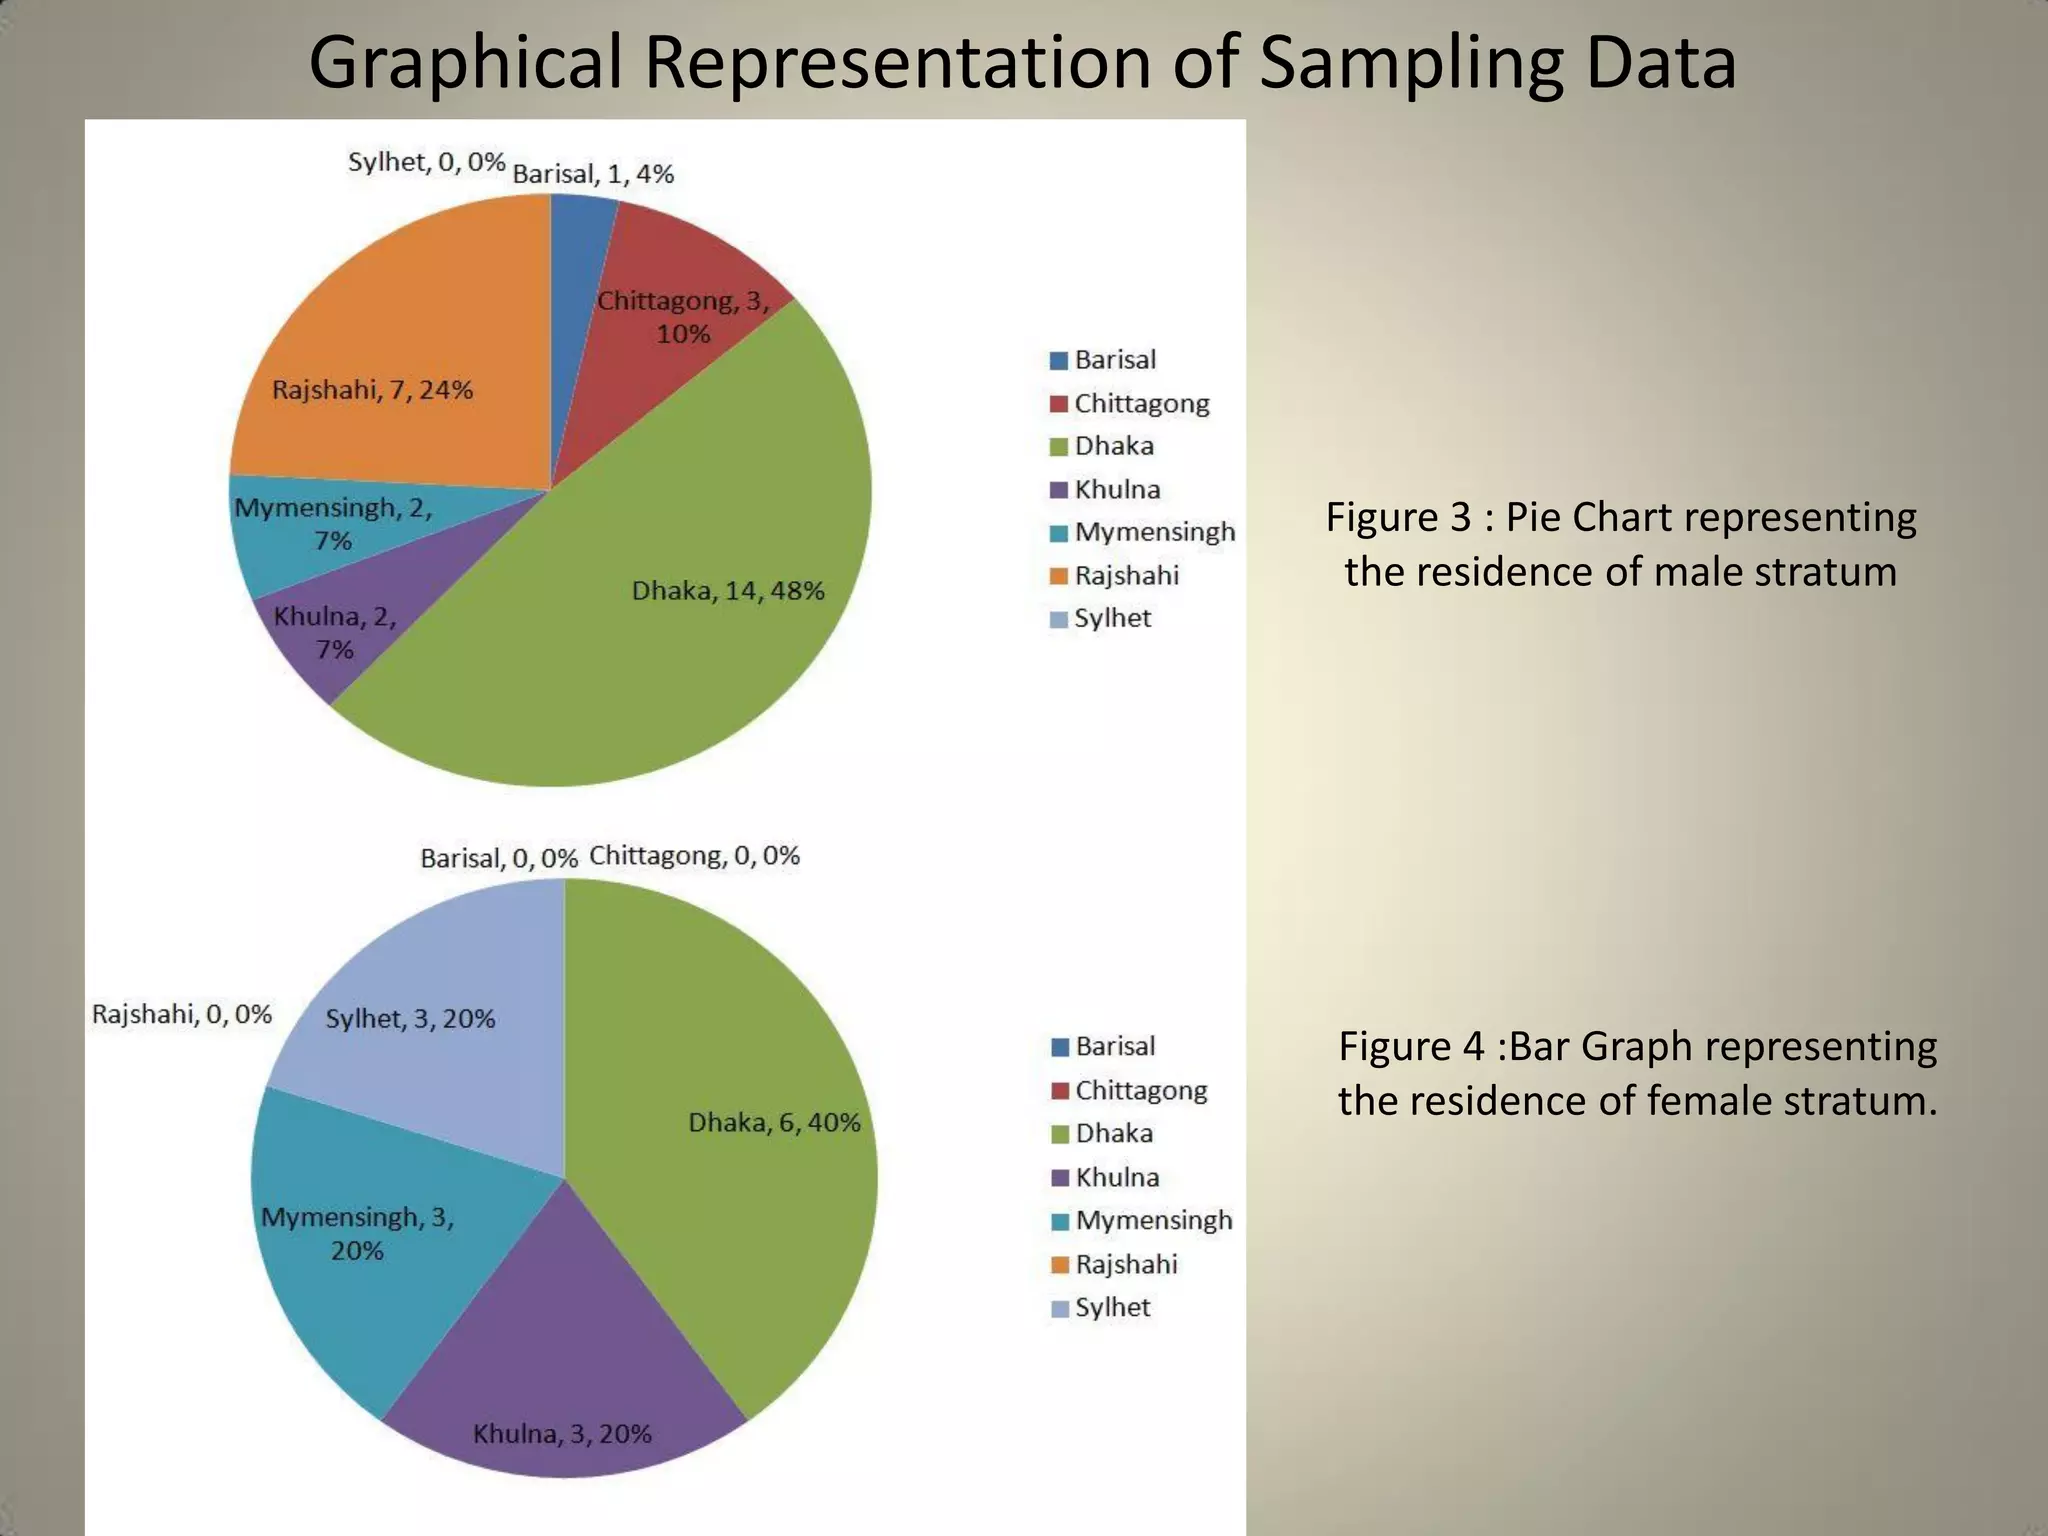
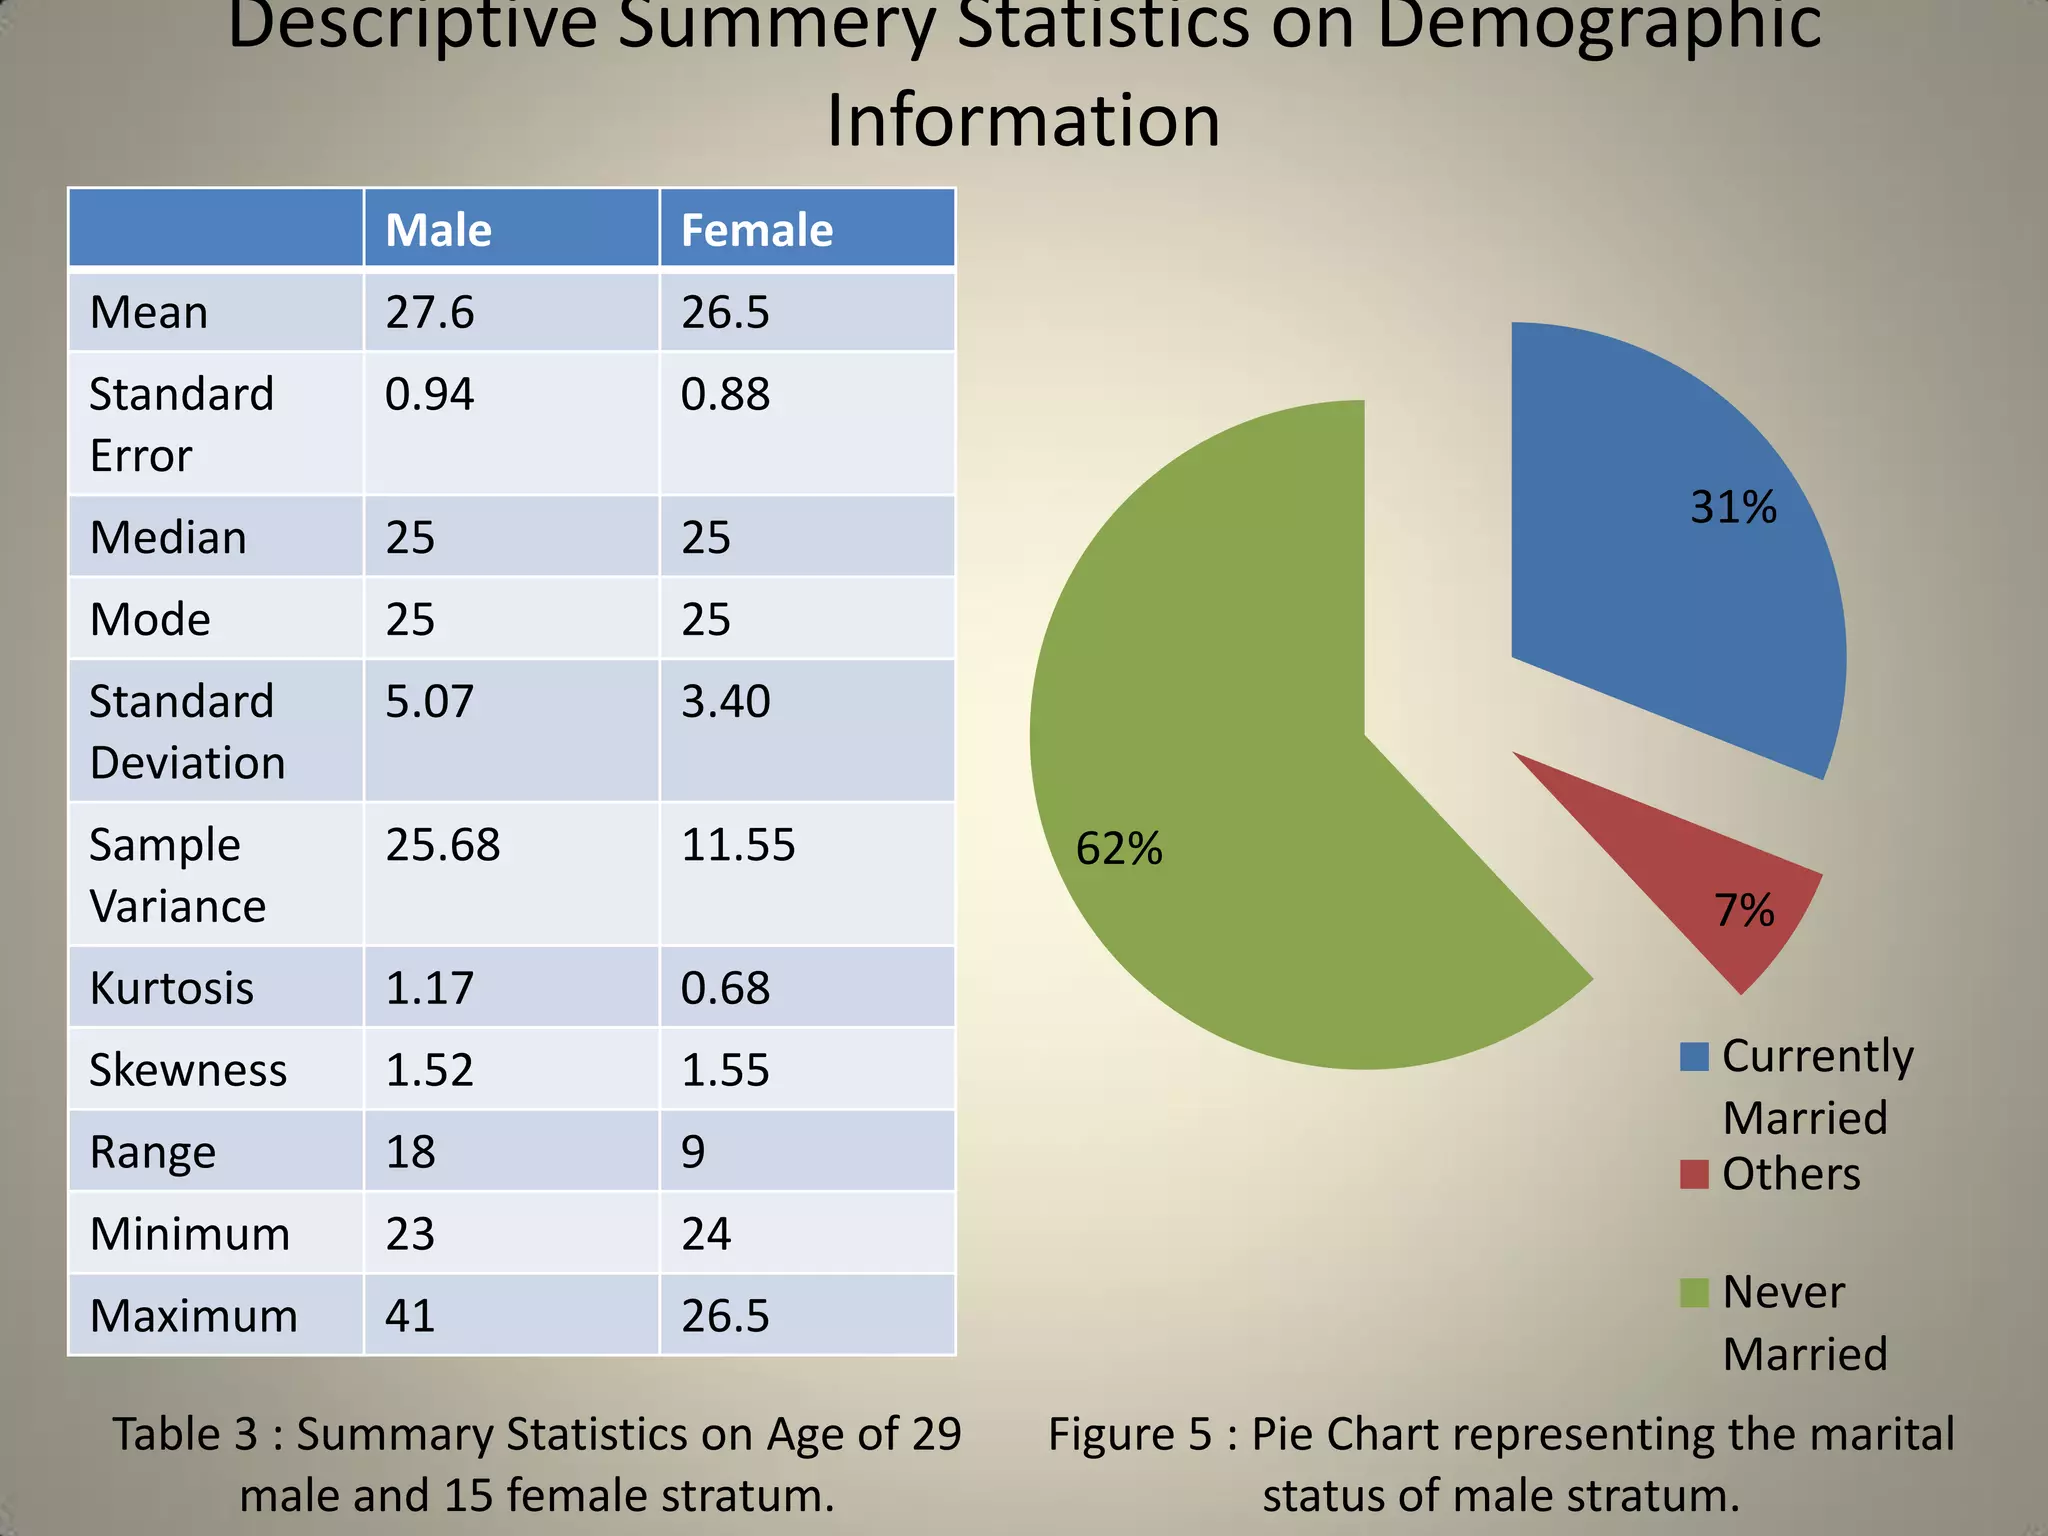
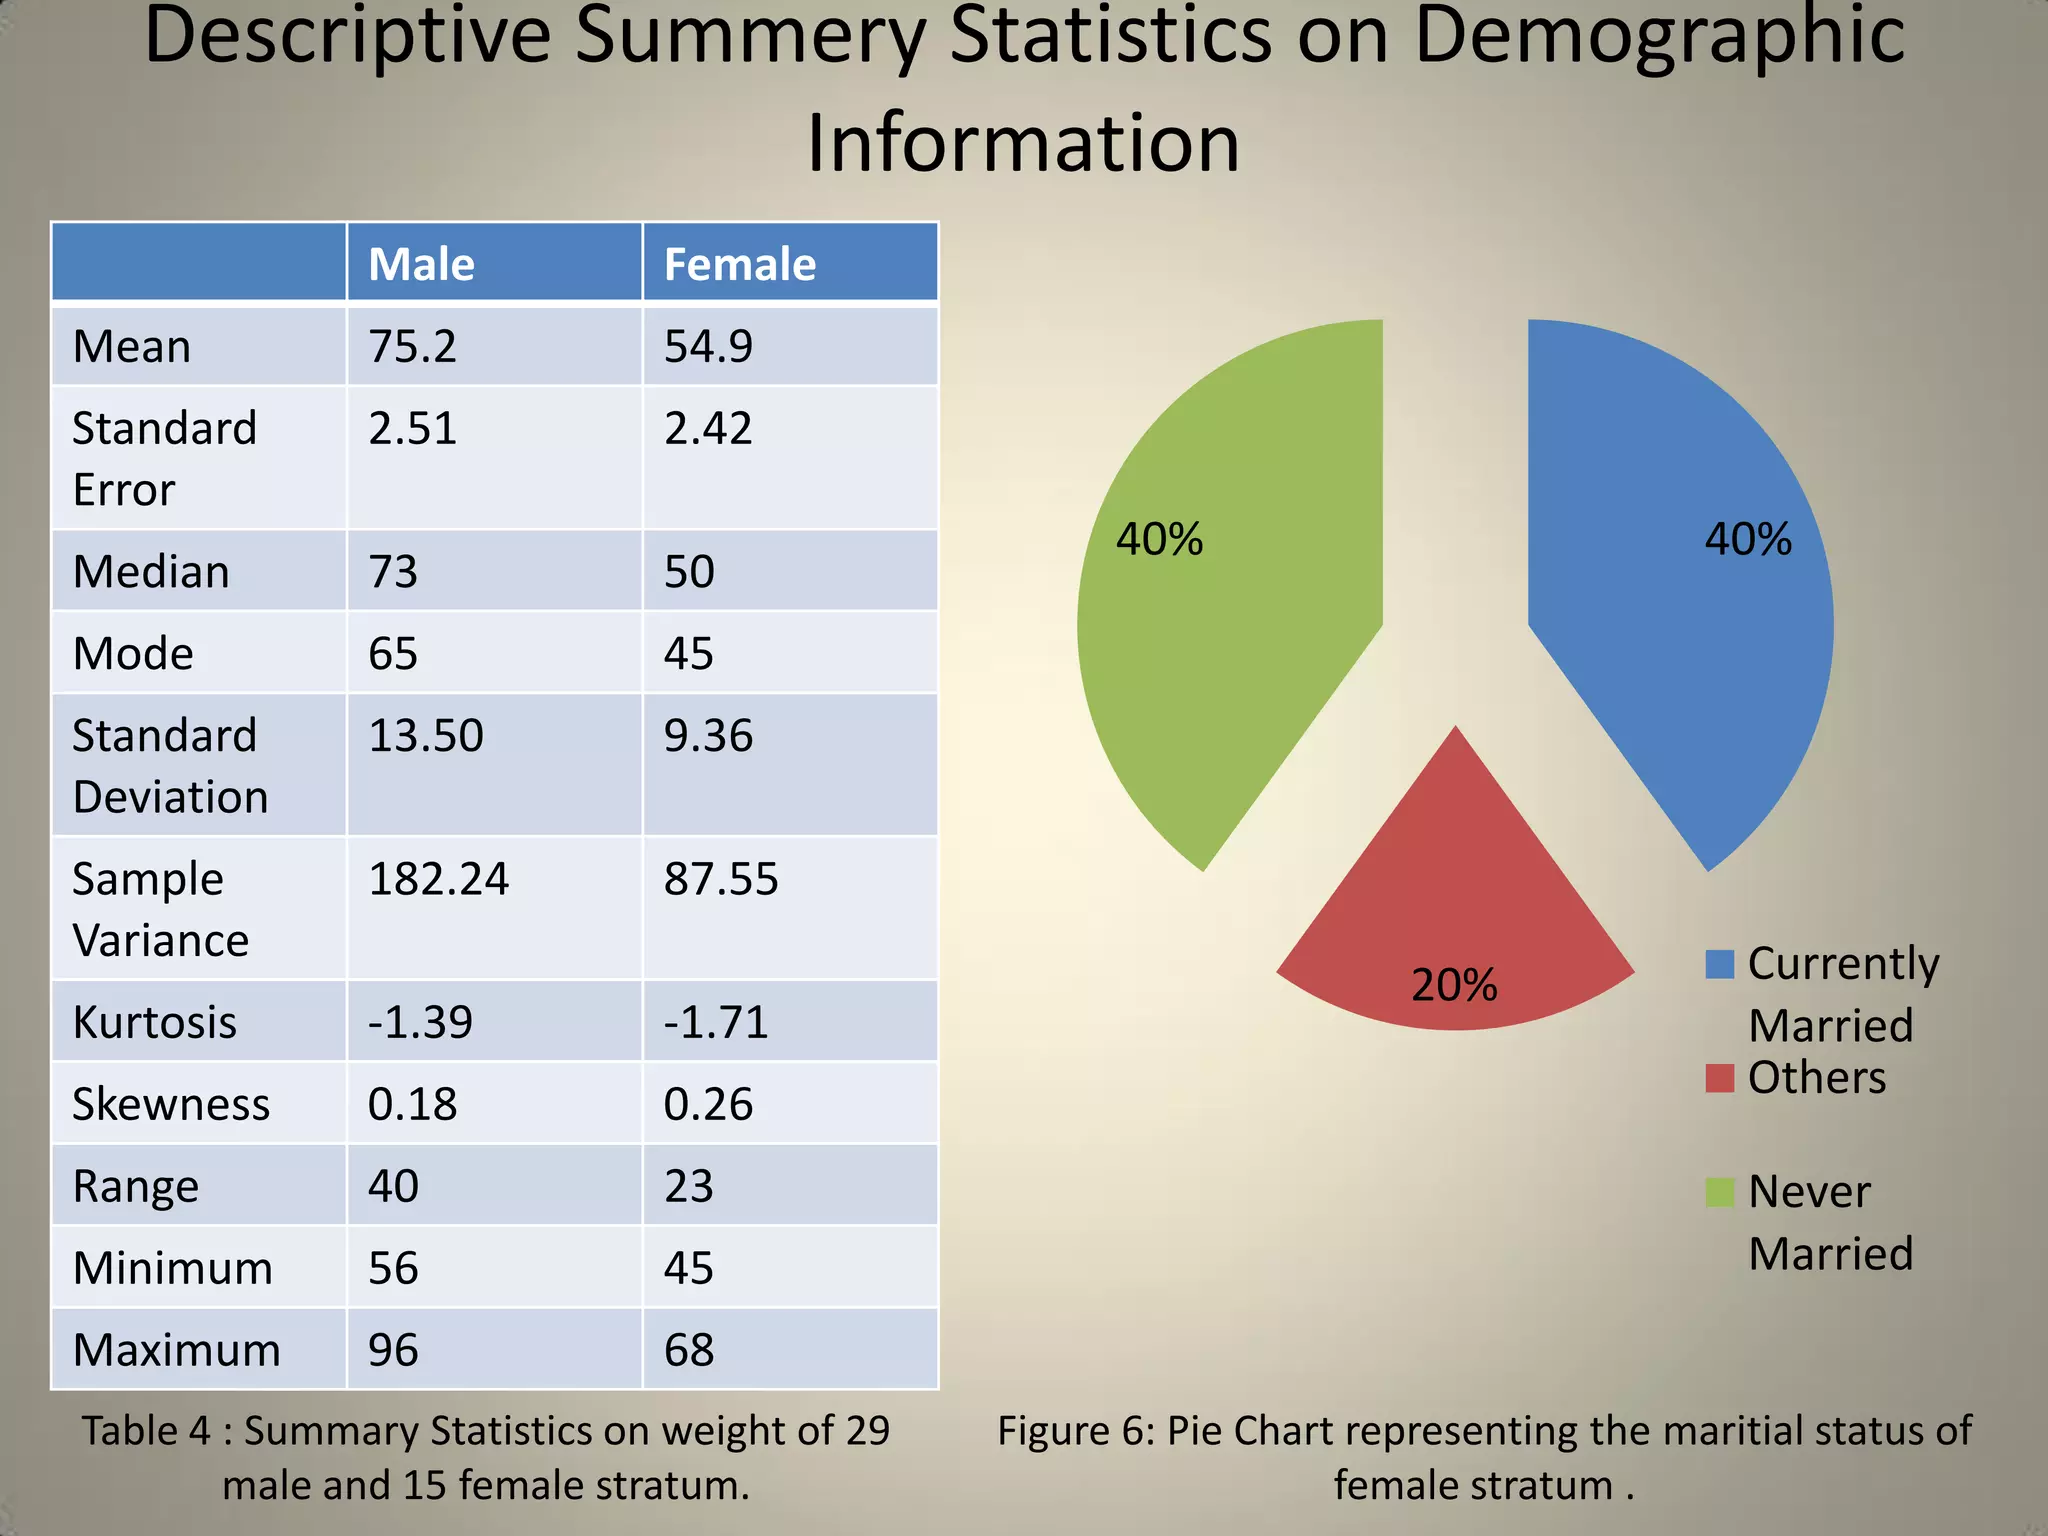
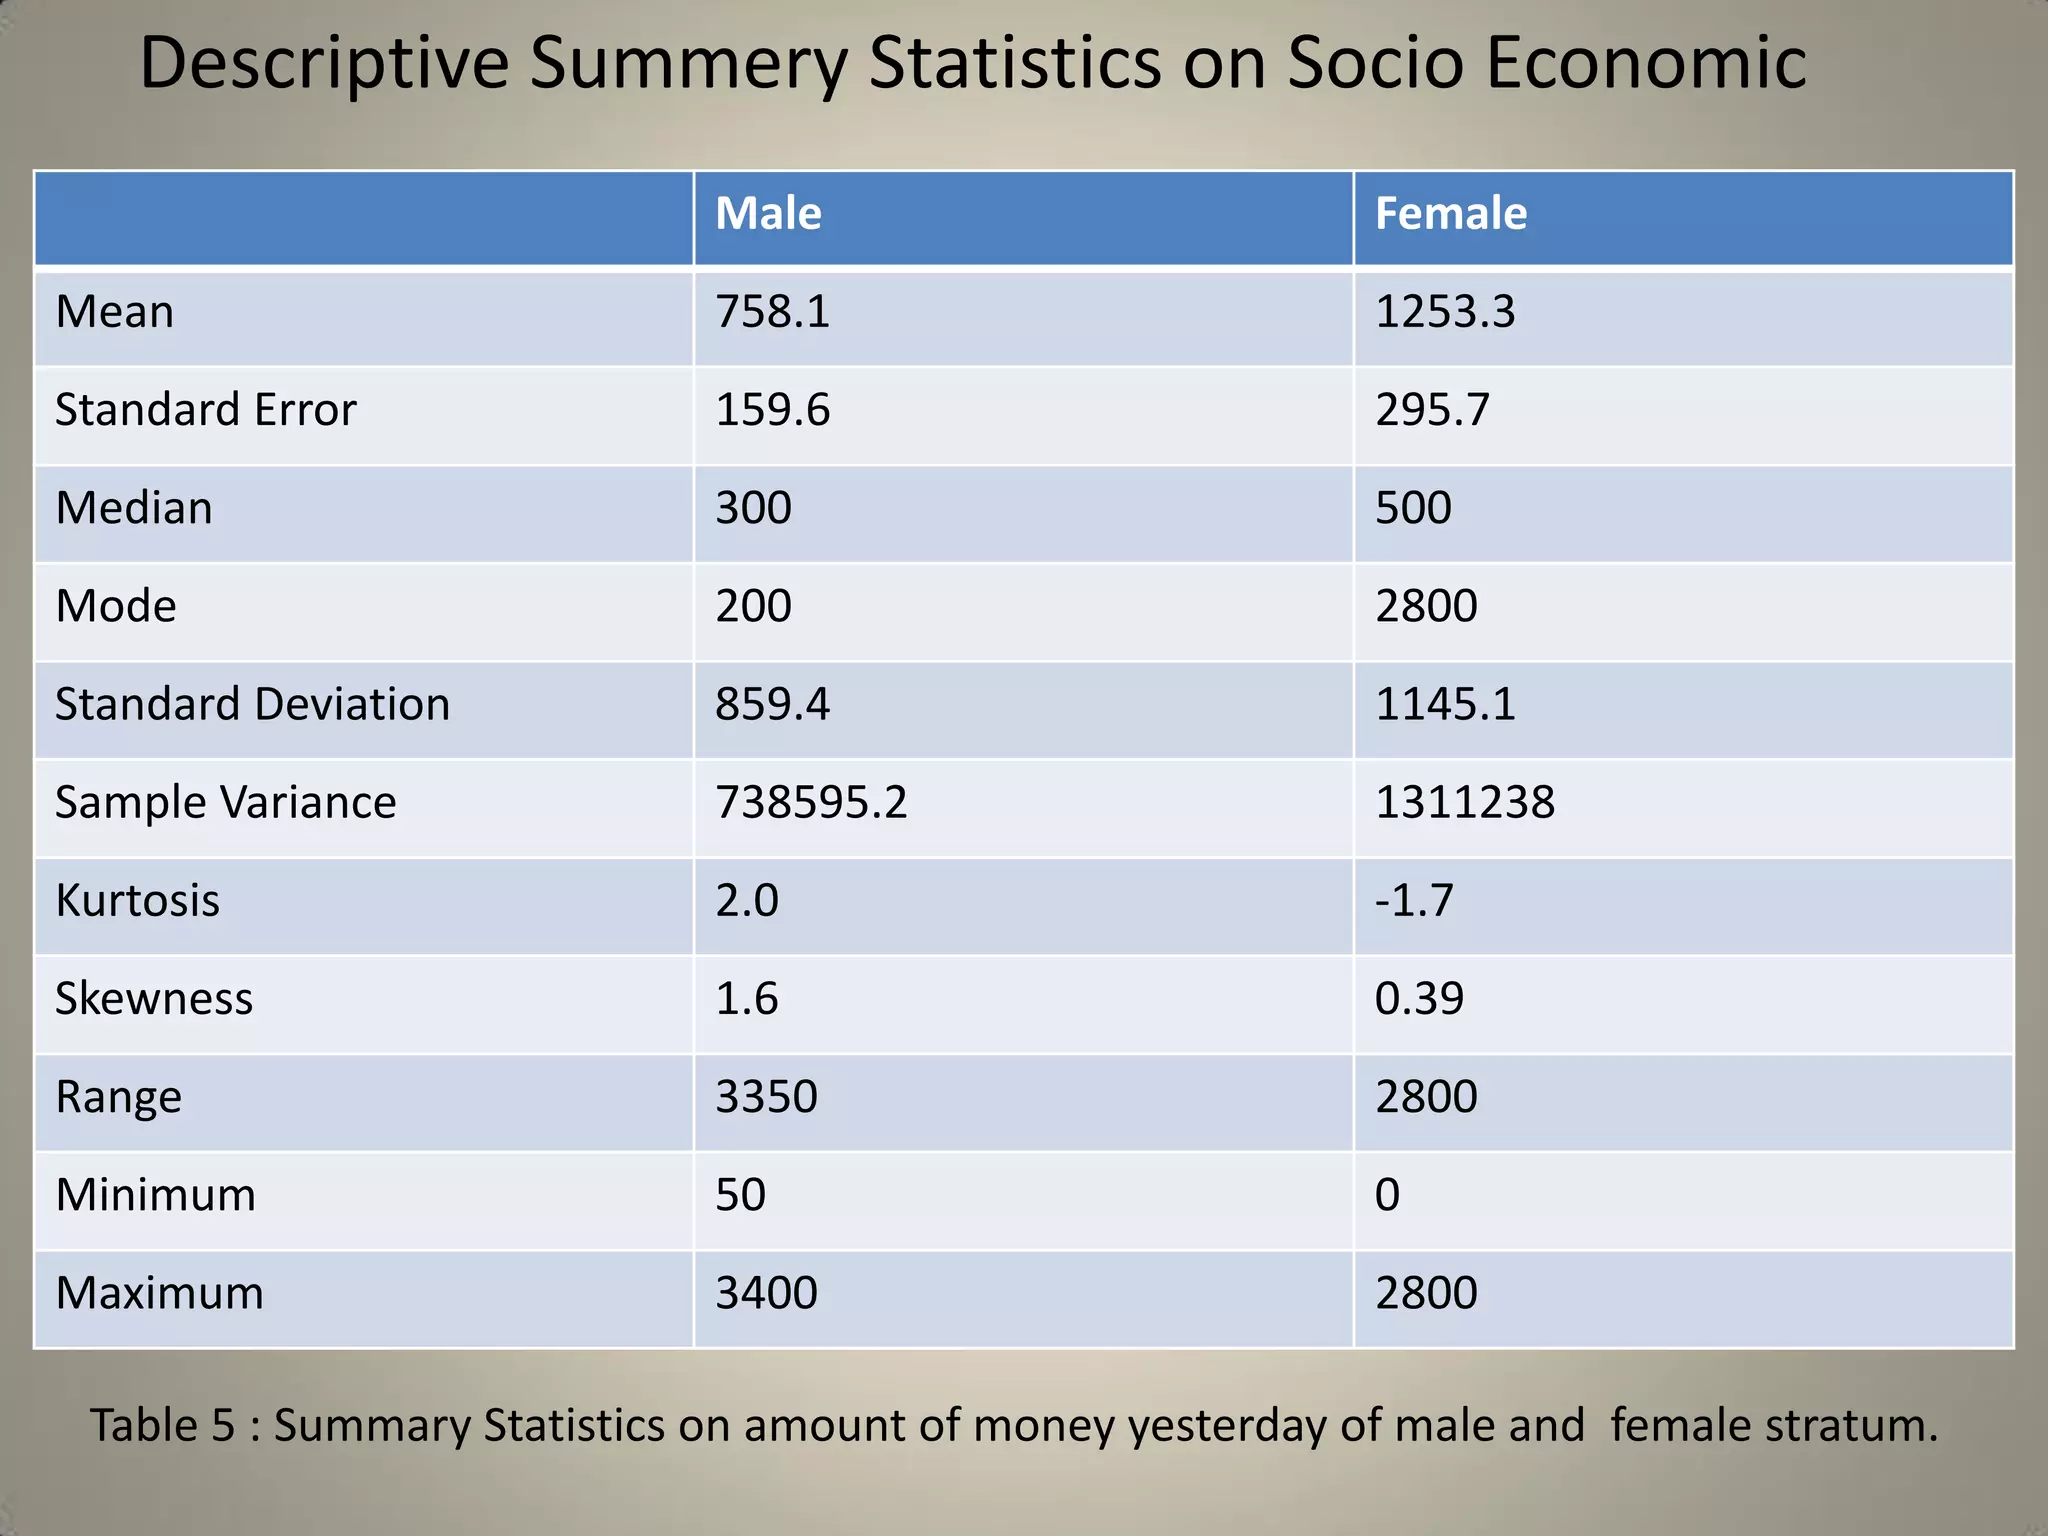
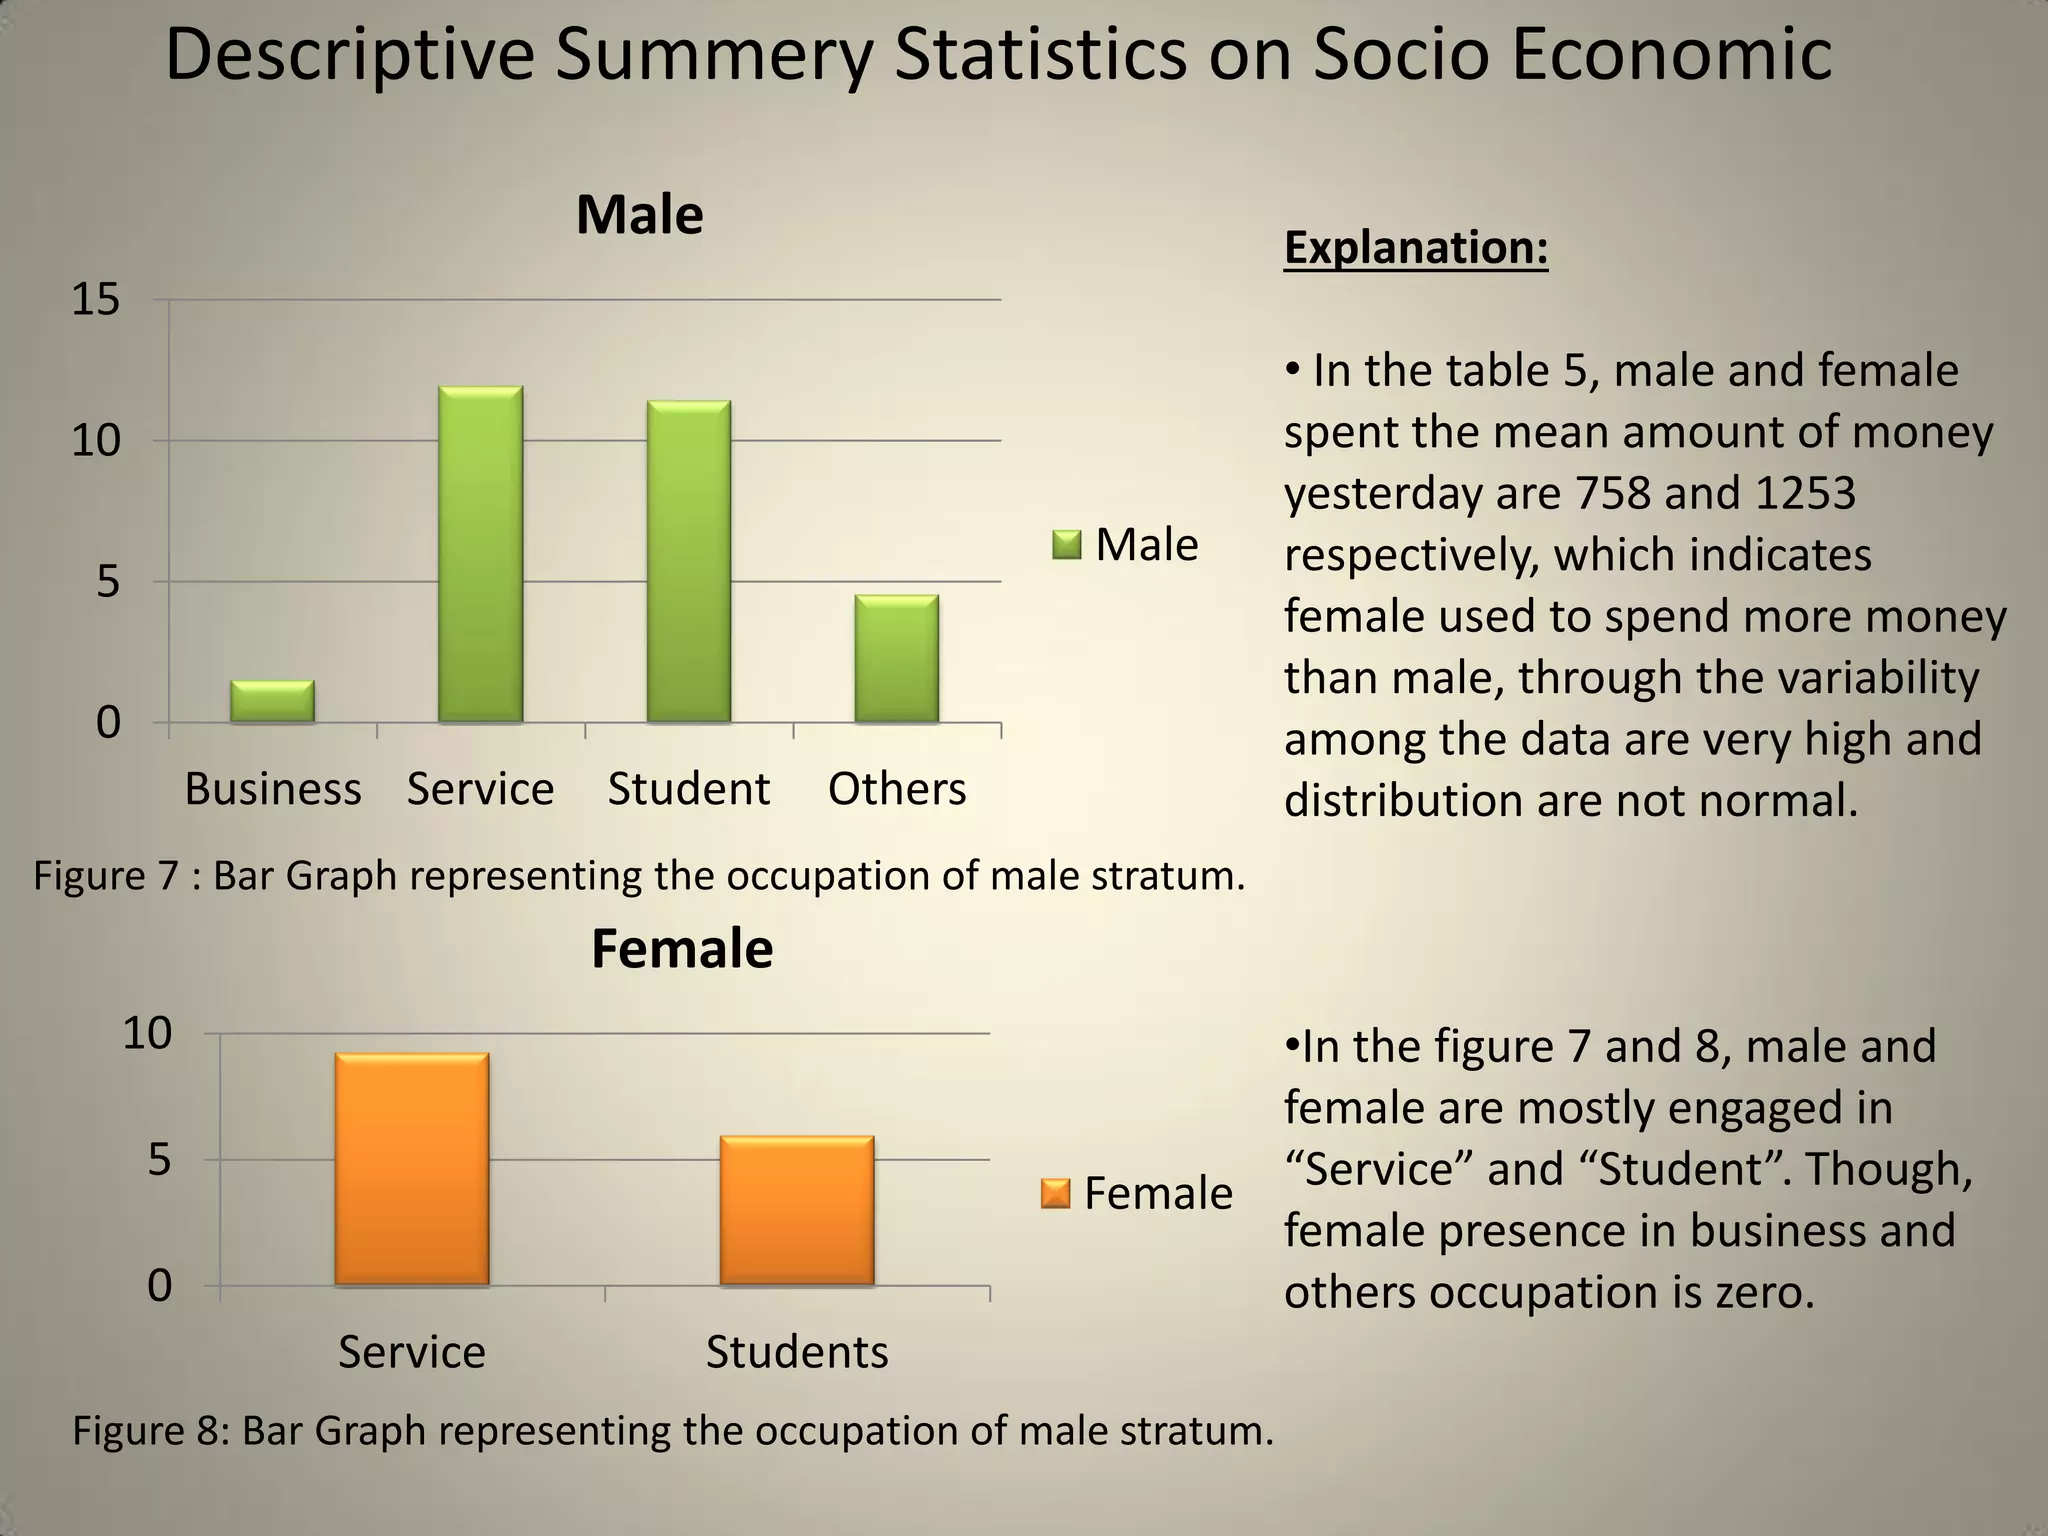
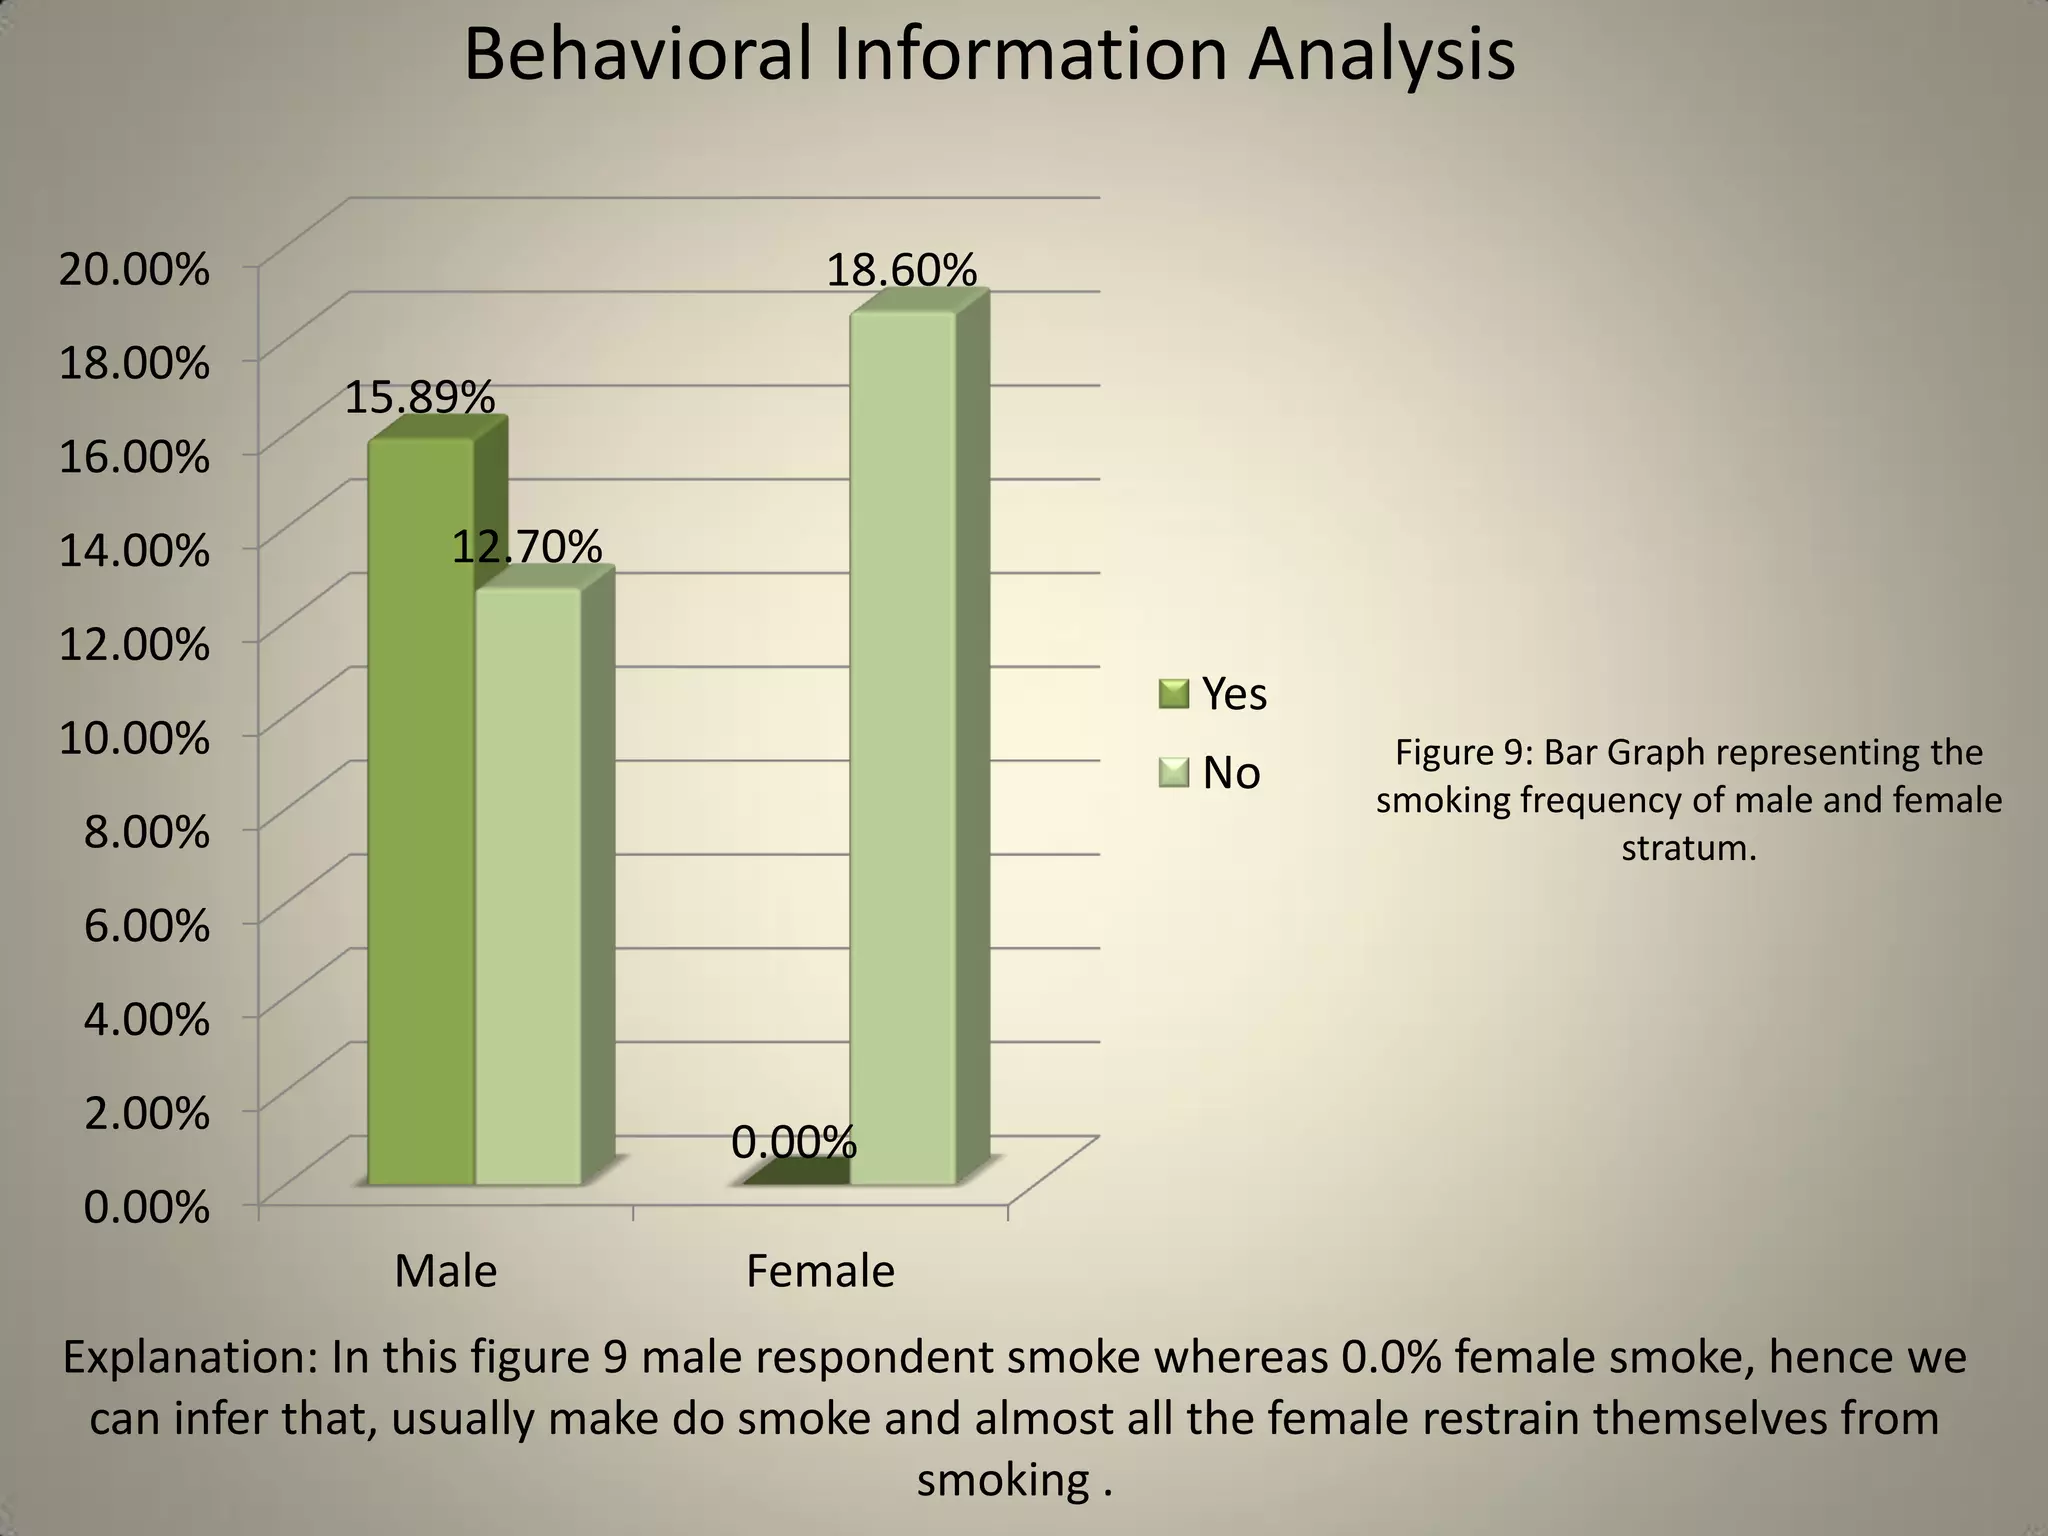
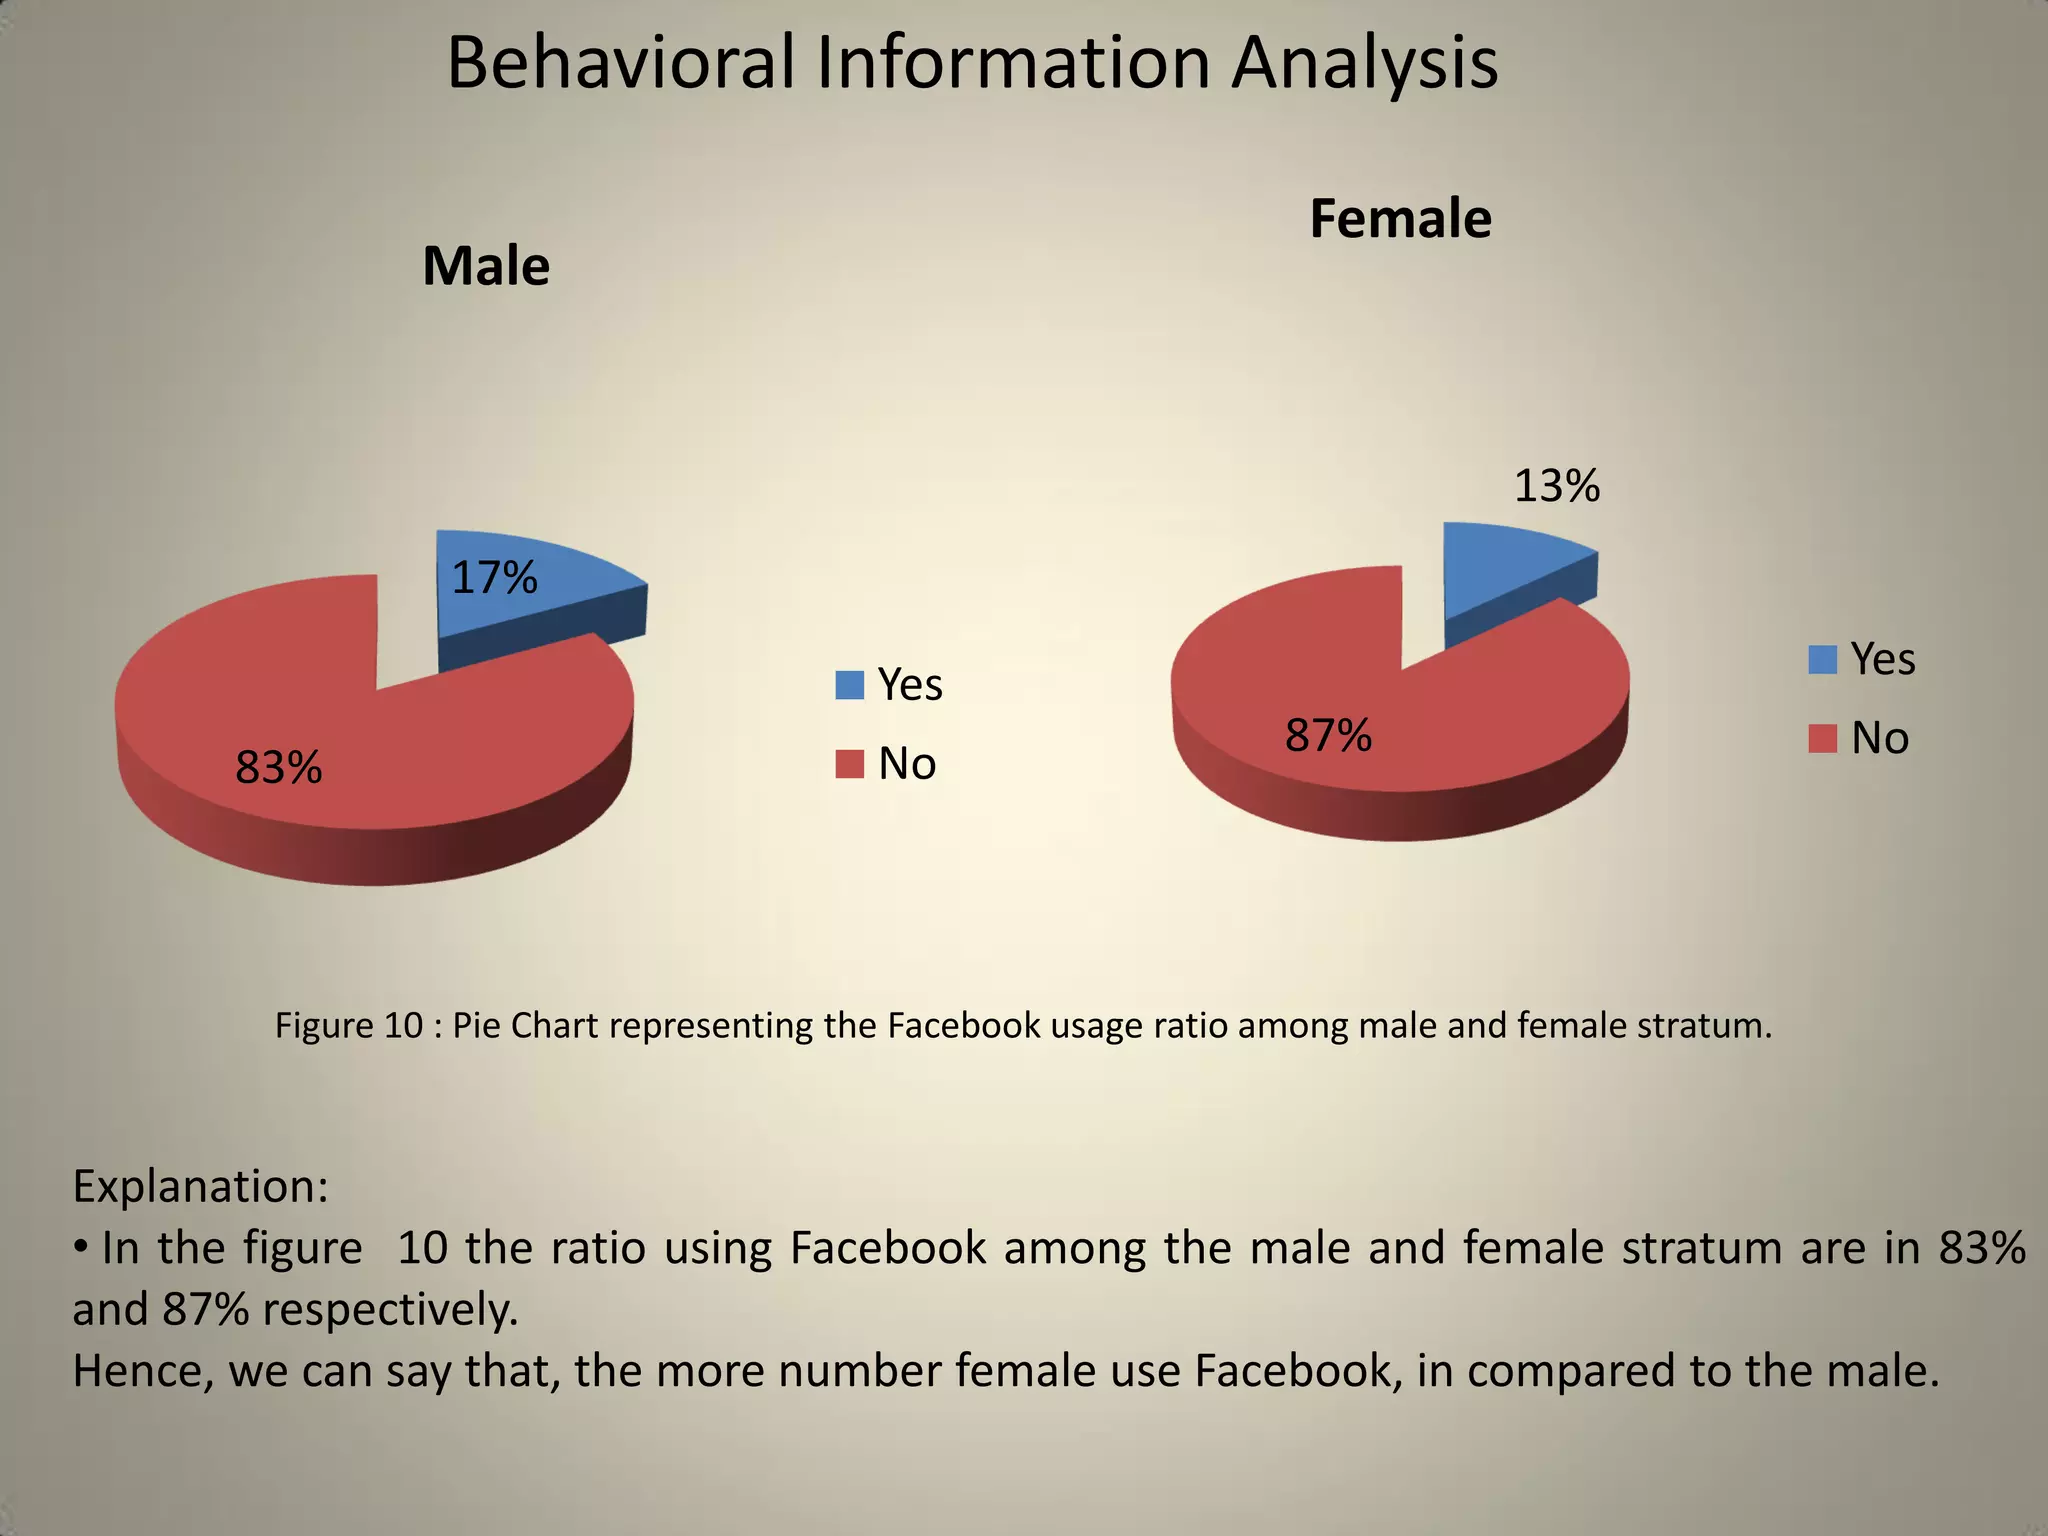
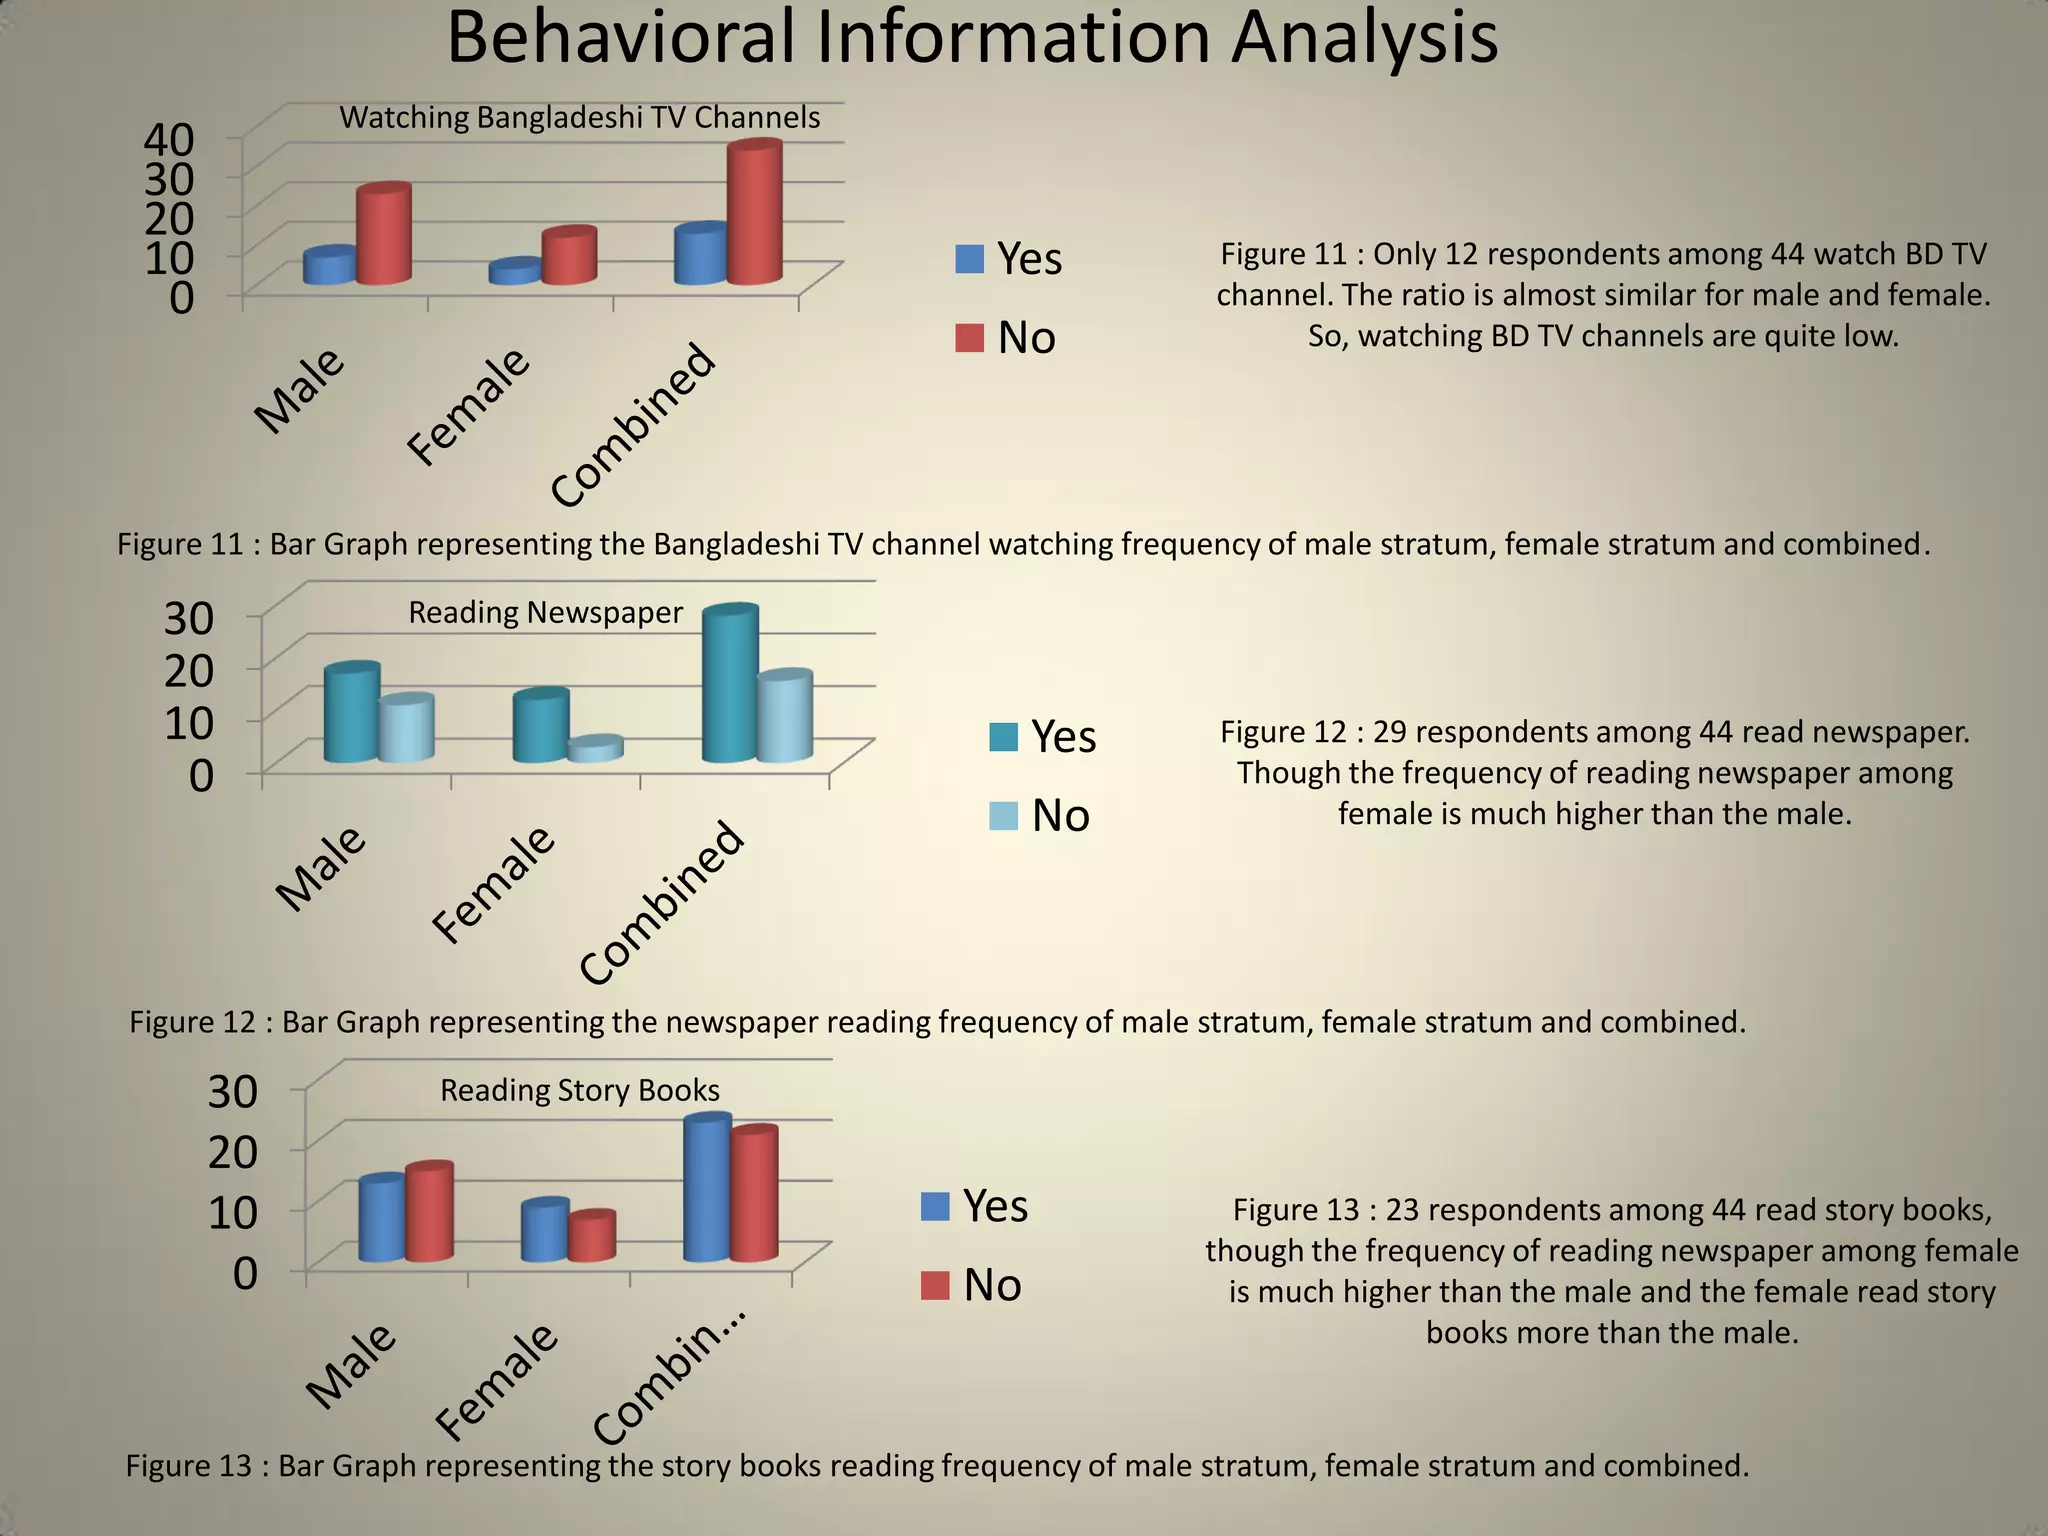
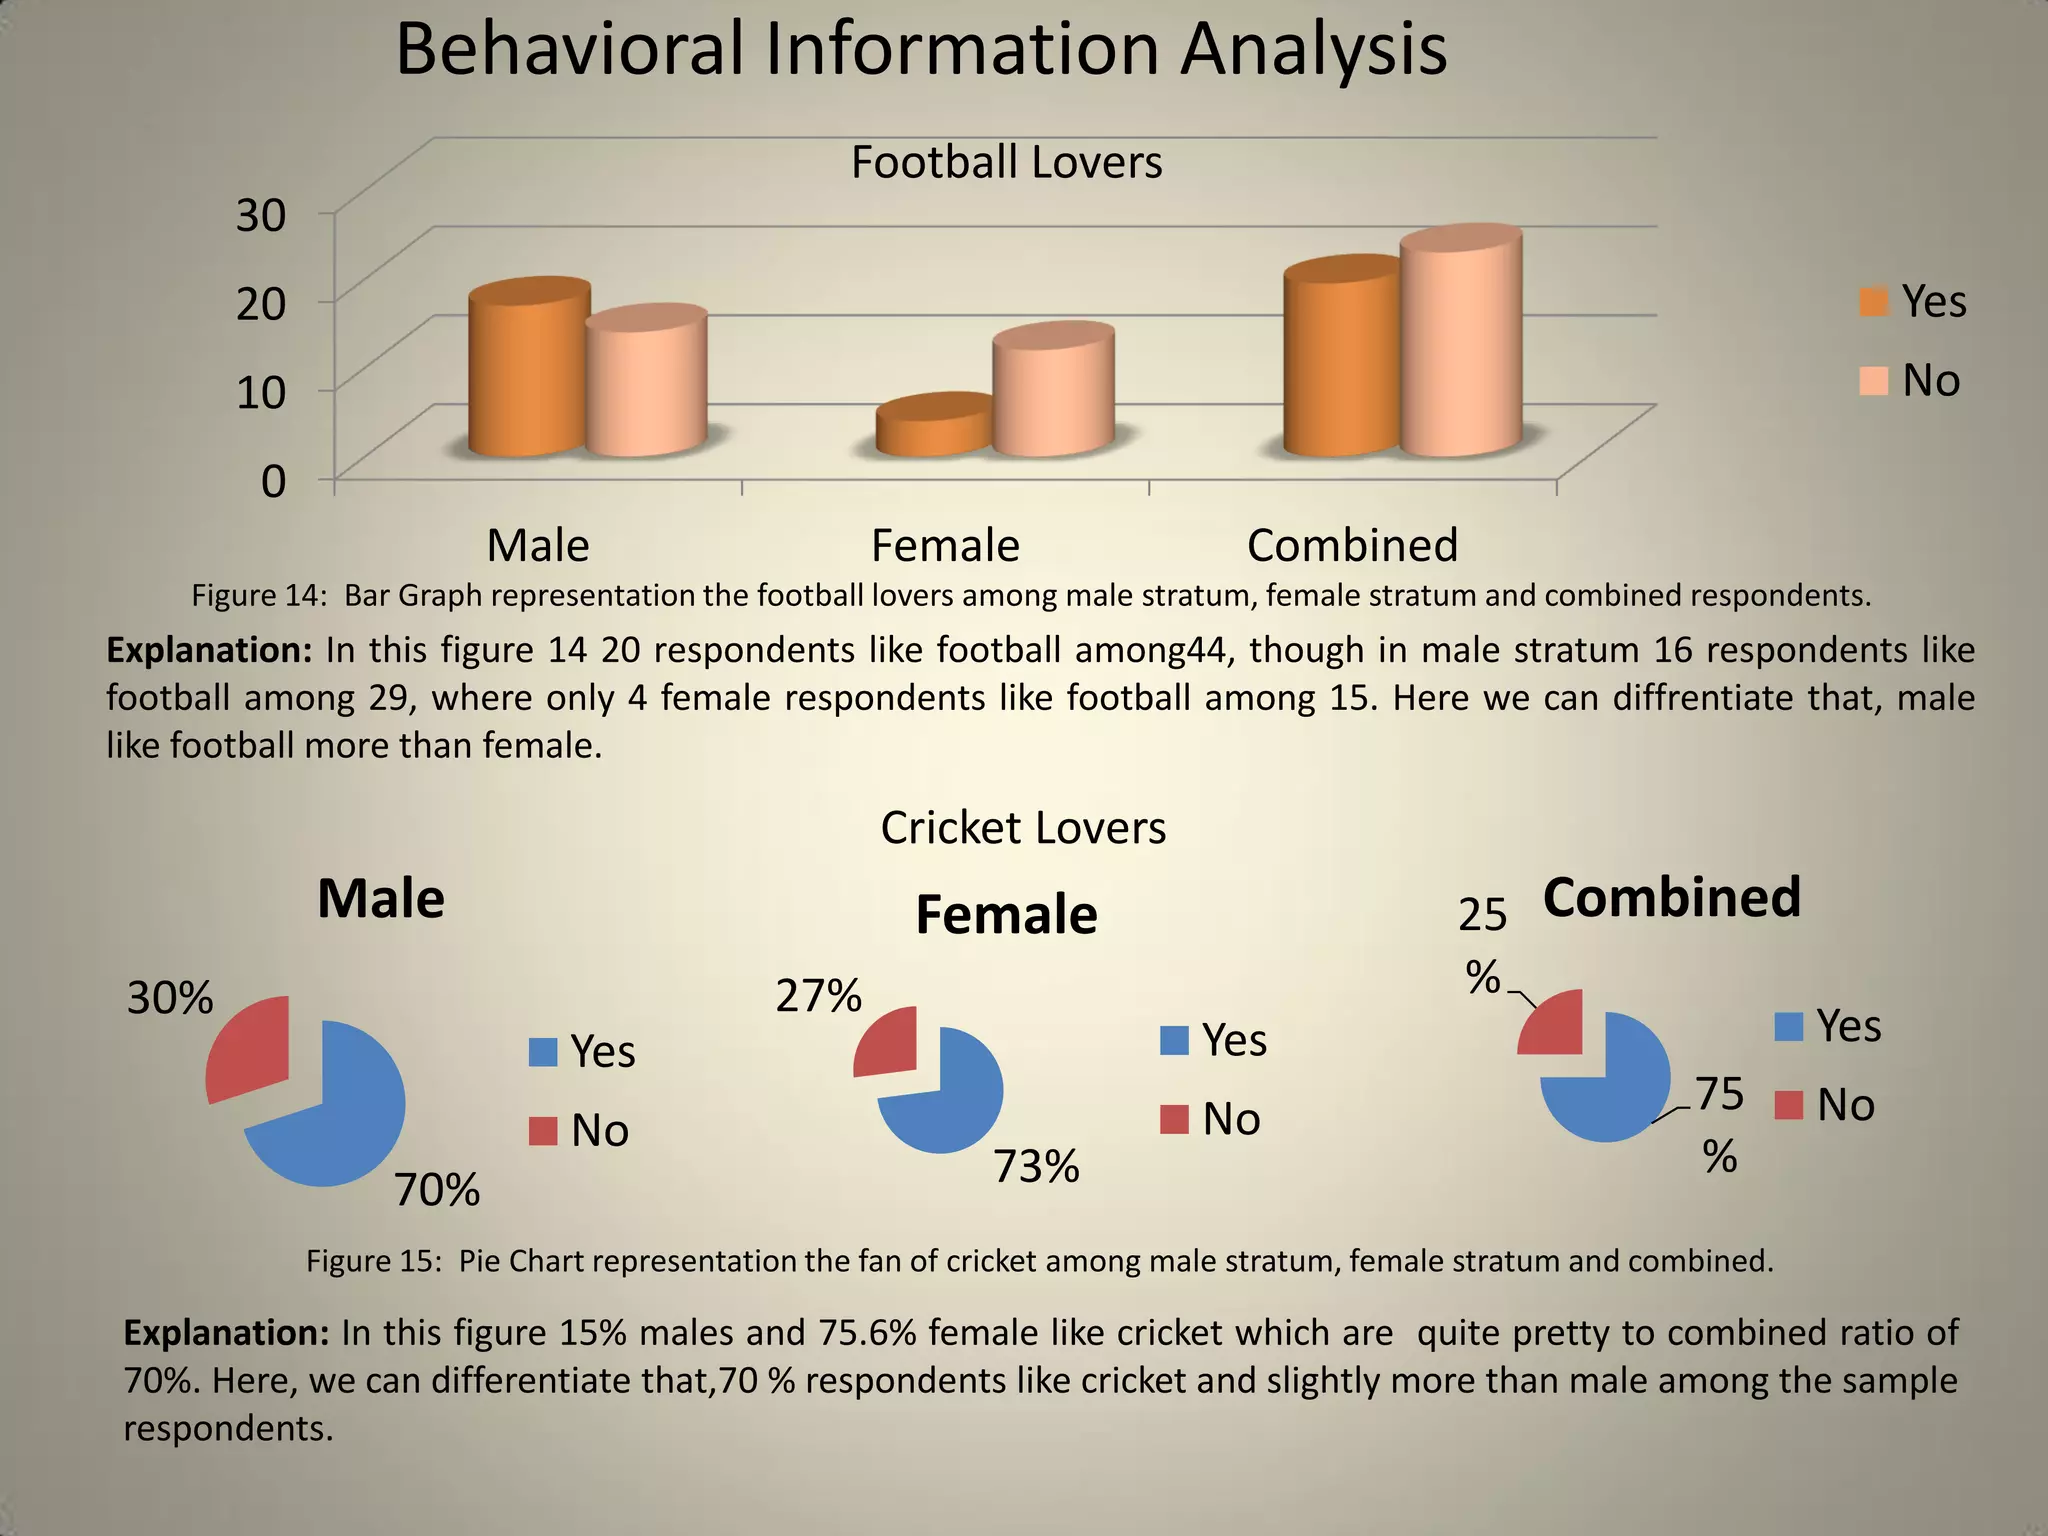
SlideShare a Scribd company logo
This Presentation is on
Determination and Analysis of Sample size
by observing and using sample with appropriate sampling scheme
Submitted By
Sudipto Krishna Dutta
ID: 20204021
Section: A, Batch: 04
Course Title: Sampling Methodology (PM-ASDS02)
Sampling Frame, Population Data and Survey Questions
 Total Population = 50 Students
 Sampling Units = Students
Given Survey Questions
Demographic
Information
Gender
Age
Marital Status
Weight
Residence
Division of
Present
Residence
Location of
Present
Residence
Socio Economic
Information
Current Occupation
Amount of money
spent yesterday
Behavioral Information
Do you smoke?
Do you use Facebook?
Do you watch
Bangladeshi TV
channels?
Do you read
newspaper?
Do you read story
books?
Do you like cricket?
Do you like football?
Sampling Methodology and Sample Size Determination
• Stratifies Sampling : Stratified Sampling method is selected for greater precision and to
ensure representation of small sub groups. Also proportional allocation technique is used to
allocate sample size to different starta.
• Stratum : (1) Male (2) Female
Allocating sample size to strata
• Population Size : N = 50
• Desired Sample Size : n = 44
Here, I used simple random sampling technique with considering 5% level of
significance and the desired precision is 0.05 and “P” & “Q” are unknown
Sl. # (i) Stratum Ni Wi = Ni/N ni
1 Male 33 0.66 29
2 Female 17 0.34 15
Total 50 1.00 44
Tabular Representation of Sampling Data
Table 1 : Frequency distribution on Residence of 29 Male stratum.
Table 2 : Frequency distribution on Residence of 15 Female stratum.
Graphical Representation of Sampling Data
Figure 1 :Bar Graph representing the
residence of male stratum.
Figure 2 :Bar Graph representing the
residence of female stratum.
Graphical Representation of Sampling Data
Figure 3 : Pie Chart representing
the residence of male stratum
Figure 4 :Bar Graph representing
the residence of female stratum.
Descriptive Summery Statistics on Demographic
Information
Male Female
Mean 27.6 26.5
Standard
Error
0.94 0.88
Median 25 25
Mode 25 25
Standard
Deviation
5.07 3.40
Sample
Variance
25.68 11.55
Kurtosis 1.17 0.68
Skewness 1.52 1.55
Range 18 9
Minimum 23 24
Maximum 41 26.5
Table 3 : Summary Statistics on Age of 29
male and 15 female stratum.
31%
7%
62%
Currently
Married
Others
Never
Married
Figure 5 : Pie Chart representing the marital
status of male stratum.
Descriptive Summery Statistics on Demographic
Information
Male Female
Mean 75.2 54.9
Standard
Error
2.51 2.42
Median 73 50
Mode 65 45
Standard
Deviation
13.50 9.36
Sample
Variance
182.24 87.55
Kurtosis -1.39 -1.71
Skewness 0.18 0.26
Range 40 23
Minimum 56 45
Maximum 96 68
Table 4 : Summary Statistics on weight of 29
male and 15 female stratum.
40%
20%
40%
Currently
Married
Others
Never
Married
Figure 6: Pie Chart representing the maritial status of
female stratum .
Descriptive Summery Statistics on Socio Economic
Male Female
Mean 758.1 1253.3
Standard Error 159.6 295.7
Median 300 500
Mode 200 2800
Standard Deviation 859.4 1145.1
Sample Variance 738595.2 1311238
Kurtosis 2.0 -1.7
Skewness 1.6 0.39
Range 3350 2800
Minimum 50 0
Maximum 3400 2800
Table 5 : Summary Statistics on amount of money yesterday of male and female stratum.
Descriptive Summery Statistics on Socio Economic
0
5
10
15
Business Service Student Others
Male
Male
0
5
10
Service Students
Female
Female
Figure 7 : Bar Graph representing the occupation of male stratum.
Figure 8: Bar Graph representing the occupation of male stratum.
Explanation:
• In the table 5, male and female
spent the mean amount of money
yesterday are 758 and 1253
respectively, which indicates
female used to spend more money
than male, through the variability
among the data are very high and
distribution are not normal.
•In the figure 7 and 8, male and
female are mostly engaged in
“Service” and “Student”. Though,
female presence in business and
others occupation is zero.
Behavioral Information Analysis
0.00%
2.00%
4.00%
6.00%
8.00%
10.00%
12.00%
14.00%
16.00%
18.00%
20.00%
Male Female
15.89%
0.00%
12.70%
18.60%
Yes
No Figure 9: Bar Graph representing the
smoking frequency of male and female
stratum.
Explanation: In this figure 9 male respondent smoke whereas 0.0% female smoke, hence we
can infer that, usually make do smoke and almost all the female restrain themselves from
smoking .
Behavioral Information Analysis
17%
83%
Male
Yes
No
13%
87%
Female
Yes
No
Figure 10 : Pie Chart representing the Facebook usage ratio among male and female stratum.
Explanation:
• In the figure 10 the ratio using Facebook among the male and female stratum are in 83%
and 87% respectively.
Hence, we can say that, the more number female use Facebook, in compared to the male.
Behavioral Information Analysis
0
10
20
30
40
Yes
No
Figure 11 : Bar Graph representing the Bangladeshi TV channel watching frequency of male stratum, female stratum and combined.
Watching Bangladeshi TV Channels
0
10
20
30
Yes
No
Reading Newspaper
Figure 12 : Bar Graph representing the newspaper reading frequency of male stratum, female stratum and combined.
0
10
20
30
Yes
No
Figure 13 : Bar Graph representing the story books reading frequency of male stratum, female stratum and combined.
Reading Story Books
Figure 11 : Only 12 respondents among 44 watch BD TV
channel. The ratio is almost similar for male and female.
So, watching BD TV channels are quite low.
Figure 12 : 29 respondents among 44 read newspaper.
Though the frequency of reading newspaper among
female is much higher than the male.
Figure 13 : 23 respondents among 44 read story books,
though the frequency of reading newspaper among female
is much higher than the male and the female read story
books more than the male.
Behavioral Information Analysis
0
10
20
30
Male Female Combined
Yes
No
Football Lovers
Figure 14: Bar Graph representation the football lovers among male stratum, female stratum and combined respondents.
Explanation: In this figure 14 20 respondents like football among44, though in male stratum 16 respondents like
football among 29, where only 4 female respondents like football among 15. Here we can diffrentiate that, male
like football more than female.
70%
30%
Male
Yes
No
73%
27%
Female
Yes
No 75
%
25
%
Combined
Yes
No
Figure 15: Pie Chart representation the fan of cricket among male stratum, female stratum and combined.
Explanation: In this figure 15% males and 75.6% female like cricket which are quite pretty to combined ratio of
70%. Here, we can differentiate that,70 % respondents like cricket and slightly more than male among the sample
respondents.
Cricket Lovers
All this things concludes my presentation.
Thank You!!

More Related Content

What's hot

Sample size calculation
Sample  size calculationSample  size calculation
Sample size calculation
Swati Singh
 
Practical Methods To Overcome Sample Size Challenges
Practical Methods To Overcome Sample Size ChallengesPractical Methods To Overcome Sample Size Challenges
Practical Methods To Overcome Sample Size Challenges
nQuery
 
Minimizing Risk In Phase II and III Sample Size Calculation
Minimizing Risk In Phase II and III Sample Size CalculationMinimizing Risk In Phase II and III Sample Size Calculation
Minimizing Risk In Phase II and III Sample Size Calculation
nQuery
 
Sample size determination
Sample size determinationSample size determination
Sample size determination
Gopal Kumar
 
Sample Size Determination
Sample Size DeterminationSample Size Determination
Statistics
StatisticsStatistics
Mangasini ppt lect_sample size determination
Mangasini ppt lect_sample size determinationMangasini ppt lect_sample size determination
Mangasini ppt lect_sample size determination
Mangasini Katundu
 
Standard error
Standard error Standard error
Standard error
Satyaki Mishra
 
Sample size calculations
Sample size calculationsSample size calculations
How to determine sample size
How to determine sample size How to determine sample size
How to determine sample size
saifur rahman
 
Sample size estimation
Sample size estimationSample size estimation
Sample size estimation
Monali2011
 
Sampling in Statistical Inference
Sampling in Statistical InferenceSampling in Statistical Inference
Sampling in Statistical Inference
Khawaja Naveed
 
Sampling 1231243290208505 1
Sampling 1231243290208505 1Sampling 1231243290208505 1
Sampling 1231243290208505 1guest7e772ec
 
6. sample size v3
6. sample size   v36. sample size   v3
6. sample size v3
Ashok Kulkarni
 
Sampling Size
Sampling SizeSampling Size
Sampling Size
Daniel Moore
 
Sample size calculation
Sample size calculationSample size calculation
Sample size calculation
Santam Chakraborty
 
8 sampling & sample size (Dr. Mai,2014)
8  sampling & sample size (Dr. Mai,2014)8  sampling & sample size (Dr. Mai,2014)
8 sampling & sample size (Dr. Mai,2014)
Phong Đá
 

What's hot (20)

Sample size calculation
Sample  size calculationSample  size calculation
Sample size calculation
 
Practical Methods To Overcome Sample Size Challenges
Practical Methods To Overcome Sample Size ChallengesPractical Methods To Overcome Sample Size Challenges
Practical Methods To Overcome Sample Size Challenges
 
Minimizing Risk In Phase II and III Sample Size Calculation
Minimizing Risk In Phase II and III Sample Size CalculationMinimizing Risk In Phase II and III Sample Size Calculation
Minimizing Risk In Phase II and III Sample Size Calculation
 
Sample size
Sample sizeSample size
Sample size
 
Sample size determination
Sample size determinationSample size determination
Sample size determination
 
Sample Size Determination
Sample Size DeterminationSample Size Determination
Sample Size Determination
 
Sample size calculation final
Sample size calculation finalSample size calculation final
Sample size calculation final
 
Statistics
StatisticsStatistics
Statistics
 
Mangasini ppt lect_sample size determination
Mangasini ppt lect_sample size determinationMangasini ppt lect_sample size determination
Mangasini ppt lect_sample size determination
 
Standard error
Standard error Standard error
Standard error
 
Sample size calculations
Sample size calculationsSample size calculations
Sample size calculations
 
SAMPLE SIZE, CONSENT, STATISTICS
SAMPLE SIZE, CONSENT, STATISTICSSAMPLE SIZE, CONSENT, STATISTICS
SAMPLE SIZE, CONSENT, STATISTICS
 
How to determine sample size
How to determine sample size How to determine sample size
How to determine sample size
 
Sample size estimation
Sample size estimationSample size estimation
Sample size estimation
 
Sampling in Statistical Inference
Sampling in Statistical InferenceSampling in Statistical Inference
Sampling in Statistical Inference
 
Sampling 1231243290208505 1
Sampling 1231243290208505 1Sampling 1231243290208505 1
Sampling 1231243290208505 1
 
6. sample size v3
6. sample size   v36. sample size   v3
6. sample size v3
 
Sampling Size
Sampling SizeSampling Size
Sampling Size
 
Sample size calculation
Sample size calculationSample size calculation
Sample size calculation
 
8 sampling & sample size (Dr. Mai,2014)
8  sampling & sample size (Dr. Mai,2014)8  sampling & sample size (Dr. Mai,2014)
8 sampling & sample size (Dr. Mai,2014)
 

Similar to Determination and Analysis of Sample size

Page 1 of 1 PSY2061 Research Methods Lab © 2013 South Un.docx
Page 1 of 1 PSY2061 Research Methods Lab © 2013 South Un.docxPage 1 of 1 PSY2061 Research Methods Lab © 2013 South Un.docx
Page 1 of 1 PSY2061 Research Methods Lab © 2013 South Un.docx
honey690131
 
Page 1 of 1 PSY2061 Research Methods Lab © 2013 South Un.docx
Page 1 of 1 PSY2061 Research Methods Lab © 2013 South Un.docxPage 1 of 1 PSY2061 Research Methods Lab © 2013 South Un.docx
Page 1 of 1 PSY2061 Research Methods Lab © 2013 South Un.docx
aman341480
 
Social psychology
Social psychologySocial psychology
Social psychologyDanish Mak
 
Labour Ligislation- CIA 2.docx
Labour Ligislation- CIA 2.docxLabour Ligislation- CIA 2.docx
Labour Ligislation- CIA 2.docx
HarshadaSujith
 
Data Analysis for Graduate Studies Summary
Data Analysis for Graduate Studies SummaryData Analysis for Graduate Studies Summary
Data Analysis for Graduate Studies Summary
KelvinNMhina
 
Social Studies School Based Assignments (SBA)
Social Studies School Based Assignments (SBA)Social Studies School Based Assignments (SBA)
Social Studies School Based Assignments (SBA)
Errol Hussey
 
Running head Statistics 2Statistics Statistics Na.docx
Running head Statistics 2Statistics Statistics Na.docxRunning head Statistics 2Statistics Statistics Na.docx
Running head Statistics 2Statistics Statistics Na.docx
agnesdcarey33086
 
Final report mkt
Final report mktFinal report mkt
Final report mkt
Charan Singh
 
Chapter iv data analysis and interpretation
Chapter iv data analysis and interpretationChapter iv data analysis and interpretation
Chapter iv data analysis and interpretation
anjalatchi
 
Multiple Linear Regression Homework Help
Multiple Linear Regression Homework HelpMultiple Linear Regression Homework Help
Multiple Linear Regression Homework Help
Statistics Homework Helper
 
Original Research in Current Employment
Original Research in Current EmploymentOriginal Research in Current Employment
Original Research in Current EmploymentCarlos Vasquez
 
Applied Statistics
Applied StatisticsApplied Statistics
Applied Statistics
Ishtiaq Ishaq
 
A Study of Factors Influencing Selection of Management Colleges in India - A ...
A Study of Factors Influencing Selection of Management Colleges in India - A ...A Study of Factors Influencing Selection of Management Colleges in India - A ...
A Study of Factors Influencing Selection of Management Colleges in India - A ...Ravi Shankar
 
Statistical Analysis.02.06.2022 (1).pdf
Statistical Analysis.02.06.2022 (1).pdfStatistical Analysis.02.06.2022 (1).pdf
Statistical Analysis.02.06.2022 (1).pdf
statsanjal
 
StatProb.ppt
StatProb.pptStatProb.ppt
StatProb.ppt
UMESHK25
 
StatProb.ppt
StatProb.pptStatProb.ppt
StatProb.ppt
UMESHK25
 
StatProb (1).ppt
StatProb (1).pptStatProb (1).ppt
StatProb (1).ppt
UMESHK25
 
StatProb (1).ppt
StatProb (1).pptStatProb (1).ppt
StatProb (1).ppt
UMESHK25
 

Similar to Determination and Analysis of Sample size (20)

Page 1 of 1 PSY2061 Research Methods Lab © 2013 South Un.docx
Page 1 of 1 PSY2061 Research Methods Lab © 2013 South Un.docxPage 1 of 1 PSY2061 Research Methods Lab © 2013 South Un.docx
Page 1 of 1 PSY2061 Research Methods Lab © 2013 South Un.docx
 
Page 1 of 1 PSY2061 Research Methods Lab © 2013 South Un.docx
Page 1 of 1 PSY2061 Research Methods Lab © 2013 South Un.docxPage 1 of 1 PSY2061 Research Methods Lab © 2013 South Un.docx
Page 1 of 1 PSY2061 Research Methods Lab © 2013 South Un.docx
 
Social psychology
Social psychologySocial psychology
Social psychology
 
Labour Ligislation- CIA 2.docx
Labour Ligislation- CIA 2.docxLabour Ligislation- CIA 2.docx
Labour Ligislation- CIA 2.docx
 
Data Analysis for Graduate Studies Summary
Data Analysis for Graduate Studies SummaryData Analysis for Graduate Studies Summary
Data Analysis for Graduate Studies Summary
 
QRM Index
QRM IndexQRM Index
QRM Index
 
Social Studies School Based Assignments (SBA)
Social Studies School Based Assignments (SBA)Social Studies School Based Assignments (SBA)
Social Studies School Based Assignments (SBA)
 
Running head Statistics 2Statistics Statistics Na.docx
Running head Statistics 2Statistics Statistics Na.docxRunning head Statistics 2Statistics Statistics Na.docx
Running head Statistics 2Statistics Statistics Na.docx
 
Final report mkt
Final report mktFinal report mkt
Final report mkt
 
Chapter iv data analysis and interpretation
Chapter iv data analysis and interpretationChapter iv data analysis and interpretation
Chapter iv data analysis and interpretation
 
Multiple Linear Regression Homework Help
Multiple Linear Regression Homework HelpMultiple Linear Regression Homework Help
Multiple Linear Regression Homework Help
 
The Racial Gap on Wages
The Racial Gap on Wages The Racial Gap on Wages
The Racial Gap on Wages
 
Original Research in Current Employment
Original Research in Current EmploymentOriginal Research in Current Employment
Original Research in Current Employment
 
Applied Statistics
Applied StatisticsApplied Statistics
Applied Statistics
 
A Study of Factors Influencing Selection of Management Colleges in India - A ...
A Study of Factors Influencing Selection of Management Colleges in India - A ...A Study of Factors Influencing Selection of Management Colleges in India - A ...
A Study of Factors Influencing Selection of Management Colleges in India - A ...
 
Statistical Analysis.02.06.2022 (1).pdf
Statistical Analysis.02.06.2022 (1).pdfStatistical Analysis.02.06.2022 (1).pdf
Statistical Analysis.02.06.2022 (1).pdf
 
StatProb.ppt
StatProb.pptStatProb.ppt
StatProb.ppt
 
StatProb.ppt
StatProb.pptStatProb.ppt
StatProb.ppt
 
StatProb (1).ppt
StatProb (1).pptStatProb (1).ppt
StatProb (1).ppt
 
StatProb (1).ppt
StatProb (1).pptStatProb (1).ppt
StatProb (1).ppt
 

More from Sudipto Krishna Dutta

A Project Report on RFID Based Attendance System.pdf
A Project Report on RFID Based Attendance System.pdfA Project Report on RFID Based Attendance System.pdf
A Project Report on RFID Based Attendance System.pdf
Sudipto Krishna Dutta
 
RFID BASED ATTENDANCE SYSTEM.pptx
RFID BASED ATTENDANCE SYSTEM.pptxRFID BASED ATTENDANCE SYSTEM.pptx
RFID BASED ATTENDANCE SYSTEM.pptx
Sudipto Krishna Dutta
 
Memory hierarchy (In Details)
Memory hierarchy (In Details)Memory hierarchy (In Details)
Memory hierarchy (In Details)
Sudipto Krishna Dutta
 
Character Recognition using Data Mining Technique (Artificial Neural Network)
Character Recognition using Data Mining Technique (Artificial Neural Network)Character Recognition using Data Mining Technique (Artificial Neural Network)
Character Recognition using Data Mining Technique (Artificial Neural Network)
Sudipto Krishna Dutta
 
Toolboxes for data scientists
Toolboxes for data scientistsToolboxes for data scientists
Toolboxes for data scientists
Sudipto Krishna Dutta
 
Central tendency
Central tendency Central tendency
Central tendency
Sudipto Krishna Dutta
 
Newborn Care
Newborn CareNewborn Care
Newborn Care
Sudipto Krishna Dutta
 
English Literature Book for BCS
English Literature  Book for BCSEnglish Literature  Book for BCS
English Literature Book for BCS
Sudipto Krishna Dutta
 
How to prepare for Bank exam in Bangladesh
How to prepare for Bank exam in Bangladesh How to prepare for Bank exam in Bangladesh
How to prepare for Bank exam in Bangladesh
Sudipto Krishna Dutta
 
Bcs study roadmap
Bcs study roadmapBcs study roadmap
Bcs study roadmap
Sudipto Krishna Dutta
 
Rooppur Atomic Power Plant
Rooppur Atomic Power PlantRooppur Atomic Power Plant
Rooppur Atomic Power Plant
Sudipto Krishna Dutta
 
Acute myocardial-infraction
Acute myocardial-infraction Acute myocardial-infraction
Acute myocardial-infraction
Sudipto Krishna Dutta
 
Prospectus and Drawbacks of E-commerce in Bangladesh
Prospectus and Drawbacks of E-commerce in BangladeshProspectus and Drawbacks of E-commerce in Bangladesh
Prospectus and Drawbacks of E-commerce in Bangladesh
Sudipto Krishna Dutta
 
Cybersecurity fundamental
Cybersecurity fundamentalCybersecurity fundamental
Cybersecurity fundamental
Sudipto Krishna Dutta
 

More from Sudipto Krishna Dutta (14)

A Project Report on RFID Based Attendance System.pdf
A Project Report on RFID Based Attendance System.pdfA Project Report on RFID Based Attendance System.pdf
A Project Report on RFID Based Attendance System.pdf
 
RFID BASED ATTENDANCE SYSTEM.pptx
RFID BASED ATTENDANCE SYSTEM.pptxRFID BASED ATTENDANCE SYSTEM.pptx
RFID BASED ATTENDANCE SYSTEM.pptx
 
Memory hierarchy (In Details)
Memory hierarchy (In Details)Memory hierarchy (In Details)
Memory hierarchy (In Details)
 
Character Recognition using Data Mining Technique (Artificial Neural Network)
Character Recognition using Data Mining Technique (Artificial Neural Network)Character Recognition using Data Mining Technique (Artificial Neural Network)
Character Recognition using Data Mining Technique (Artificial Neural Network)
 
Toolboxes for data scientists
Toolboxes for data scientistsToolboxes for data scientists
Toolboxes for data scientists
 
Central tendency
Central tendency Central tendency
Central tendency
 
Newborn Care
Newborn CareNewborn Care
Newborn Care
 
English Literature Book for BCS
English Literature  Book for BCSEnglish Literature  Book for BCS
English Literature Book for BCS
 
How to prepare for Bank exam in Bangladesh
How to prepare for Bank exam in Bangladesh How to prepare for Bank exam in Bangladesh
How to prepare for Bank exam in Bangladesh
 
Bcs study roadmap
Bcs study roadmapBcs study roadmap
Bcs study roadmap
 
Rooppur Atomic Power Plant
Rooppur Atomic Power PlantRooppur Atomic Power Plant
Rooppur Atomic Power Plant
 
Acute myocardial-infraction
Acute myocardial-infraction Acute myocardial-infraction
Acute myocardial-infraction
 
Prospectus and Drawbacks of E-commerce in Bangladesh
Prospectus and Drawbacks of E-commerce in BangladeshProspectus and Drawbacks of E-commerce in Bangladesh
Prospectus and Drawbacks of E-commerce in Bangladesh
 
Cybersecurity fundamental
Cybersecurity fundamentalCybersecurity fundamental
Cybersecurity fundamental
 

Recently uploaded

一比一原版(UMich毕业证)密歇根大学|安娜堡分校毕业证成绩单
一比一原版(UMich毕业证)密歇根大学|安娜堡分校毕业证成绩单一比一原版(UMich毕业证)密歇根大学|安娜堡分校毕业证成绩单
一比一原版(UMich毕业证)密歇根大学|安娜堡分校毕业证成绩单
ewymefz
 
standardisation of garbhpala offhgfffghh
standardisation of garbhpala offhgfffghhstandardisation of garbhpala offhgfffghh
standardisation of garbhpala offhgfffghh
ArpitMalhotra16
 
Malana- Gimlet Market Analysis (Portfolio 2)
Malana- Gimlet Market Analysis (Portfolio 2)Malana- Gimlet Market Analysis (Portfolio 2)
Malana- Gimlet Market Analysis (Portfolio 2)
TravisMalana
 
一比一原版(UPenn毕业证)宾夕法尼亚大学毕业证成绩单
一比一原版(UPenn毕业证)宾夕法尼亚大学毕业证成绩单一比一原版(UPenn毕业证)宾夕法尼亚大学毕业证成绩单
一比一原版(UPenn毕业证)宾夕法尼亚大学毕业证成绩单
ewymefz
 
一比一原版(CU毕业证)卡尔顿大学毕业证成绩单
一比一原版(CU毕业证)卡尔顿大学毕业证成绩单一比一原版(CU毕业证)卡尔顿大学毕业证成绩单
一比一原版(CU毕业证)卡尔顿大学毕业证成绩单
yhkoc
 
Opendatabay - Open Data Marketplace.pptx
Opendatabay - Open Data Marketplace.pptxOpendatabay - Open Data Marketplace.pptx
Opendatabay - Open Data Marketplace.pptx
Opendatabay
 
一比一原版(NYU毕业证)纽约大学毕业证成绩单
一比一原版(NYU毕业证)纽约大学毕业证成绩单一比一原版(NYU毕业证)纽约大学毕业证成绩单
一比一原版(NYU毕业证)纽约大学毕业证成绩单
ewymefz
 
Adjusting primitives for graph : SHORT REPORT / NOTES
Adjusting primitives for graph : SHORT REPORT / NOTESAdjusting primitives for graph : SHORT REPORT / NOTES
Adjusting primitives for graph : SHORT REPORT / NOTES
Subhajit Sahu
 
一比一原版(CBU毕业证)卡普顿大学毕业证成绩单
一比一原版(CBU毕业证)卡普顿大学毕业证成绩单一比一原版(CBU毕业证)卡普顿大学毕业证成绩单
一比一原版(CBU毕业证)卡普顿大学毕业证成绩单
nscud
 
Levelwise PageRank with Loop-Based Dead End Handling Strategy : SHORT REPORT ...
Levelwise PageRank with Loop-Based Dead End Handling Strategy : SHORT REPORT ...Levelwise PageRank with Loop-Based Dead End Handling Strategy : SHORT REPORT ...
Levelwise PageRank with Loop-Based Dead End Handling Strategy : SHORT REPORT ...
Subhajit Sahu
 
社内勉強会資料_LLM Agents                              .
社内勉強会資料_LLM Agents                              .社内勉強会資料_LLM Agents                              .
社内勉強会資料_LLM Agents                              .
NABLAS株式会社
 
一比一原版(Bradford毕业证书)布拉德福德大学毕业证如何办理
一比一原版(Bradford毕业证书)布拉德福德大学毕业证如何办理一比一原版(Bradford毕业证书)布拉德福德大学毕业证如何办理
一比一原版(Bradford毕业证书)布拉德福德大学毕业证如何办理
mbawufebxi
 
一比一原版(UIUC毕业证)伊利诺伊大学|厄巴纳-香槟分校毕业证如何办理
一比一原版(UIUC毕业证)伊利诺伊大学|厄巴纳-香槟分校毕业证如何办理一比一原版(UIUC毕业证)伊利诺伊大学|厄巴纳-香槟分校毕业证如何办理
一比一原版(UIUC毕业证)伊利诺伊大学|厄巴纳-香槟分校毕业证如何办理
ahzuo
 
一比一原版(Adelaide毕业证书)阿德莱德大学毕业证如何办理
一比一原版(Adelaide毕业证书)阿德莱德大学毕业证如何办理一比一原版(Adelaide毕业证书)阿德莱德大学毕业证如何办理
一比一原版(Adelaide毕业证书)阿德莱德大学毕业证如何办理
slg6lamcq
 
FP Growth Algorithm and its Applications
FP Growth Algorithm and its ApplicationsFP Growth Algorithm and its Applications
FP Growth Algorithm and its Applications
MaleehaSheikh2
 
一比一原版(UVic毕业证)维多利亚大学毕业证成绩单
一比一原版(UVic毕业证)维多利亚大学毕业证成绩单一比一原版(UVic毕业证)维多利亚大学毕业证成绩单
一比一原版(UVic毕业证)维多利亚大学毕业证成绩单
ukgaet
 
一比一原版(QU毕业证)皇后大学毕业证成绩单
一比一原版(QU毕业证)皇后大学毕业证成绩单一比一原版(QU毕业证)皇后大学毕业证成绩单
一比一原版(QU毕业证)皇后大学毕业证成绩单
enxupq
 
一比一原版(YU毕业证)约克大学毕业证成绩单
一比一原版(YU毕业证)约克大学毕业证成绩单一比一原版(YU毕业证)约克大学毕业证成绩单
一比一原版(YU毕业证)约克大学毕业证成绩单
enxupq
 
SOCRadar Germany 2024 Threat Landscape Report
SOCRadar Germany 2024 Threat Landscape ReportSOCRadar Germany 2024 Threat Landscape Report
SOCRadar Germany 2024 Threat Landscape Report
SOCRadar
 
Data Centers - Striving Within A Narrow Range - Research Report - MCG - May 2...
Data Centers - Striving Within A Narrow Range - Research Report - MCG - May 2...Data Centers - Striving Within A Narrow Range - Research Report - MCG - May 2...
Data Centers - Striving Within A Narrow Range - Research Report - MCG - May 2...
pchutichetpong
 

Recently uploaded (20)

一比一原版(UMich毕业证)密歇根大学|安娜堡分校毕业证成绩单
一比一原版(UMich毕业证)密歇根大学|安娜堡分校毕业证成绩单一比一原版(UMich毕业证)密歇根大学|安娜堡分校毕业证成绩单
一比一原版(UMich毕业证)密歇根大学|安娜堡分校毕业证成绩单
 
standardisation of garbhpala offhgfffghh
standardisation of garbhpala offhgfffghhstandardisation of garbhpala offhgfffghh
standardisation of garbhpala offhgfffghh
 
Malana- Gimlet Market Analysis (Portfolio 2)
Malana- Gimlet Market Analysis (Portfolio 2)Malana- Gimlet Market Analysis (Portfolio 2)
Malana- Gimlet Market Analysis (Portfolio 2)
 
一比一原版(UPenn毕业证)宾夕法尼亚大学毕业证成绩单
一比一原版(UPenn毕业证)宾夕法尼亚大学毕业证成绩单一比一原版(UPenn毕业证)宾夕法尼亚大学毕业证成绩单
一比一原版(UPenn毕业证)宾夕法尼亚大学毕业证成绩单
 
一比一原版(CU毕业证)卡尔顿大学毕业证成绩单
一比一原版(CU毕业证)卡尔顿大学毕业证成绩单一比一原版(CU毕业证)卡尔顿大学毕业证成绩单
一比一原版(CU毕业证)卡尔顿大学毕业证成绩单
 
Opendatabay - Open Data Marketplace.pptx
Opendatabay - Open Data Marketplace.pptxOpendatabay - Open Data Marketplace.pptx
Opendatabay - Open Data Marketplace.pptx
 
一比一原版(NYU毕业证)纽约大学毕业证成绩单
一比一原版(NYU毕业证)纽约大学毕业证成绩单一比一原版(NYU毕业证)纽约大学毕业证成绩单
一比一原版(NYU毕业证)纽约大学毕业证成绩单
 
Adjusting primitives for graph : SHORT REPORT / NOTES
Adjusting primitives for graph : SHORT REPORT / NOTESAdjusting primitives for graph : SHORT REPORT / NOTES
Adjusting primitives for graph : SHORT REPORT / NOTES
 
一比一原版(CBU毕业证)卡普顿大学毕业证成绩单
一比一原版(CBU毕业证)卡普顿大学毕业证成绩单一比一原版(CBU毕业证)卡普顿大学毕业证成绩单
一比一原版(CBU毕业证)卡普顿大学毕业证成绩单
 
Levelwise PageRank with Loop-Based Dead End Handling Strategy : SHORT REPORT ...
Levelwise PageRank with Loop-Based Dead End Handling Strategy : SHORT REPORT ...Levelwise PageRank with Loop-Based Dead End Handling Strategy : SHORT REPORT ...
Levelwise PageRank with Loop-Based Dead End Handling Strategy : SHORT REPORT ...
 
社内勉強会資料_LLM Agents                              .
社内勉強会資料_LLM Agents                              .社内勉強会資料_LLM Agents                              .
社内勉強会資料_LLM Agents                              .
 
一比一原版(Bradford毕业证书)布拉德福德大学毕业证如何办理
一比一原版(Bradford毕业证书)布拉德福德大学毕业证如何办理一比一原版(Bradford毕业证书)布拉德福德大学毕业证如何办理
一比一原版(Bradford毕业证书)布拉德福德大学毕业证如何办理
 
一比一原版(UIUC毕业证)伊利诺伊大学|厄巴纳-香槟分校毕业证如何办理
一比一原版(UIUC毕业证)伊利诺伊大学|厄巴纳-香槟分校毕业证如何办理一比一原版(UIUC毕业证)伊利诺伊大学|厄巴纳-香槟分校毕业证如何办理
一比一原版(UIUC毕业证)伊利诺伊大学|厄巴纳-香槟分校毕业证如何办理
 
一比一原版(Adelaide毕业证书)阿德莱德大学毕业证如何办理
一比一原版(Adelaide毕业证书)阿德莱德大学毕业证如何办理一比一原版(Adelaide毕业证书)阿德莱德大学毕业证如何办理
一比一原版(Adelaide毕业证书)阿德莱德大学毕业证如何办理
 
FP Growth Algorithm and its Applications
FP Growth Algorithm and its ApplicationsFP Growth Algorithm and its Applications
FP Growth Algorithm and its Applications
 
一比一原版(UVic毕业证)维多利亚大学毕业证成绩单
一比一原版(UVic毕业证)维多利亚大学毕业证成绩单一比一原版(UVic毕业证)维多利亚大学毕业证成绩单
一比一原版(UVic毕业证)维多利亚大学毕业证成绩单
 
一比一原版(QU毕业证)皇后大学毕业证成绩单
一比一原版(QU毕业证)皇后大学毕业证成绩单一比一原版(QU毕业证)皇后大学毕业证成绩单
一比一原版(QU毕业证)皇后大学毕业证成绩单
 
一比一原版(YU毕业证)约克大学毕业证成绩单
一比一原版(YU毕业证)约克大学毕业证成绩单一比一原版(YU毕业证)约克大学毕业证成绩单
一比一原版(YU毕业证)约克大学毕业证成绩单
 
SOCRadar Germany 2024 Threat Landscape Report
SOCRadar Germany 2024 Threat Landscape ReportSOCRadar Germany 2024 Threat Landscape Report
SOCRadar Germany 2024 Threat Landscape Report
 
Data Centers - Striving Within A Narrow Range - Research Report - MCG - May 2...
Data Centers - Striving Within A Narrow Range - Research Report - MCG - May 2...Data Centers - Striving Within A Narrow Range - Research Report - MCG - May 2...
Data Centers - Striving Within A Narrow Range - Research Report - MCG - May 2...
 

Determination and Analysis of Sample size

  • 1. This Presentation is on Determination and Analysis of Sample size by observing and using sample with appropriate sampling scheme Submitted By Sudipto Krishna Dutta ID: 20204021 Section: A, Batch: 04 Course Title: Sampling Methodology (PM-ASDS02)
  • 2. Sampling Frame, Population Data and Survey Questions  Total Population = 50 Students  Sampling Units = Students Given Survey Questions Demographic Information Gender Age Marital Status Weight Residence Division of Present Residence Location of Present Residence Socio Economic Information Current Occupation Amount of money spent yesterday Behavioral Information Do you smoke? Do you use Facebook? Do you watch Bangladeshi TV channels? Do you read newspaper? Do you read story books? Do you like cricket? Do you like football?
  • 3. Sampling Methodology and Sample Size Determination • Stratifies Sampling : Stratified Sampling method is selected for greater precision and to ensure representation of small sub groups. Also proportional allocation technique is used to allocate sample size to different starta. • Stratum : (1) Male (2) Female Allocating sample size to strata • Population Size : N = 50 • Desired Sample Size : n = 44 Here, I used simple random sampling technique with considering 5% level of significance and the desired precision is 0.05 and “P” & “Q” are unknown Sl. # (i) Stratum Ni Wi = Ni/N ni 1 Male 33 0.66 29 2 Female 17 0.34 15 Total 50 1.00 44
  • 4. Tabular Representation of Sampling Data Table 1 : Frequency distribution on Residence of 29 Male stratum. Table 2 : Frequency distribution on Residence of 15 Female stratum.
  • 5. Graphical Representation of Sampling Data Figure 1 :Bar Graph representing the residence of male stratum. Figure 2 :Bar Graph representing the residence of female stratum.
  • 6. Graphical Representation of Sampling Data Figure 3 : Pie Chart representing the residence of male stratum Figure 4 :Bar Graph representing the residence of female stratum.
  • 7. Descriptive Summery Statistics on Demographic Information Male Female Mean 27.6 26.5 Standard Error 0.94 0.88 Median 25 25 Mode 25 25 Standard Deviation 5.07 3.40 Sample Variance 25.68 11.55 Kurtosis 1.17 0.68 Skewness 1.52 1.55 Range 18 9 Minimum 23 24 Maximum 41 26.5 Table 3 : Summary Statistics on Age of 29 male and 15 female stratum. 31% 7% 62% Currently Married Others Never Married Figure 5 : Pie Chart representing the marital status of male stratum.
  • 8. Descriptive Summery Statistics on Demographic Information Male Female Mean 75.2 54.9 Standard Error 2.51 2.42 Median 73 50 Mode 65 45 Standard Deviation 13.50 9.36 Sample Variance 182.24 87.55 Kurtosis -1.39 -1.71 Skewness 0.18 0.26 Range 40 23 Minimum 56 45 Maximum 96 68 Table 4 : Summary Statistics on weight of 29 male and 15 female stratum. 40% 20% 40% Currently Married Others Never Married Figure 6: Pie Chart representing the maritial status of female stratum .
  • 9. Descriptive Summery Statistics on Socio Economic Male Female Mean 758.1 1253.3 Standard Error 159.6 295.7 Median 300 500 Mode 200 2800 Standard Deviation 859.4 1145.1 Sample Variance 738595.2 1311238 Kurtosis 2.0 -1.7 Skewness 1.6 0.39 Range 3350 2800 Minimum 50 0 Maximum 3400 2800 Table 5 : Summary Statistics on amount of money yesterday of male and female stratum.
  • 10. Descriptive Summery Statistics on Socio Economic 0 5 10 15 Business Service Student Others Male Male 0 5 10 Service Students Female Female Figure 7 : Bar Graph representing the occupation of male stratum. Figure 8: Bar Graph representing the occupation of male stratum. Explanation: • In the table 5, male and female spent the mean amount of money yesterday are 758 and 1253 respectively, which indicates female used to spend more money than male, through the variability among the data are very high and distribution are not normal. •In the figure 7 and 8, male and female are mostly engaged in “Service” and “Student”. Though, female presence in business and others occupation is zero.
  • 11. Behavioral Information Analysis 0.00% 2.00% 4.00% 6.00% 8.00% 10.00% 12.00% 14.00% 16.00% 18.00% 20.00% Male Female 15.89% 0.00% 12.70% 18.60% Yes No Figure 9: Bar Graph representing the smoking frequency of male and female stratum. Explanation: In this figure 9 male respondent smoke whereas 0.0% female smoke, hence we can infer that, usually make do smoke and almost all the female restrain themselves from smoking .
  • 12. Behavioral Information Analysis 17% 83% Male Yes No 13% 87% Female Yes No Figure 10 : Pie Chart representing the Facebook usage ratio among male and female stratum. Explanation: • In the figure 10 the ratio using Facebook among the male and female stratum are in 83% and 87% respectively. Hence, we can say that, the more number female use Facebook, in compared to the male.
  • 13. Behavioral Information Analysis 0 10 20 30 40 Yes No Figure 11 : Bar Graph representing the Bangladeshi TV channel watching frequency of male stratum, female stratum and combined. Watching Bangladeshi TV Channels 0 10 20 30 Yes No Reading Newspaper Figure 12 : Bar Graph representing the newspaper reading frequency of male stratum, female stratum and combined. 0 10 20 30 Yes No Figure 13 : Bar Graph representing the story books reading frequency of male stratum, female stratum and combined. Reading Story Books Figure 11 : Only 12 respondents among 44 watch BD TV channel. The ratio is almost similar for male and female. So, watching BD TV channels are quite low. Figure 12 : 29 respondents among 44 read newspaper. Though the frequency of reading newspaper among female is much higher than the male. Figure 13 : 23 respondents among 44 read story books, though the frequency of reading newspaper among female is much higher than the male and the female read story books more than the male.
  • 14. Behavioral Information Analysis 0 10 20 30 Male Female Combined Yes No Football Lovers Figure 14: Bar Graph representation the football lovers among male stratum, female stratum and combined respondents. Explanation: In this figure 14 20 respondents like football among44, though in male stratum 16 respondents like football among 29, where only 4 female respondents like football among 15. Here we can diffrentiate that, male like football more than female. 70% 30% Male Yes No 73% 27% Female Yes No 75 % 25 % Combined Yes No Figure 15: Pie Chart representation the fan of cricket among male stratum, female stratum and combined. Explanation: In this figure 15% males and 75.6% female like cricket which are quite pretty to combined ratio of 70%. Here, we can differentiate that,70 % respondents like cricket and slightly more than male among the sample respondents. Cricket Lovers
  • 15. All this things concludes my presentation. Thank You!!