This document provides an overview of key concepts in statistics and probability covered in Chapter 4, including:
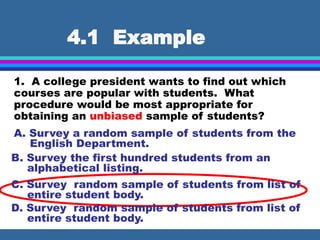
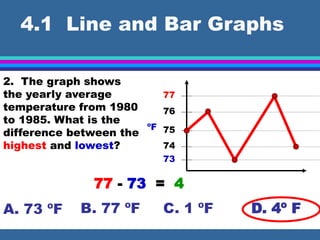
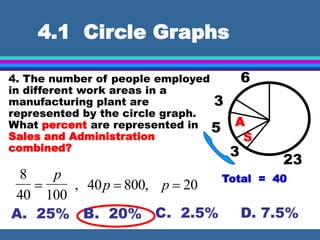
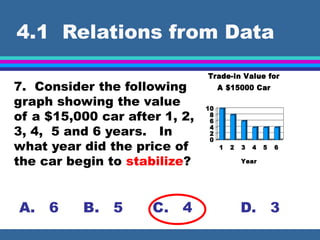
- Methods for obtaining unbiased samples and representing data in line, bar, and circle graphs.
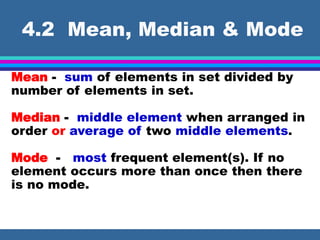
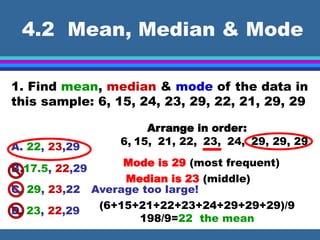
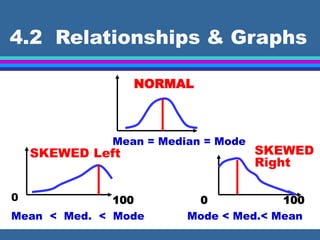
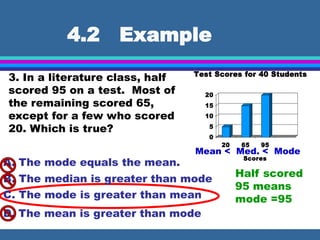
- Calculating the mean, median, and mode of data sets and understanding their relationships.
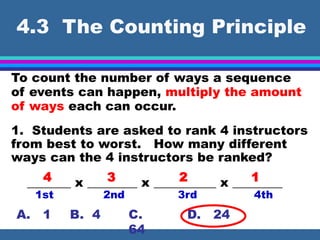
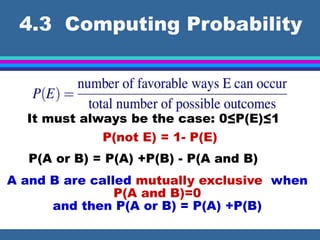
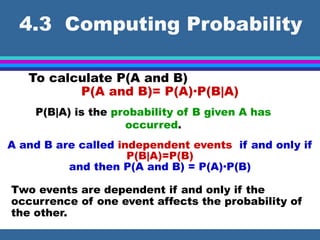
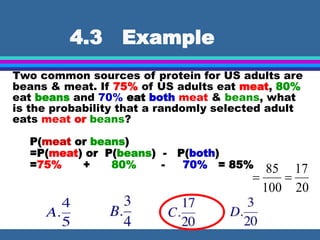
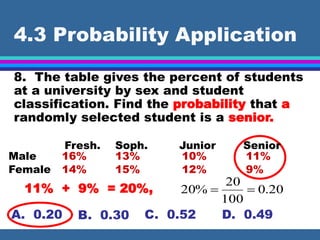
- Applying counting principles and calculating probabilities, including for independent vs. dependent events.
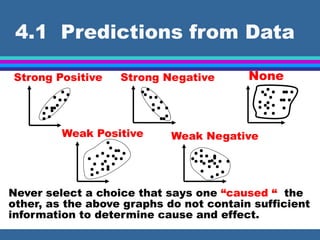
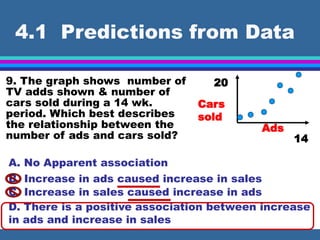
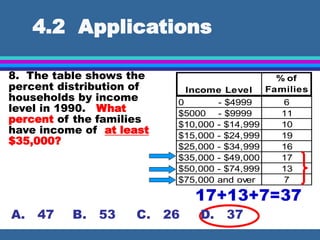
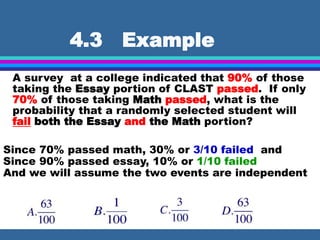
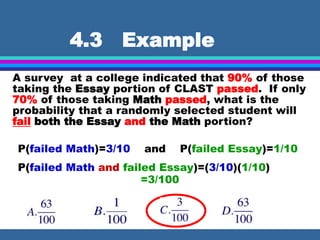
- Worked examples are provided to demonstrate computing probabilities and interpreting data distributions and relationships.