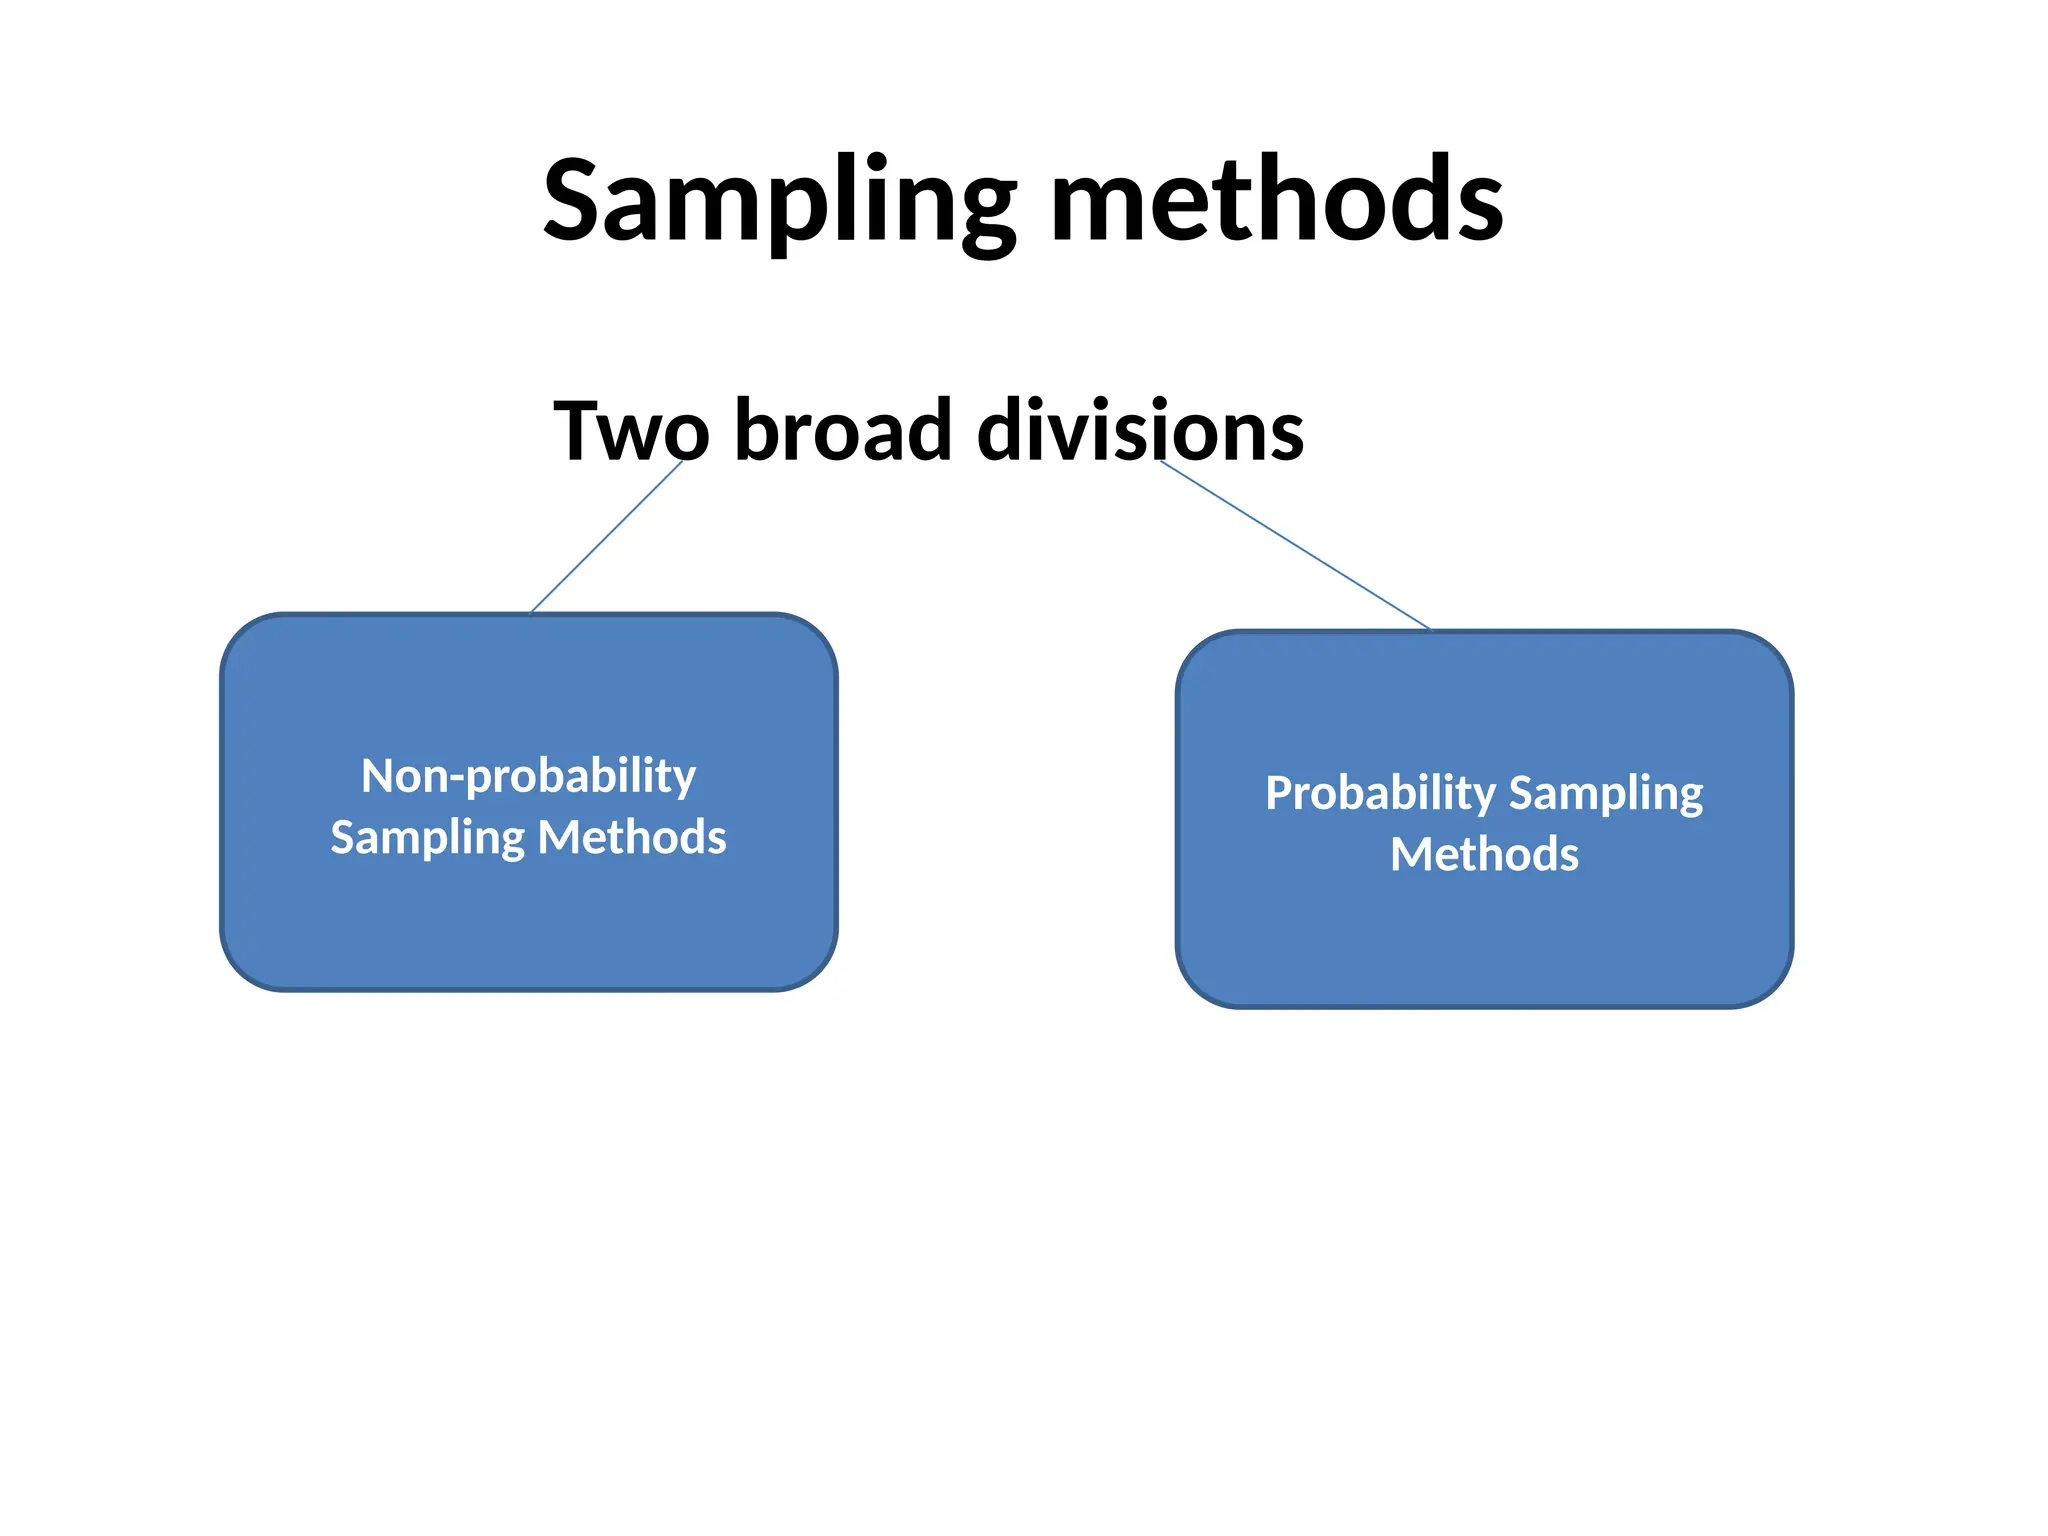
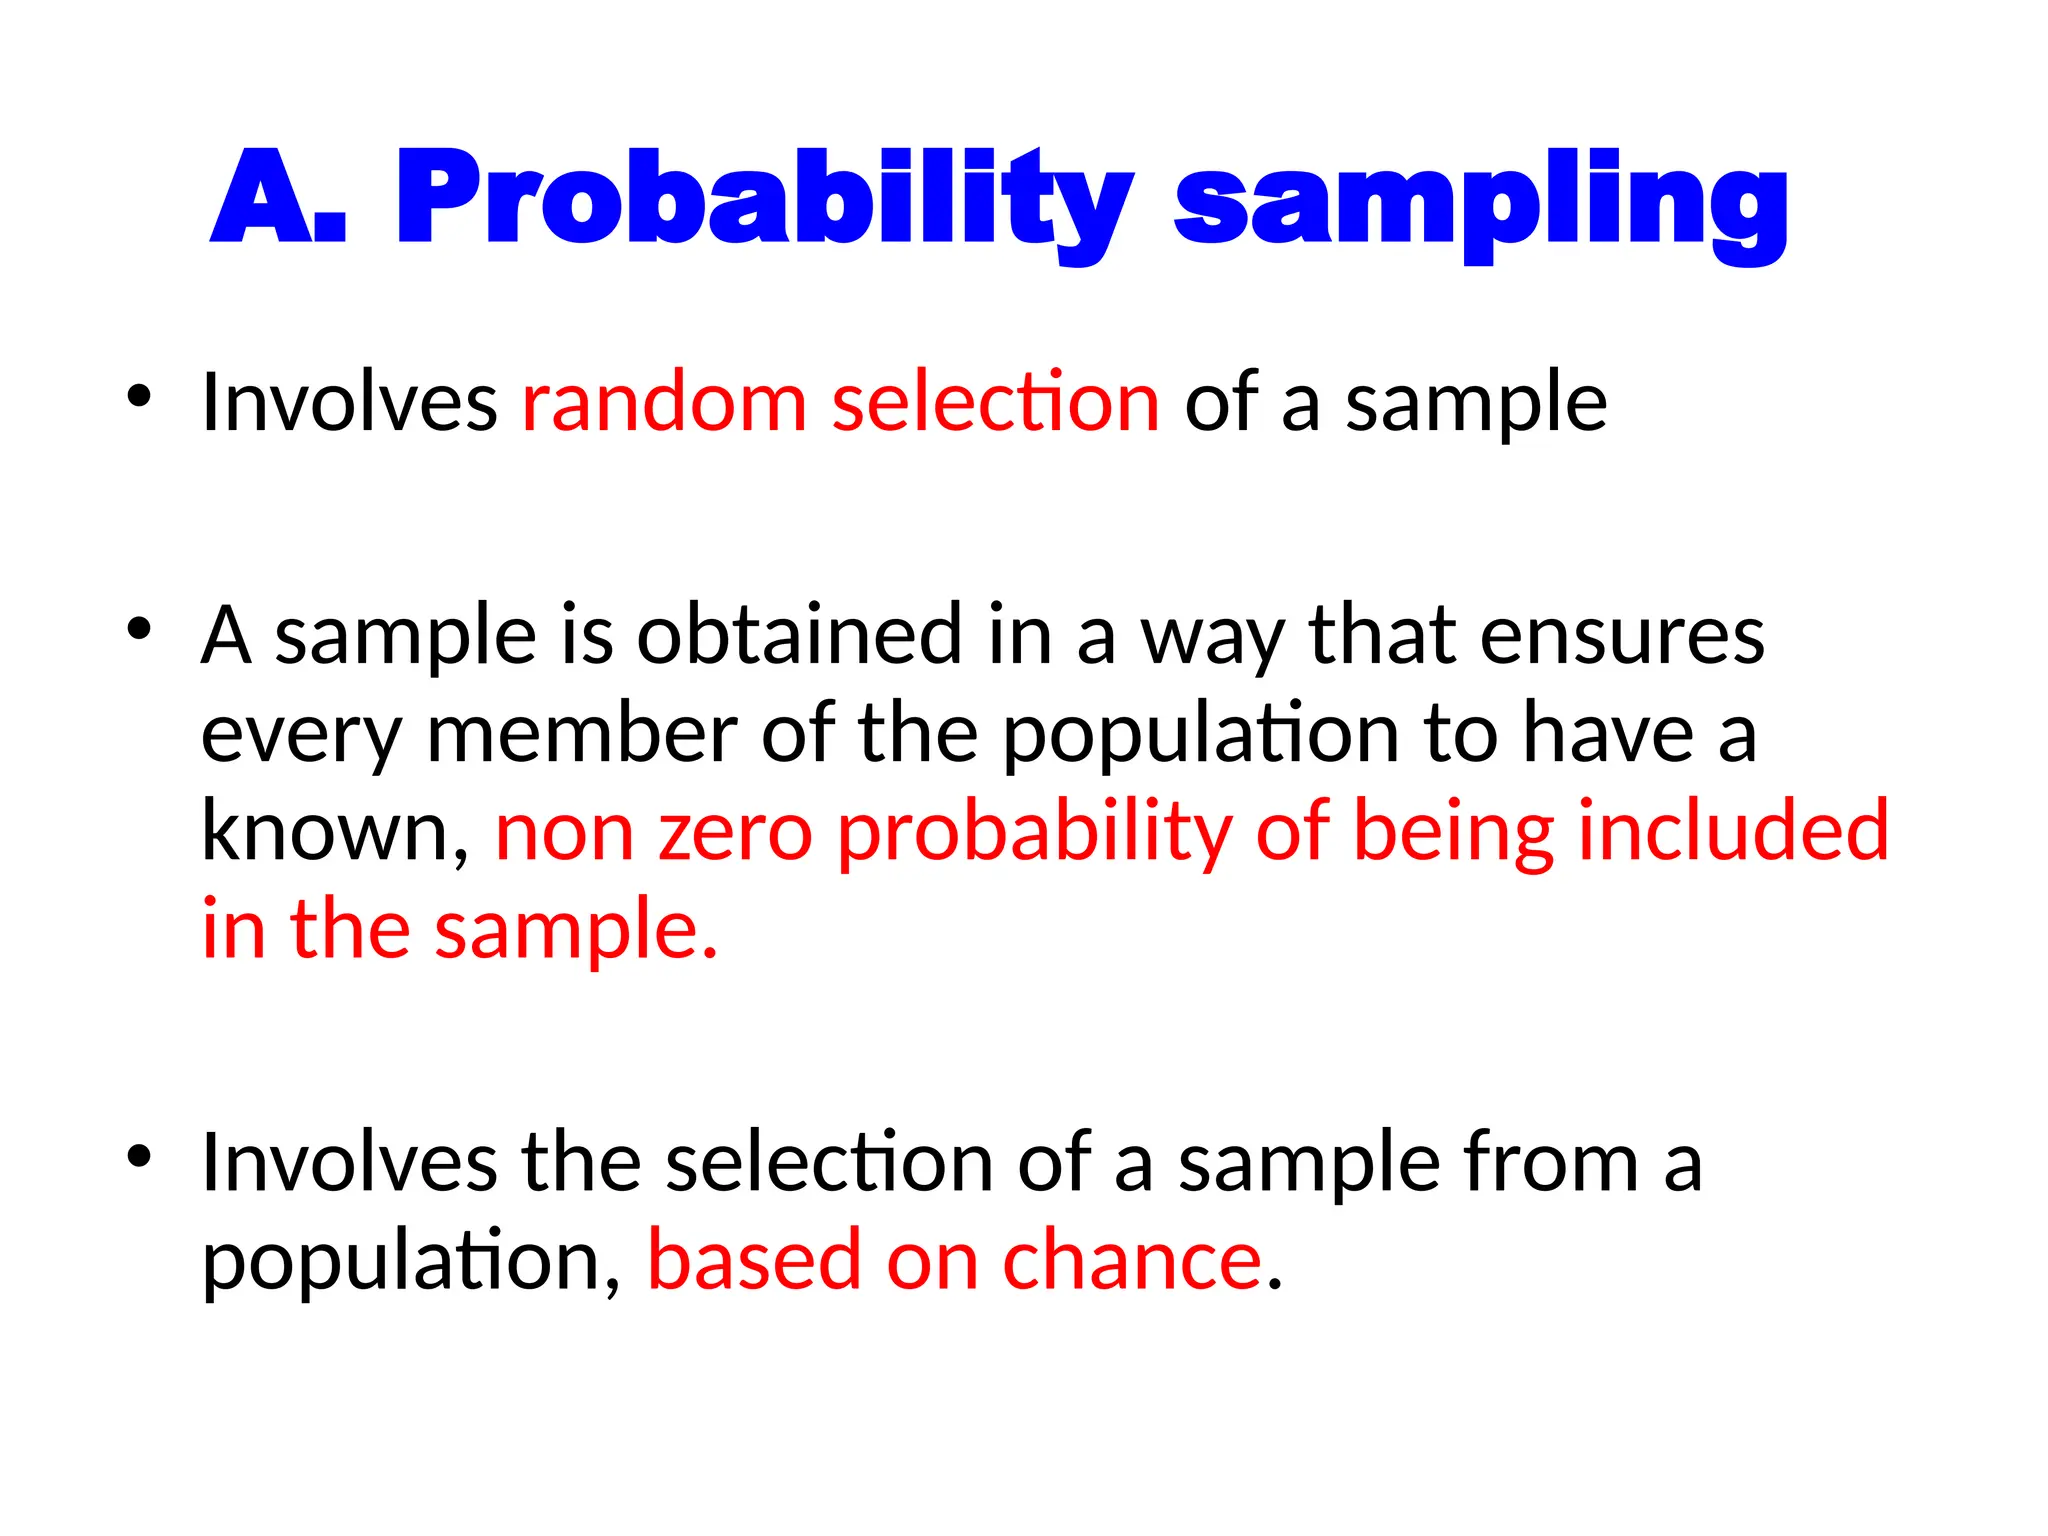
Introduction to Elementary
Sampling theory
Arafat I.(MPH)
Learning objective
1. Define population and sample and understand the different
sampling terminologies
2. Differentiate between probability and Non-Probability sampling
methods and apply different techniques of sampling
3. Understand the importance of a representative sample
4. Enumerate advantages and limitations of the different
sampling methods
5.Differentiate between random error and bias
• Researchers often use sample survey
methodology to obtain information about a
larger population by selecting and measuring
a sample from that population.
• Since population is too large, we rely on the
information collected from the sample.
INTRODUCTION
• Inferences about the population are based on
the information from the sample drawn from
that population.
• However, due to the variability in the
characteristics of the population, scientific
sample designs should be applied to select a
representative sample.
• If not, there is a high risk of distorting the view
of the population.
• A sample is a collection of individuals selected
from a larger population.
• For example, we may have a single sample
composed of 50 cases, representing a
population of 1000 individuals.
• Sampling enables us to estimate the
characteristic of a population by directly
observing a portion of the population.
• Researchers are not interested in the sample
itself, but in what can be learned from the
sample—and how this information can be
applied to the entire population.
Sample Information
Population
• Therefore, it is essential that a sample
should be correctly defined and organized.
• If the wrong questions are posed to the
wrong people, reliable information will not
be received and lead to a wrong conclusion
when applied to the entire population.
Advantages of sampling:
• Feasibility: Sampling may be the only feasible
method of collecting information.
• Reduced cost: Sampling reduces demands on
resource such as finance, personnel, and material.
• Greater accuracy: Sampling may lead to better
accuracy of collecting data
• Sampling error: Precise allowance can be made
for sampling error
• Greater speed: Data can be collected and
summarized more quickly
Disadvantages of sampling:
• There is always a sampling error.
• Sampling may create a feeling of
discrimination within the population.
• Sampling may be inadvisable where every
unit in the population is legally required to
have a record.
If we have to draw a sample, we will be confronted with the
following questions:
a) What is the group of people (population)
from which we want to draw a sample?
b) How many people do we need in our sample?
c) How will these people be selected?
N.B : Apart from persons, a population may consist of
mosquitoes,villages, institutions, etc.
Common terms used in sampling
Reference population (also called source
population or target population) –
• the population of interest, to which the
investigators would like to generalize the
results of the study, and from which a
representative sample is to be drawn.
Cont…
• Study or sample population - the population
included in the sample.
• Sampling unit - the unit of selection in the
sampling process
• Study unit - the unit on which information is
collected.
 if the objective is to determine the availability of
latrine, then the study unit would be the household;
 if the objective is to determine the prevalence of
trachoma, then the study unit would be the individual
Cont …
• Sampling frame - the list of all the units in the
reference population, from which a sample is
to be picked.
• Sampling fraction (Sampling interval) - the
ratio of the number of units in the sample to
the number of units in the reference
population (n/N).
Sampling methods
Two broad divisions
Non-probability
Sampling Methods
Probability Sampling
Methods
A. Probability sampling
• Involves random selection of a sample
• A sample is obtained in a way that ensures
every member of the population to have a
known, non zero probability of being included
in the sample.
• Involves the selection of a sample from a
population, based on chance.
• Probability sampling is:
– more complex,
– more time-consuming and
– usually more costly than non-probability
sampling.
• However, because study samples are
randomly selected and their probability of
inclusion can be calculated,
– reliable estimates can be produced and
– inferences can be made about the population.
• There are several different ways in which a
probability sample can be selected.
• The method chosen depends on a number of
factors, such as
– the available sampling frame,
– how spread out the population is,
– how costly it is to survey members of the
population
• When choosing a probability sample design,
– Our goal should be to minimize the sampling error of the
estimates for the most important survey variables,
– While simultaneously minimizing the time and cost of
conducting the survey.
Most common probability
sampling methods
1. Simple random sampling
2. Systematic random sampling
3. Sampling with probability proportional to size
4. Stratified random sampling
5. Cluster sampling
6. Multi-stage sampling
1. Simple random sampling
• Involves random selection
• Each member of a population has an equal
chance of being included in the sample.
• To use a SRS method:
– Make a numbered list of all the units in the
population
– Each unit should be numbered from 1 to N (where
N is the size of the population)
– decided the sample size
– Select the required number.
• The randomness of the sample is ensured
by:
• use of “lottery’ methods
• a table of random numbers
"Lottery” method: for a small population it may be
possible to use the “lottery” method: each unit in the
population is represented by a slip of paper, these are put
in a box and mixed, and a sample of the requiredsize is
drawn from the box.
Table of random numbers: if there are many units, however, the
above technique soon becomes laborious. Selection of the units is greatly
facilitated and made more accurate by using a set of random numbers in
which a large number of digits is set out in random order. The property of a
table of random numbers is that, whichever way it is read, vertically in
columns or horizontally in rows, the order of the digits is random. Nowadays,
any scientific calculator has the same facilities.
Example
• Suppose your school has 500 students and
you need to conduct a short survey on the
quality of the food served in the cafeteria.
• You decide that a sample of 10 students
should be sufficient for your purposes.
• In order to get your sample, you assign a
number from 1 to 500 to each student in
your school.
• To select the sample, you use a table of
randomly generated numbers.
• Pick a starting point in the table (a row and
column number) and look at the random
numbers that appear there. In this case, since
the data run into three digits, the random
numbers would need to contain three digits as
well.
• Ignore all random numbers after 500 because
they do not correspond to any of the students in
the school.
• Remember that the sample is without
replacement, so if a number recurs, skip over it
and use the next random number.
• The first 10 different numbers between 001 and
500 make up your sample.
• SRS has certain limitations:
– Requires a sampling frame.
– Difficult if the reference population is dispersed.
– Minority subgroups of interest may not be
selected.
2. Systematic random sampling
• Sometimes called interval sampling,
systematic sampling means that there is a gap,
or interval, between each selected unit in the
sample
• The selection is systematic rather than
randomly
• Important if the reference population is
arranged in some order:
– Order of registration of patients
– Numerical number of house numbers
– Student’s registration books
• Taking individuals at fixed intervals (every kth
)
based on the sampling fraction, eg. if the
sample includes 20%, then every fifth.
Steps in systematic random sampling
1. Number the units on your frame from 1 to N
(where N is the total population size).
2. Determine the sampling interval (K) by dividing the
number of units in the population by the desired
sample size.
3. Select a number between one and K at random.
This number is called the random start and would
be the first number included in your sample.
4. Select every Kth
unit after that first number
Note: Systematic sampling should not be used when
a cyclic repetition is inherent in the sampling
frame.
Example
• To select a sample of 100 from a population of
400, you would need a sampling interval of
400 ÷ 100 = 4.
• Therefore, K = 4.
• You will need to select one unit out of every
four units to end up with a total of 100 units in
your sample.
• Select a number between 1 and 4 from a table
of random numbers.
• If you choose 3, the third unit on your frame
would be the first unit included in your
sample;
• The sample might consist of the following
units to make up a sample of 100: 3 (the
random start), 7, 11, 15, 19...395, 399 (up to
N, which is 400 in this case).
• Using the above example, you can see that
with a systematic sample approach there are
only four possible samples that can be
selected, corresponding to the four possible
random starts:
A. 1, 5, 9, 13...393, 397
B. 2, 6, 10, 14...394, 398
C. 3, 7, 11, 15...395, 399
D. 4, 8, 12, 16...396, 400
• Each member of the population belongs to only one
of the four samples and each sample has the same
chance of being selected.
• The main difference with SRS, any combination of
100 units would have a chance of making up the
sample, while with systematic sampling, there are
only four possible samples.
3. Sampling with probability proportional to
size
• Probability sampling requires that each member of
the survey population has a chance of being included
in the sample, but it does not require that this chance
be the same for everyone.
• If information is available on the frame about
the size of each unit and if those units vary in
size, this information can be used in the
sampling selection in order to increase the
efficiency.
• This is known as sampling with probability
proportional to size (PPS).
• With this method, the bigger the size of the
unit, the higher the chance it has of being
included in the sample.
• For this method to achieve increased
efficiency, the measure of size needs to be
accurate.
Steps in PPS
• List all Kebeles/clusters with their population size
• Calculate the cumulative frequency
• Calculate the sampling interval by dividing the
total population size by the sample size, say K
• Randomly choose a number between 1 and K, say j
• Kebeles/clusters with cumulative frequency
contacting the jth
, (j+1)th
, ….(j+(k-1))th
will be
included in the sample
4. Stratified random sampling
• It is done when the population is known to be have
heterogeneity with regard to some factors and those
factors are used for stratification
• Using stratified sampling, the population is divided into
homogeneous, mutually exclusive groups called strata,
and
• A population can be stratified by any variable that is
available for all units prior to sampling (e.g., age, sex,
province of residence, income, etc.).
• A separate sample is taken independently
from each stratum.
• Any of the sampling methods mentioned in
this section (and others that exist) can be used
to sample within each stratum.
Why do we need to create strata?
• That it can make the sampling strategy more
efficient.
• A larger sample is required to get a more
accurate estimation if a characteristic varies
greatly from one unit to the other.
• For example, if every person in a population
had the same salary, then a sample of one
individual would be enough to get a precise
estimate of the average salary.
• This is the idea behind the efficiency gain
obtained with stratification.
– If you create strata within which units share
similar characteristics (e.g., income) and are
considerably different from units in other strata
(e.g., occupation, type of dwelling) then you
would only need a small sample from each
stratum to get a precise estimate of total
income for that stratum.
– Then you could combine these estimates to get a
precise estimate of total income for the whole
population.
• If you use a SRS approach in the whole
population without stratification, the sample
would need to be larger than the total of all
stratum samples to get an estimate of total
income with the same level of precision.
• Stratified sampling ensures an adequate
sample size for sub-groups in the population of
interest.
• When a population is stratified, each stratum
becomes an independent population and you
will need to decide the sample size for each
stratum.
• Equal allocation:
– Allocate equal sample size to each stratum
• Proportionate allocation:
, j = 1, 2, ..., k where, k is
the number of strata
and
– nj
is sample size of the jth
stratum
– Nj
is population size of the jth
stratum
– n = n1
+ n2
+ ...+ nk
is the total sample size
– N = N1
+ N2
+ ...+ Nk
is the total population
size
n
n
N
N
j j

5. Cluster sampling
• Sometimes it is too expensive to spread a sample
across the population as a whole.
• Travel costs can become expensive if interviewers
have to survey people from one end of the
country to the other.
• To reduce costs, researchers may choose a cluster
sampling technique
• The clusters should be homogeneous, unlike
stratified sampling where by the strata are
heterogeneous
Steps in cluster sampling
• Cluster sampling divides the population into groups
or clusters.
• A number of clusters are selected randomly to
represent the total population, and then all units
within selected clusters are included in the sample.
• No units from non-selected clusters are included in
the sample—they are represented by those from
selected clusters.
• This differs from stratified sampling, where some
units are selected from each group.
Example
• In a school based study, we assume students of
the same school are homogeneous.
• We can select randomly sections and include all
students of the selected sections only
• As mentioned, cost reduction is a reason for
using cluster sampling.
• It creates 'pockets' of sampled units instead of
spreading the sample over the whole territory.
• Another reason is that sometimes a list of all
units in the population is not available, while a
list of all clusters is either available or easy to
create.
• In most cases, the main drawback is a loss of
efficiency when compared with SRS.
• It is usually better to survey a large number of
small clusters instead of a small number of large
clusters.
– This is because neighboring units tend to be more
alike, resulting in a sample that does not represent
the whole spectrum of opinions or situations present
in the overall population.
• Another drawback to cluster sampling is that
you do not have total control over the final
sample size.
• Since not all schools have the same number of
(say Grade 11) students and city blocks do not
all have the same number of households, and
you must interview every student or household
in your sample, as an example, the final size may
be larger or smaller than you expected.
6. Multi-stage sampling
• Similar to the cluster sampling, except that it
involves picking a sample from within each
chosen cluster, rather than including all units
in the cluster.
• This type of sampling requires at least two
stages.
• In the first stage, large groups or clusters are
identified and selected. These clusters contain
more population units than are needed for the
final sample.
• In the second stage, population units are
picked from within the selected clusters (using
any of the possible probability sampling
methods) for a final sample.
• If more than two stages are used, the process of
choosing population units within clusters continues
until there is a final sample.
• With multi-stage sampling, you still have the benefit
of a more concentrated sample for cost reduction.
• However, the sample is not as concentrated as other
clusters and the sample size is still bigger than for a
simple random sample size.
• Also, you do not need to have a list of all of the
units in the population. All you need is a list of
clusters and list of the units in the selected
clusters.
• Admittedly, more information is needed in this
type of sample than what is required in cluster
sampling. However, multi-stage sampling still
saves a great amount of time and effort by not
having to create a list of all the units in a
population.
B. Non-probability sampling
• The difference between probability and non-
probability sampling has to do with a basic
assumption about the nature of the population under
study.
• In probability sampling, every item has a known
chance of being selected.
• In non-probability sampling, there is an assumption
that there is an even distribution of a characteristic of
interest within the population.
• This is what makes the researcher believe that
any sample would be representative and
because of that, results will be accurate.
• For probability sampling, random is a feature
of the selection process, rather than an
assumption about the structure of the
population.
• In non-probability sampling, since elements
are chosen arbitrarily, there is no way to
estimate the probability of any one element
being included in the sample.
• Also, no assurance is given that each item has
a chance of being included, making it
impossible either to estimate sampling
variability or to identify possible bias
• Reliability cannot be measured in non-probability
sampling; the only way to address data quality is to
compare some of the survey results with available
information about the population.
• Still, there is no assurance that the estimates will meet
an acceptable level of error.
• Researchers are reluctant (unwilling and hesitant)
to use these methods because there is no way to
measure the precision of the resulting sample.
• Despite these drawbacks, non-probability
sampling methods can be useful when
descriptive comments about the sample itself
are desired.
• Secondly, they are quick, inexpensive and
convenient.
• There are also other circumstances, such as
researches, when it is unfeasible or
impractical to conduct probability sampling.
The most common types of non-probability sampling
1. Convenience or haphazard sampling
2. Volunteer sampling
3. Judgment sampling
4. Quota sampling
5. Snowball sampling technique
Errors in sampling
• When we take a sample, our results will not
exactly equal the correct results for the whole
population. That is, our results will be subject
to errors
• two types errors in sampling
1. Sampling error (random error)
2. Non Sampling error (bias)

5 Introduction to elementary sampling theory.pptx

  • 1.
  • 2.
    Learning objective 1. Definepopulation and sample and understand the different sampling terminologies 2. Differentiate between probability and Non-Probability sampling methods and apply different techniques of sampling 3. Understand the importance of a representative sample 4. Enumerate advantages and limitations of the different sampling methods 5.Differentiate between random error and bias
  • 3.
    • Researchers oftenuse sample survey methodology to obtain information about a larger population by selecting and measuring a sample from that population. • Since population is too large, we rely on the information collected from the sample. INTRODUCTION
  • 4.
    • Inferences aboutthe population are based on the information from the sample drawn from that population.
  • 5.
    • However, dueto the variability in the characteristics of the population, scientific sample designs should be applied to select a representative sample. • If not, there is a high risk of distorting the view of the population.
  • 6.
    • A sampleis a collection of individuals selected from a larger population. • For example, we may have a single sample composed of 50 cases, representing a population of 1000 individuals.
  • 7.
    • Sampling enablesus to estimate the characteristic of a population by directly observing a portion of the population. • Researchers are not interested in the sample itself, but in what can be learned from the sample—and how this information can be applied to the entire population.
  • 8.
  • 9.
    • Therefore, itis essential that a sample should be correctly defined and organized. • If the wrong questions are posed to the wrong people, reliable information will not be received and lead to a wrong conclusion when applied to the entire population.
  • 10.
    Advantages of sampling: •Feasibility: Sampling may be the only feasible method of collecting information. • Reduced cost: Sampling reduces demands on resource such as finance, personnel, and material. • Greater accuracy: Sampling may lead to better accuracy of collecting data • Sampling error: Precise allowance can be made for sampling error • Greater speed: Data can be collected and summarized more quickly
  • 11.
    Disadvantages of sampling: •There is always a sampling error. • Sampling may create a feeling of discrimination within the population. • Sampling may be inadvisable where every unit in the population is legally required to have a record.
  • 12.
    If we haveto draw a sample, we will be confronted with the following questions: a) What is the group of people (population) from which we want to draw a sample? b) How many people do we need in our sample? c) How will these people be selected? N.B : Apart from persons, a population may consist of mosquitoes,villages, institutions, etc.
  • 13.
    Common terms usedin sampling Reference population (also called source population or target population) – • the population of interest, to which the investigators would like to generalize the results of the study, and from which a representative sample is to be drawn.
  • 14.
    Cont… • Study orsample population - the population included in the sample. • Sampling unit - the unit of selection in the sampling process • Study unit - the unit on which information is collected.  if the objective is to determine the availability of latrine, then the study unit would be the household;  if the objective is to determine the prevalence of trachoma, then the study unit would be the individual
  • 15.
    Cont … • Samplingframe - the list of all the units in the reference population, from which a sample is to be picked. • Sampling fraction (Sampling interval) - the ratio of the number of units in the sample to the number of units in the reference population (n/N).
  • 16.
    Sampling methods Two broaddivisions Non-probability Sampling Methods Probability Sampling Methods
  • 17.
    A. Probability sampling •Involves random selection of a sample • A sample is obtained in a way that ensures every member of the population to have a known, non zero probability of being included in the sample. • Involves the selection of a sample from a population, based on chance.
  • 18.
    • Probability samplingis: – more complex, – more time-consuming and – usually more costly than non-probability sampling. • However, because study samples are randomly selected and their probability of inclusion can be calculated, – reliable estimates can be produced and – inferences can be made about the population.
  • 19.
    • There areseveral different ways in which a probability sample can be selected. • The method chosen depends on a number of factors, such as – the available sampling frame, – how spread out the population is, – how costly it is to survey members of the population
  • 20.
    • When choosinga probability sample design, – Our goal should be to minimize the sampling error of the estimates for the most important survey variables, – While simultaneously minimizing the time and cost of conducting the survey.
  • 21.
    Most common probability samplingmethods 1. Simple random sampling 2. Systematic random sampling 3. Sampling with probability proportional to size 4. Stratified random sampling 5. Cluster sampling 6. Multi-stage sampling
  • 22.
    1. Simple randomsampling • Involves random selection • Each member of a population has an equal chance of being included in the sample.
  • 23.
    • To usea SRS method: – Make a numbered list of all the units in the population – Each unit should be numbered from 1 to N (where N is the size of the population) – decided the sample size – Select the required number.
  • 24.
    • The randomnessof the sample is ensured by: • use of “lottery’ methods • a table of random numbers
  • 25.
    "Lottery” method: fora small population it may be possible to use the “lottery” method: each unit in the population is represented by a slip of paper, these are put in a box and mixed, and a sample of the requiredsize is drawn from the box. Table of random numbers: if there are many units, however, the above technique soon becomes laborious. Selection of the units is greatly facilitated and made more accurate by using a set of random numbers in which a large number of digits is set out in random order. The property of a table of random numbers is that, whichever way it is read, vertically in columns or horizontally in rows, the order of the digits is random. Nowadays, any scientific calculator has the same facilities.
  • 26.
    Example • Suppose yourschool has 500 students and you need to conduct a short survey on the quality of the food served in the cafeteria. • You decide that a sample of 10 students should be sufficient for your purposes. • In order to get your sample, you assign a number from 1 to 500 to each student in your school.
  • 27.
    • To selectthe sample, you use a table of randomly generated numbers. • Pick a starting point in the table (a row and column number) and look at the random numbers that appear there. In this case, since the data run into three digits, the random numbers would need to contain three digits as well.
  • 28.
    • Ignore allrandom numbers after 500 because they do not correspond to any of the students in the school. • Remember that the sample is without replacement, so if a number recurs, skip over it and use the next random number. • The first 10 different numbers between 001 and 500 make up your sample.
  • 29.
    • SRS hascertain limitations: – Requires a sampling frame. – Difficult if the reference population is dispersed. – Minority subgroups of interest may not be selected.
  • 30.
    2. Systematic randomsampling • Sometimes called interval sampling, systematic sampling means that there is a gap, or interval, between each selected unit in the sample • The selection is systematic rather than randomly
  • 31.
    • Important ifthe reference population is arranged in some order: – Order of registration of patients – Numerical number of house numbers – Student’s registration books • Taking individuals at fixed intervals (every kth ) based on the sampling fraction, eg. if the sample includes 20%, then every fifth.
  • 32.
    Steps in systematicrandom sampling 1. Number the units on your frame from 1 to N (where N is the total population size). 2. Determine the sampling interval (K) by dividing the number of units in the population by the desired sample size.
  • 33.
    3. Select anumber between one and K at random. This number is called the random start and would be the first number included in your sample. 4. Select every Kth unit after that first number Note: Systematic sampling should not be used when a cyclic repetition is inherent in the sampling frame.
  • 34.
    Example • To selecta sample of 100 from a population of 400, you would need a sampling interval of 400 ÷ 100 = 4. • Therefore, K = 4. • You will need to select one unit out of every four units to end up with a total of 100 units in your sample. • Select a number between 1 and 4 from a table of random numbers.
  • 35.
    • If youchoose 3, the third unit on your frame would be the first unit included in your sample; • The sample might consist of the following units to make up a sample of 100: 3 (the random start), 7, 11, 15, 19...395, 399 (up to N, which is 400 in this case).
  • 36.
    • Using theabove example, you can see that with a systematic sample approach there are only four possible samples that can be selected, corresponding to the four possible random starts: A. 1, 5, 9, 13...393, 397 B. 2, 6, 10, 14...394, 398 C. 3, 7, 11, 15...395, 399 D. 4, 8, 12, 16...396, 400
  • 37.
    • Each memberof the population belongs to only one of the four samples and each sample has the same chance of being selected. • The main difference with SRS, any combination of 100 units would have a chance of making up the sample, while with systematic sampling, there are only four possible samples.
  • 38.
    3. Sampling withprobability proportional to size • Probability sampling requires that each member of the survey population has a chance of being included in the sample, but it does not require that this chance be the same for everyone.
  • 39.
    • If informationis available on the frame about the size of each unit and if those units vary in size, this information can be used in the sampling selection in order to increase the efficiency. • This is known as sampling with probability proportional to size (PPS).
  • 40.
    • With thismethod, the bigger the size of the unit, the higher the chance it has of being included in the sample. • For this method to achieve increased efficiency, the measure of size needs to be accurate.
  • 41.
    Steps in PPS •List all Kebeles/clusters with their population size • Calculate the cumulative frequency • Calculate the sampling interval by dividing the total population size by the sample size, say K • Randomly choose a number between 1 and K, say j • Kebeles/clusters with cumulative frequency contacting the jth , (j+1)th , ….(j+(k-1))th will be included in the sample
  • 42.
    4. Stratified randomsampling • It is done when the population is known to be have heterogeneity with regard to some factors and those factors are used for stratification • Using stratified sampling, the population is divided into homogeneous, mutually exclusive groups called strata, and • A population can be stratified by any variable that is available for all units prior to sampling (e.g., age, sex, province of residence, income, etc.).
  • 43.
    • A separatesample is taken independently from each stratum. • Any of the sampling methods mentioned in this section (and others that exist) can be used to sample within each stratum.
  • 44.
    Why do weneed to create strata? • That it can make the sampling strategy more efficient. • A larger sample is required to get a more accurate estimation if a characteristic varies greatly from one unit to the other. • For example, if every person in a population had the same salary, then a sample of one individual would be enough to get a precise estimate of the average salary.
  • 45.
    • This isthe idea behind the efficiency gain obtained with stratification. – If you create strata within which units share similar characteristics (e.g., income) and are considerably different from units in other strata (e.g., occupation, type of dwelling) then you would only need a small sample from each stratum to get a precise estimate of total income for that stratum.
  • 46.
    – Then youcould combine these estimates to get a precise estimate of total income for the whole population. • If you use a SRS approach in the whole population without stratification, the sample would need to be larger than the total of all stratum samples to get an estimate of total income with the same level of precision.
  • 47.
    • Stratified samplingensures an adequate sample size for sub-groups in the population of interest. • When a population is stratified, each stratum becomes an independent population and you will need to decide the sample size for each stratum.
  • 48.
    • Equal allocation: –Allocate equal sample size to each stratum • Proportionate allocation: , j = 1, 2, ..., k where, k is the number of strata and – nj is sample size of the jth stratum – Nj is population size of the jth stratum – n = n1 + n2 + ...+ nk is the total sample size – N = N1 + N2 + ...+ Nk is the total population size n n N N j j 
  • 49.
    5. Cluster sampling •Sometimes it is too expensive to spread a sample across the population as a whole. • Travel costs can become expensive if interviewers have to survey people from one end of the country to the other. • To reduce costs, researchers may choose a cluster sampling technique • The clusters should be homogeneous, unlike stratified sampling where by the strata are heterogeneous
  • 50.
    Steps in clustersampling • Cluster sampling divides the population into groups or clusters. • A number of clusters are selected randomly to represent the total population, and then all units within selected clusters are included in the sample. • No units from non-selected clusters are included in the sample—they are represented by those from selected clusters. • This differs from stratified sampling, where some units are selected from each group.
  • 51.
    Example • In aschool based study, we assume students of the same school are homogeneous. • We can select randomly sections and include all students of the selected sections only
  • 52.
    • As mentioned,cost reduction is a reason for using cluster sampling. • It creates 'pockets' of sampled units instead of spreading the sample over the whole territory. • Another reason is that sometimes a list of all units in the population is not available, while a list of all clusters is either available or easy to create.
  • 53.
    • In mostcases, the main drawback is a loss of efficiency when compared with SRS. • It is usually better to survey a large number of small clusters instead of a small number of large clusters. – This is because neighboring units tend to be more alike, resulting in a sample that does not represent the whole spectrum of opinions or situations present in the overall population.
  • 54.
    • Another drawbackto cluster sampling is that you do not have total control over the final sample size. • Since not all schools have the same number of (say Grade 11) students and city blocks do not all have the same number of households, and you must interview every student or household in your sample, as an example, the final size may be larger or smaller than you expected.
  • 55.
    6. Multi-stage sampling •Similar to the cluster sampling, except that it involves picking a sample from within each chosen cluster, rather than including all units in the cluster. • This type of sampling requires at least two stages.
  • 56.
    • In thefirst stage, large groups or clusters are identified and selected. These clusters contain more population units than are needed for the final sample. • In the second stage, population units are picked from within the selected clusters (using any of the possible probability sampling methods) for a final sample.
  • 57.
    • If morethan two stages are used, the process of choosing population units within clusters continues until there is a final sample. • With multi-stage sampling, you still have the benefit of a more concentrated sample for cost reduction. • However, the sample is not as concentrated as other clusters and the sample size is still bigger than for a simple random sample size.
  • 58.
    • Also, youdo not need to have a list of all of the units in the population. All you need is a list of clusters and list of the units in the selected clusters. • Admittedly, more information is needed in this type of sample than what is required in cluster sampling. However, multi-stage sampling still saves a great amount of time and effort by not having to create a list of all the units in a population.
  • 59.
    B. Non-probability sampling •The difference between probability and non- probability sampling has to do with a basic assumption about the nature of the population under study. • In probability sampling, every item has a known chance of being selected. • In non-probability sampling, there is an assumption that there is an even distribution of a characteristic of interest within the population.
  • 60.
    • This iswhat makes the researcher believe that any sample would be representative and because of that, results will be accurate. • For probability sampling, random is a feature of the selection process, rather than an assumption about the structure of the population.
  • 61.
    • In non-probabilitysampling, since elements are chosen arbitrarily, there is no way to estimate the probability of any one element being included in the sample. • Also, no assurance is given that each item has a chance of being included, making it impossible either to estimate sampling variability or to identify possible bias
  • 62.
    • Reliability cannotbe measured in non-probability sampling; the only way to address data quality is to compare some of the survey results with available information about the population. • Still, there is no assurance that the estimates will meet an acceptable level of error. • Researchers are reluctant (unwilling and hesitant) to use these methods because there is no way to measure the precision of the resulting sample.
  • 63.
    • Despite thesedrawbacks, non-probability sampling methods can be useful when descriptive comments about the sample itself are desired. • Secondly, they are quick, inexpensive and convenient. • There are also other circumstances, such as researches, when it is unfeasible or impractical to conduct probability sampling.
  • 64.
    The most commontypes of non-probability sampling 1. Convenience or haphazard sampling 2. Volunteer sampling 3. Judgment sampling 4. Quota sampling 5. Snowball sampling technique
  • 65.
    Errors in sampling •When we take a sample, our results will not exactly equal the correct results for the whole population. That is, our results will be subject to errors • two types errors in sampling 1. Sampling error (random error) 2. Non Sampling error (bias)