Sample presentation slides template
•
0 likes•242 views

This document provides instructions for creating polished presentations in LaTeX. It covers topics like inserting tables, figures, and subfiles; displaying mathematics; including code listings; and adding references. The document contains examples of tables, figures, equations, algorithms, and other elements to demonstrate LaTeX features for technical presentations. It concludes by noting that the theme source code and a demo presentation are available on GitHub under a Creative Commons license.

Recommended
More Related Content
What's hot
What's hot (19)
Similar to Sample presentation slides template
Similar to Sample presentation slides template (20)
More from Valerii Klymchuk
More from Valerii Klymchuk (14)
Recently uploaded
Recently uploaded (20)
Sample presentation slides template
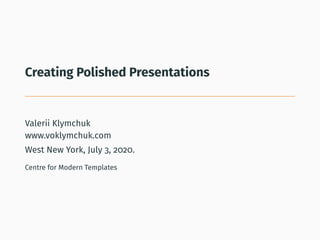
- 1. Creating Polished Presentations Valerii Klymchuk www.voklymchuk.com West New York, July 3, 2020. Centre for Modern Templates
- 2. Outline i Introduction Tables, figures and subfiles Tables and Figures Cross-references Sub section through input command Displaying Mathematics Inline Mode Display Mode Code Listings and Using Symbols Conclusion 1
- 3. Thanks for your attention. Pay attention here... 1
- 4. Introduction
- 5. This is going to be a normal paragraph in our introduction. Some intro stuff Observation This is a very important piece of information. Some other stuff ... 2
- 6. Blocks Three different block environments are pre-defined and may be styled with an optional background color. Default Block content. Alert Block content. Example Block content. Default Block content. Alert Block content. Example Block content. 3
- 7. Tables, figures and subfiles
- 8. To insert a figure, you can use the TeXnicecenter menus. SP SR VS SP SR VS SP SR VS a) Pushed Validation b) Pulled Validation c) Delegated Validation 1 23 4 1 2 34 14 32 Figure 1: My First Figure 4
- 9. Tikspictures h1 h2 h3 x1 x2 x3 Figure 2: M1 5
- 10. Multipage Xtabular table i Table 1: Sample multipage table with repeating header document class bibliography style Institute of Electrical and Electronics Engineers IEEEtran IEEEtran 6
- 11. Multipage Xtabular table ii Table 1 continued document class bibliography style Association for Computing Ma- chinery sig-alternate plain Lecture Notes in Computer Science llncs lllncs 7
- 12. Multipage Xtabular table iii Table 1 continued document class bibliography style General article plain 8
- 13. Gant charts 2020 2021 2022 3 4 5 6 7 8 9 10 11 12 1 2 3 4 5 6 7 8 9 10 11 12 1 2 Proposal Defense Background Study Android Security Code Analysis Policy Mechanisms Literature Review Complete Formal Specification Spec Document Thesis and Paper Writing Figure 3: My First Gantt 9
- 14. Some text here that wants to refer to Table 1. You can also refer to the Figure 1. When you want to refer to a previous section, you can use the ref command again. Section 2. This comes from a separate file. Notice that we have this subsection included in the Navigator. 10
- 15. Algorithms Algorithm 1 My First Simple Algorithm Require: Randomly populated array Ensure: Sorted array if i ≤ 0 then 2: i ← 1 else 4: if i ≥ 0 then for j = 0 to 10 do 6: blah() carryOutSomeProcessing() 8: end for end if 10: end if return i 11
- 16. And of course, we can refer to the algorithm using ref: See Algorithm 1 but the good thing is we can also refer to a specific line e.g. Line 4 or Line 7. 12
- 18. LATEX is extremely powerful when it comes to typesetting mathematics. It’s one of the core strengths of this system. There are two ways of displaying maths. One is inline and the other is display format – in which the whole math sits on its own set of lines. We are going to insert a mathematics equation inline here using a pair of $ signs: E = mc2 . As you can see, the display (such as line spacing) does not get messed up by the mathematics as it does with word processing softwares. 13
- 19. We can also display equations in their own set of lines. To do this, we can use the equation environment. E = mc2 (1) As you can see, LATEX inserts the equation number automatically. We can refer to it using the ref command just as we referred to sections, figures and tables. (E.g. Equation 1.) To get rid of the equation number, simply use the star variant of the equation environment. (For this, you need the amsmath package.) E = mc2 14
- 20. Alternatively, we can use the shorthand keys [ and ] E = mc2 LATEX has many builtin features and you can get many more easily. Here, we’ll see some of these features: Addition, subtraction, multiplication and division: x + 2 − 25 × 35 ÷ 98 Superscripts and subscripts: x2 x(i) 14
- 21. Summation, union, intersection, big-union, integral: n i=1 i2 x ∪ y ∩ z n i=1 xi n 0 x2 15
- 22. Fractions, brackets, square root: x y i x2 n 0 x2 √ 36 x5 2 × 34 124 356 15
- 23. Greek letters: α + β + γ∗ + Σ + Θ + 2 Matrices and vectors. For this, you need to include the amsmath package and then use the bmatrix or pmatrix environment: a 44 b c √ d Accents: ˆx ˆı ˙x 16
- 24. See the Math menu in the IDE for other operations. You can refer to “Short Math Guide for LATEX” for a lot more examples. 17
- 25. Code Listings and Using Symbols
- 26. You might come across situations where you need to find new symbols. For this, you can refer to the “The Comprehensive LATEXSymbols List”. x y (Optional) Since this is a long command, we might want to create a shortcut using the newcommand command in the preamble. This also allows us to later change the symbol without having to change the equations. x y 18
- 27. LATEXCode Listing 1: Some LATEXCode l s t s e t {language =[ LaTeX ] tex } l s t s e t {caption=Some LaTeX Code} begin{ lrbox }{codebox} begin{ l s t l i s t i n g *}[ frame= single ]{} begin{frame} end{frame} end{ l s t l i s t i n g *} end{ lrbox } begin{frame}{LaTeX Code} usebox{codebox} end{frame} 19
- 28. C++ Code Listing 2: Some C++ Code for(i = 0; i < 10; i++){ // increment the pointer *p++ = i; } 20
- 29. Line plots −4 −2 0 2 4 −1 −0.5 0 0.5 1 21
- 30. Bar charts 1 1.5 2 2.5 3 3.5 4 10 15 20 25 Foo Bar lorem ipsum dolor 22
- 31. Frame footer metropolis defines a custom beamer template to add a text to the footer. It can be set via setbeamertemplate{frame footer}{My custom footer} My custom footer 23
- 32. References Some references to showcase [4, 2, 5, 1, 3] 24
- 33. Conclusion
- 34. Summary Get the source of this theme and the demo presentation from github.com/voklymchuk/latex_templates The theme itself is licensed under a Creative Commons Attribution-ShareAlike 4.0 International License. cba 25
- 35. Questions? 25
- 36. Backup slides Sometimes, it is useful to add slides at the end of your presentation to refer to during audience questions. The best way to do this is to include the appendixnumberbeamer package in your preamble and call appendix before your backup slides. metropolis will automatically turn off slide numbering and progress bars for slides in the appendix.
- 37. References i P. Erd˝os. A selection of problems and results in combinatorics. In Recent trends in combinatorics (Matrahaza, 1995), pages 1–6. Cambridge Univ. Press, Cambridge, 1995. R. Graham, D. Knuth, and O. Patashnik. Concrete mathematics. Addison-Wesley, Reading, MA, 1989. G. D. Greenwade. The Comprehensive Tex Archive Network (CTAN). TUGBoat, 14(3):342–351, 1993.
- 38. References ii D. Knuth. Two notes on notation. Amer. Math. Monthly, 99:403–422, 1992. H. Simpson. Proof of the Riemann Hypothesis. preprint (2003), available at http://www.math.drofnats.edu/riemann.ps, 2003.