Downloaded 149 times


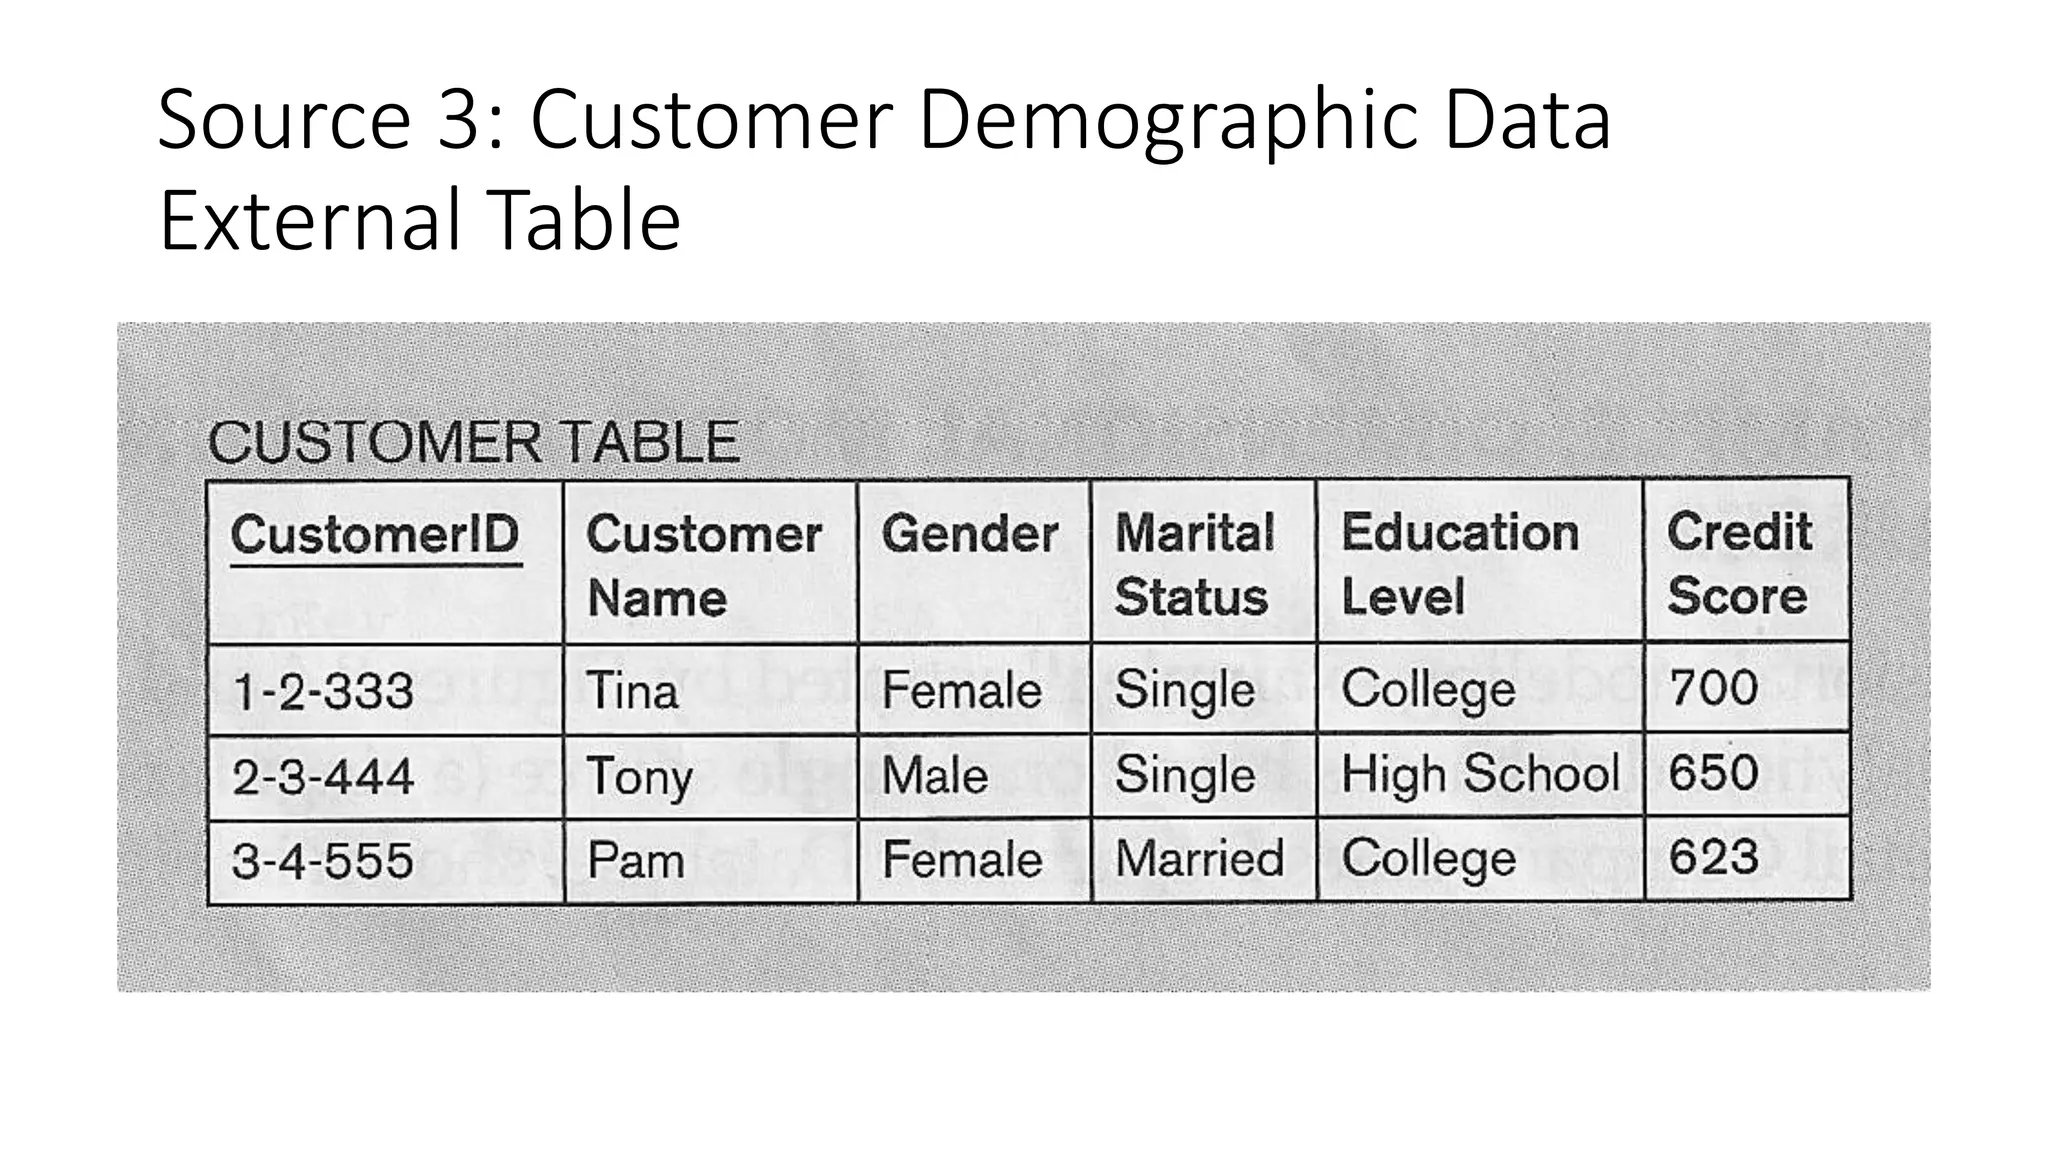

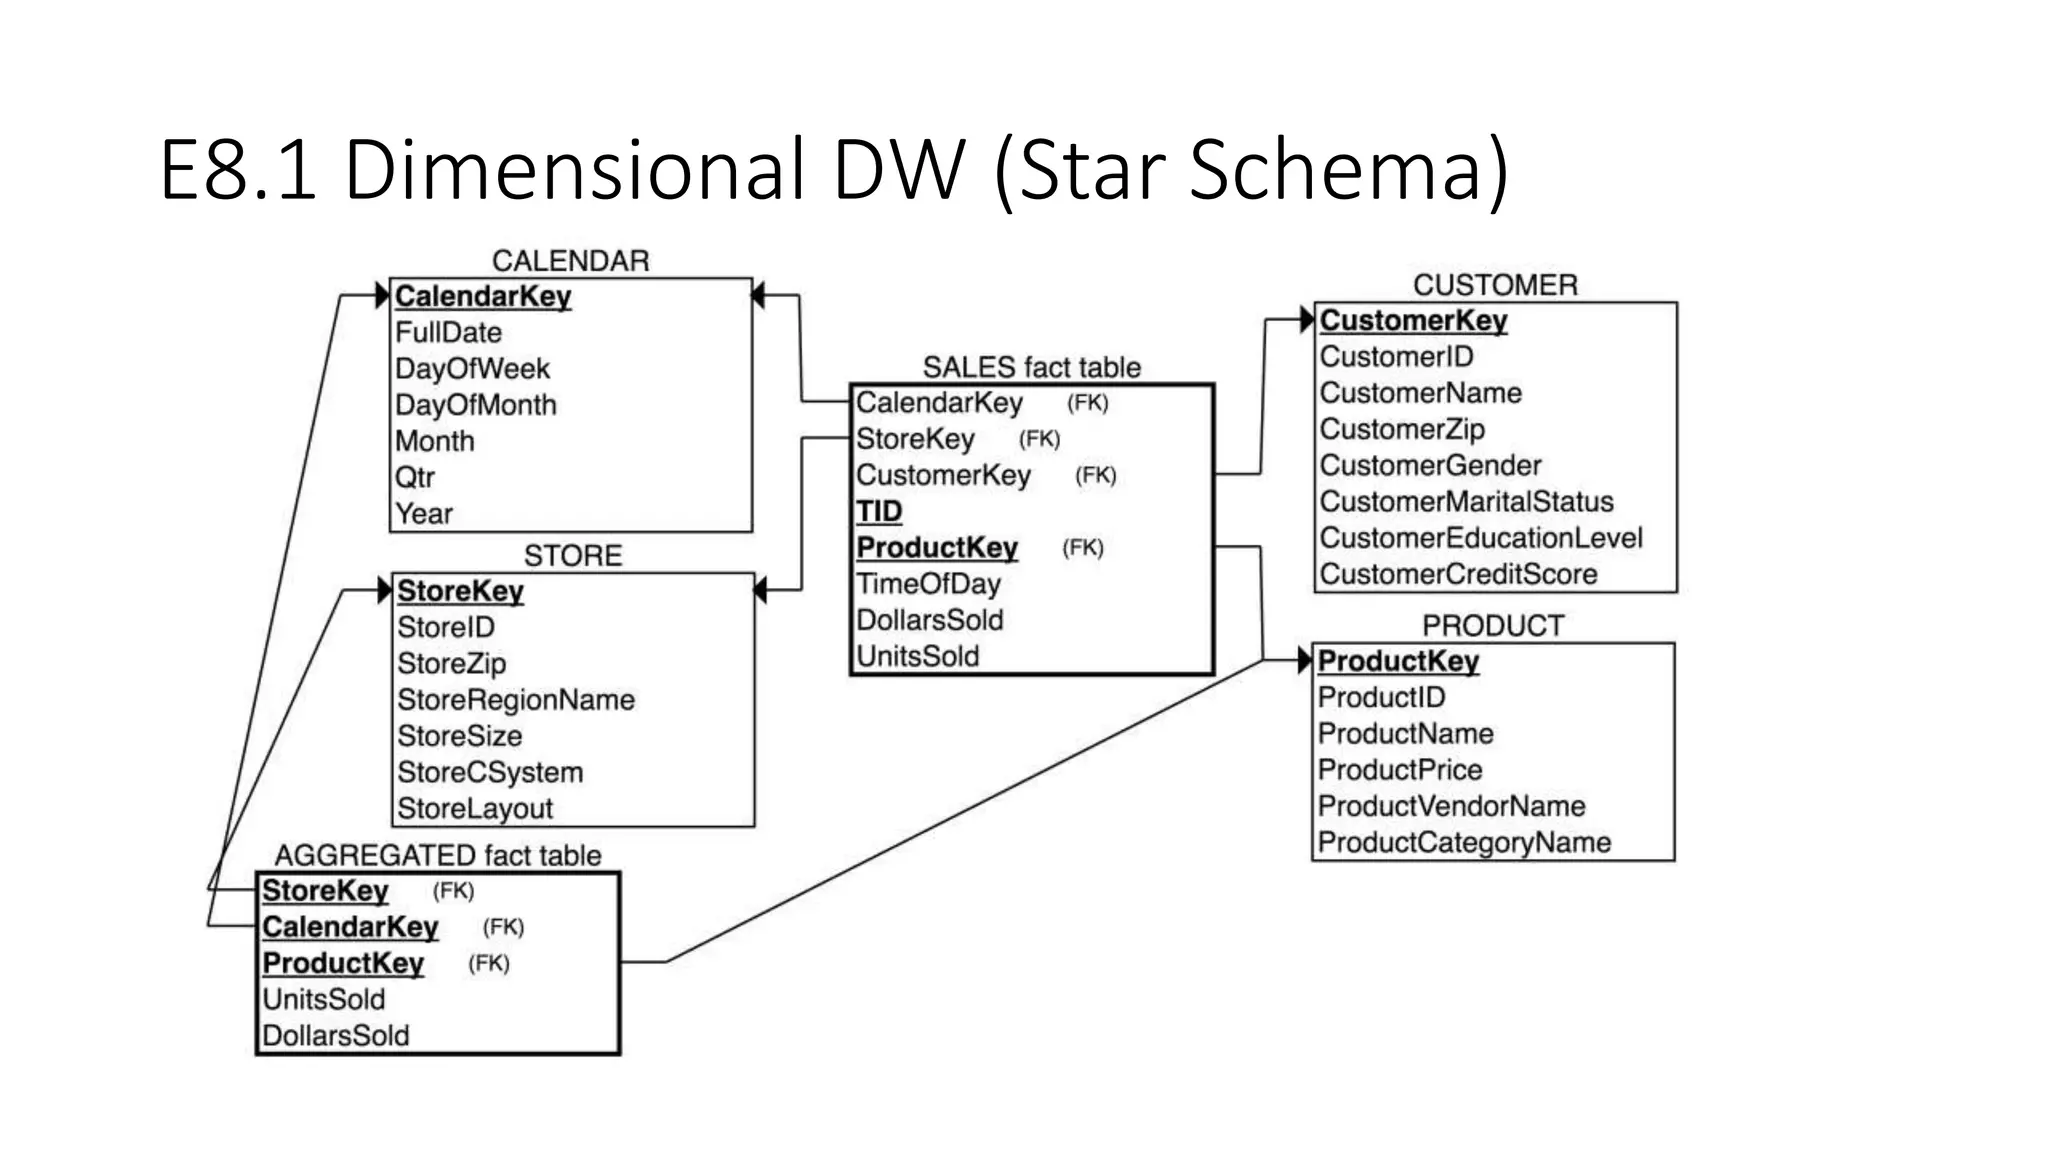
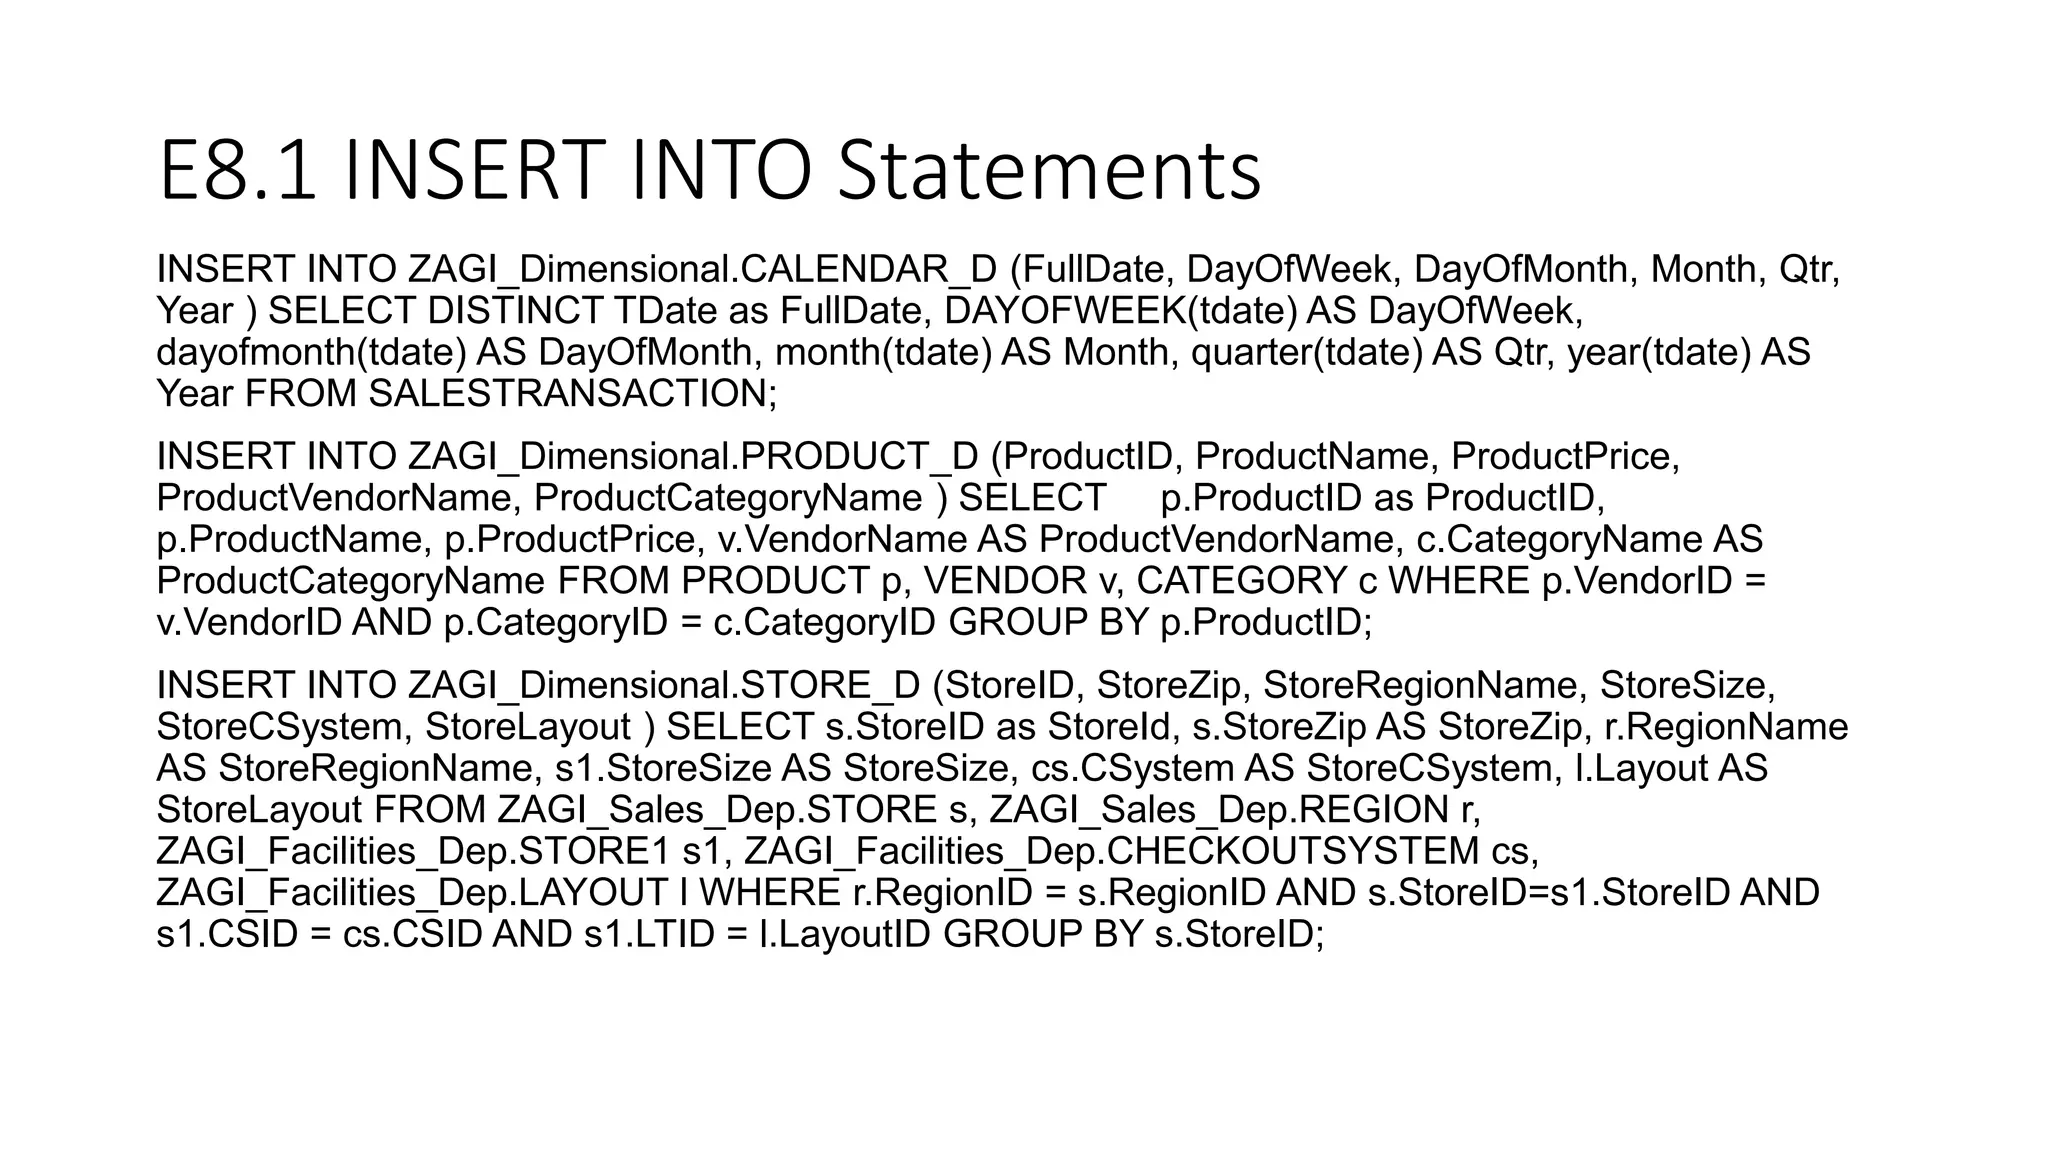


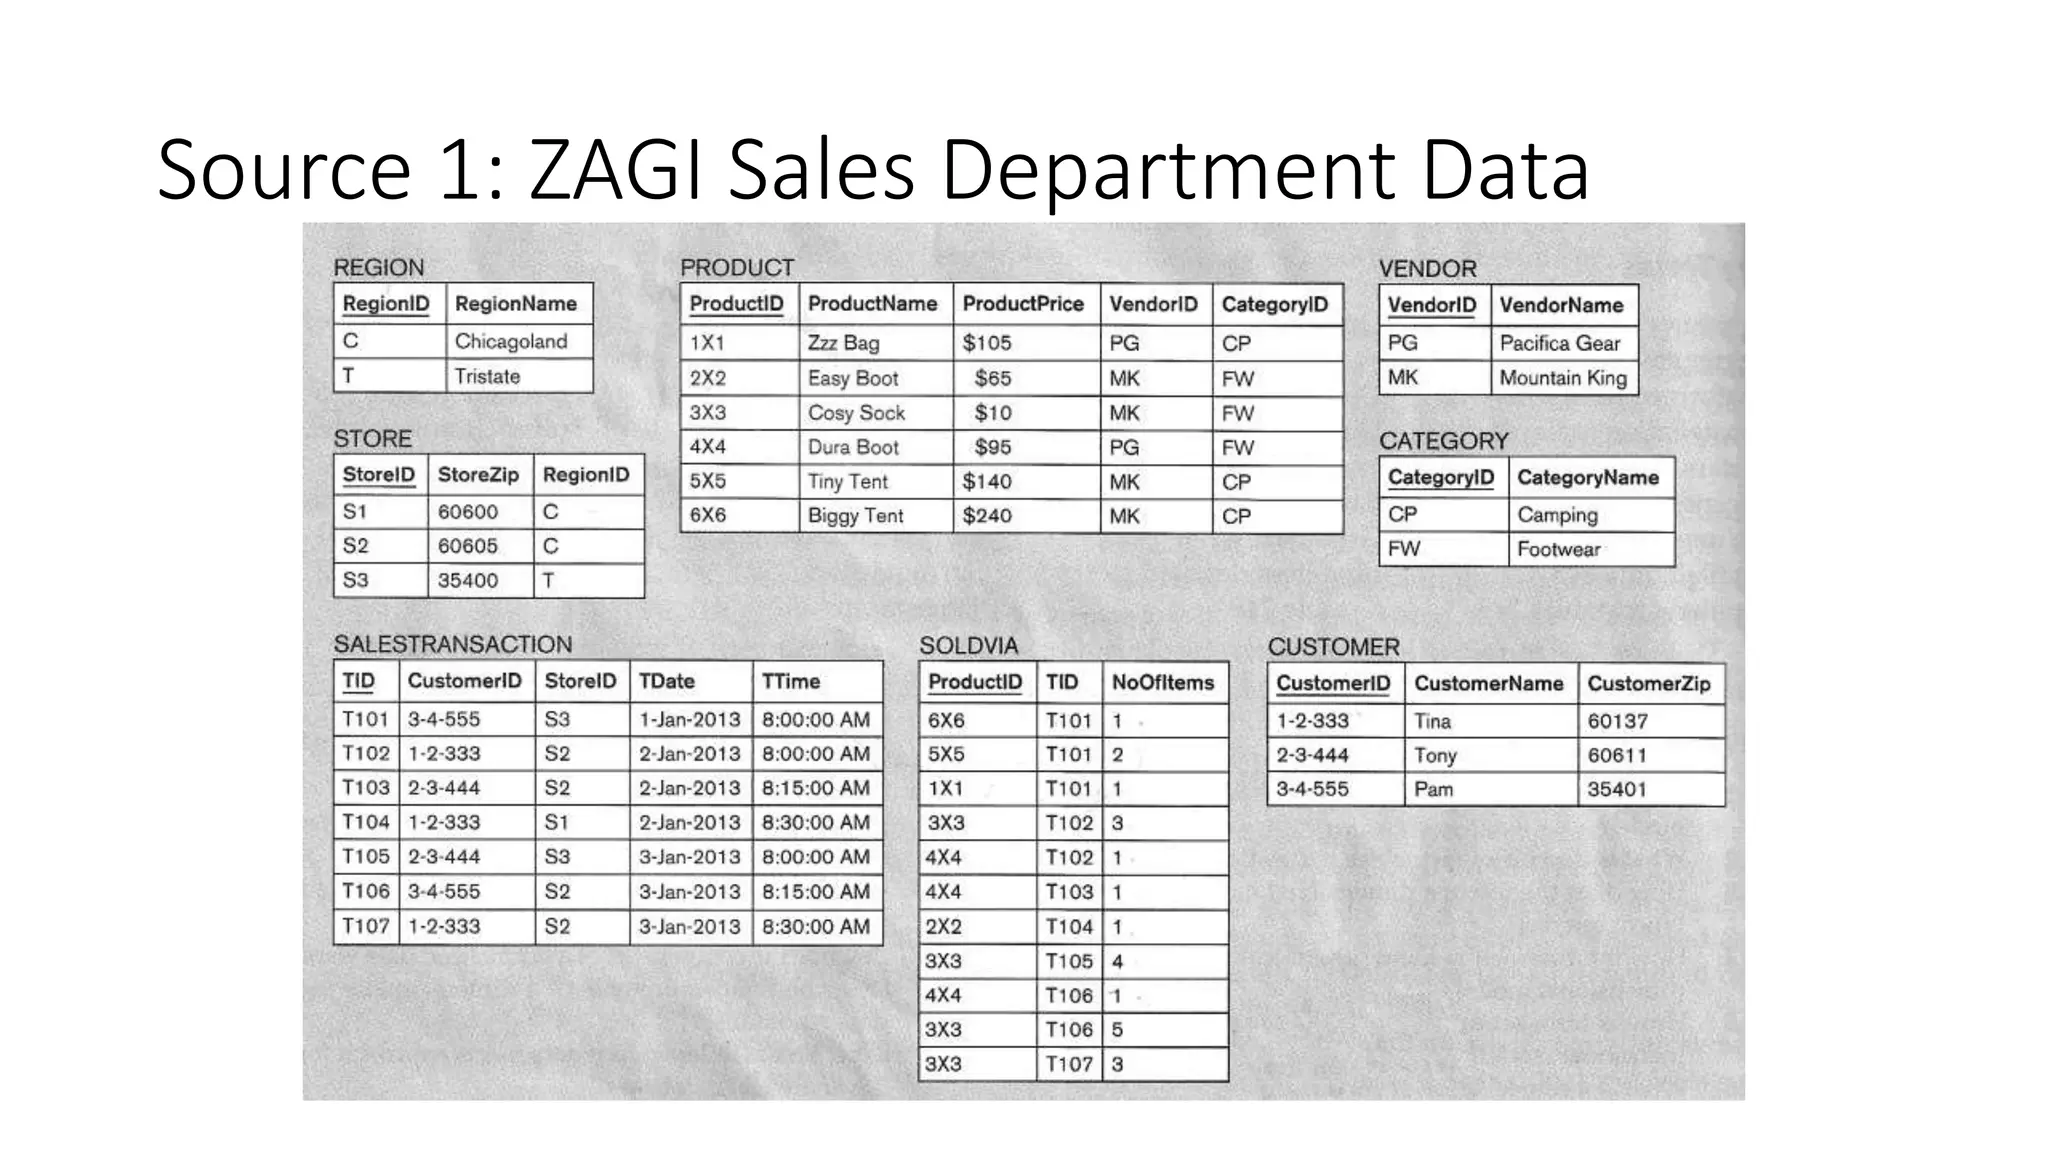


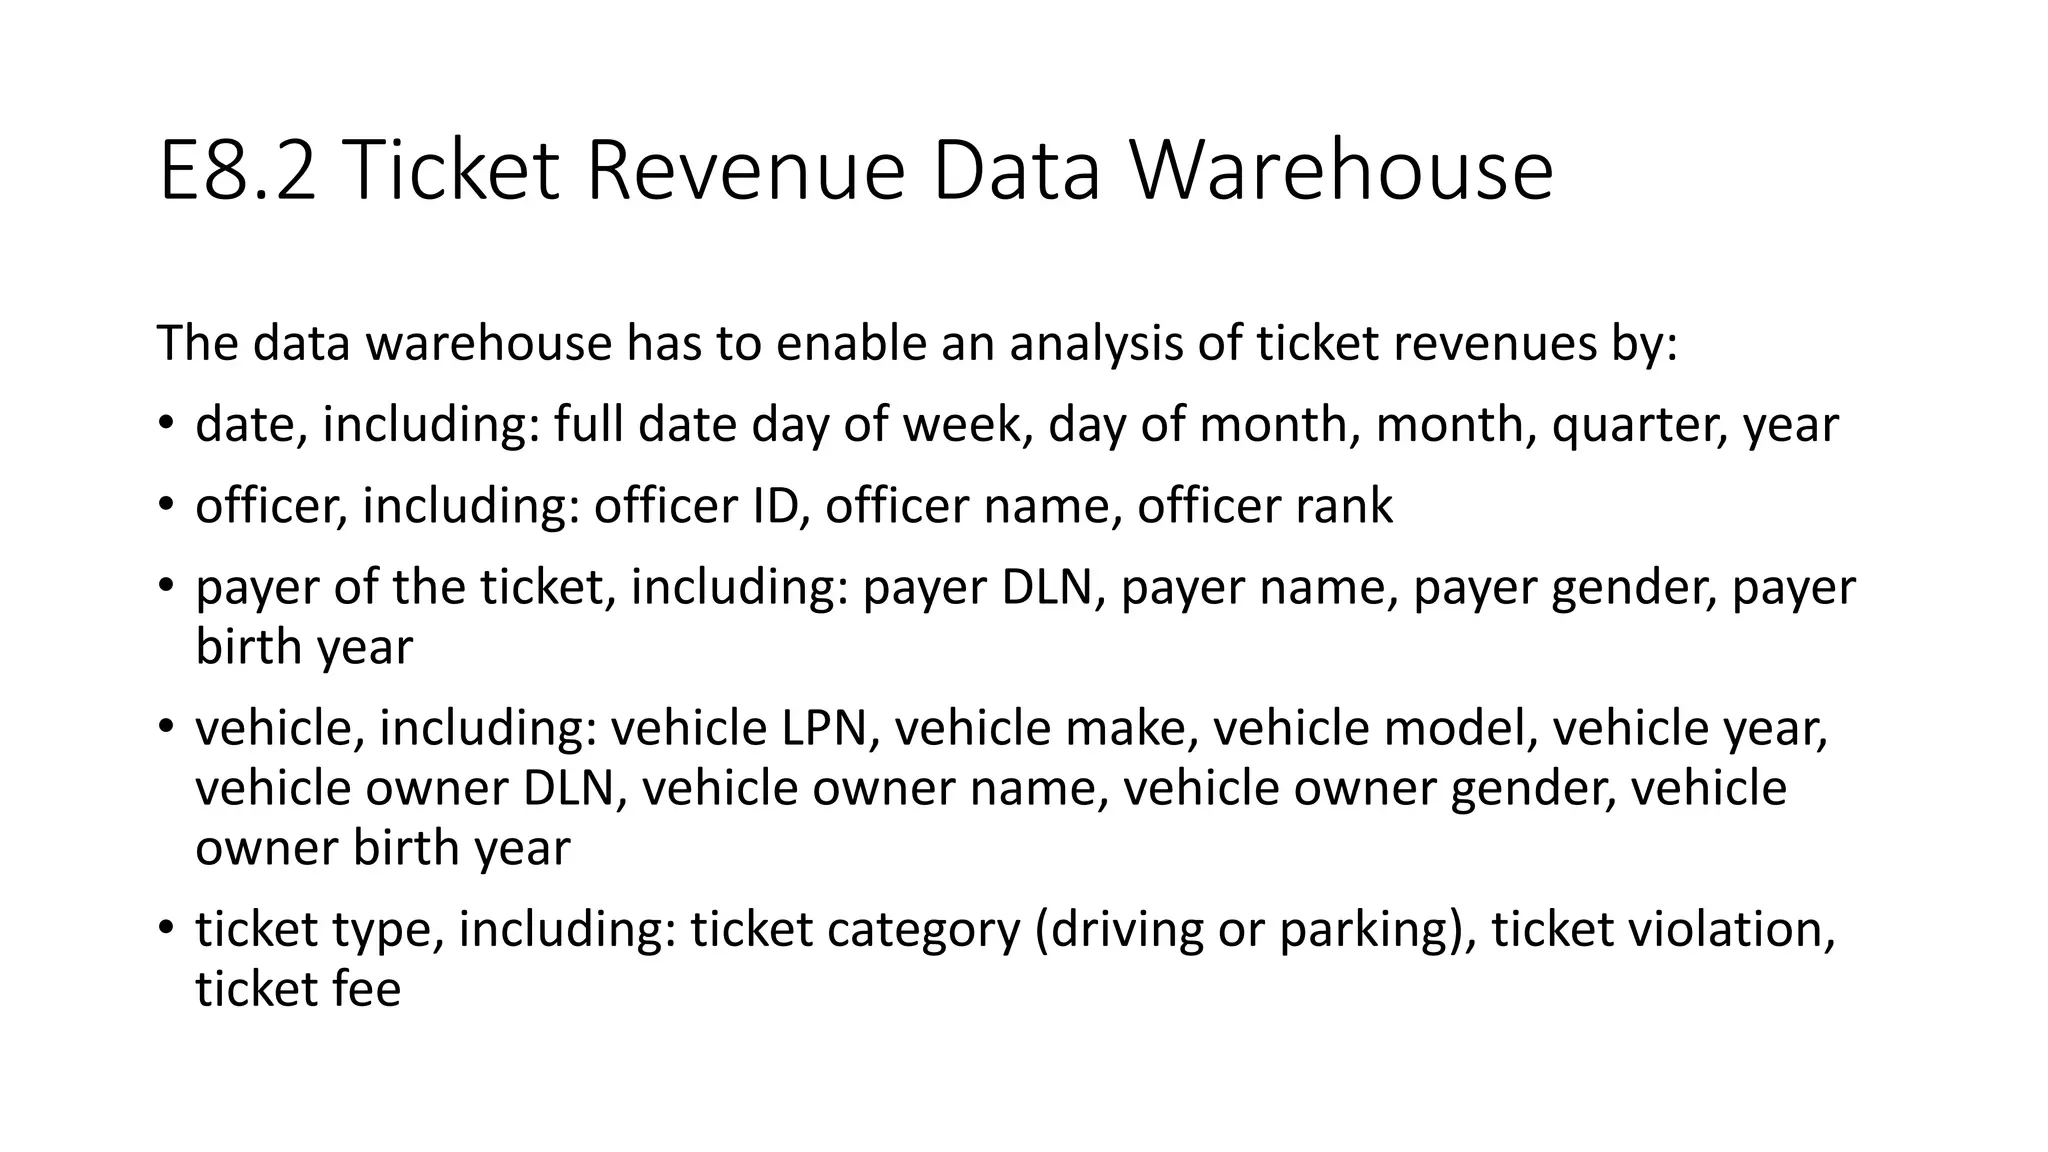


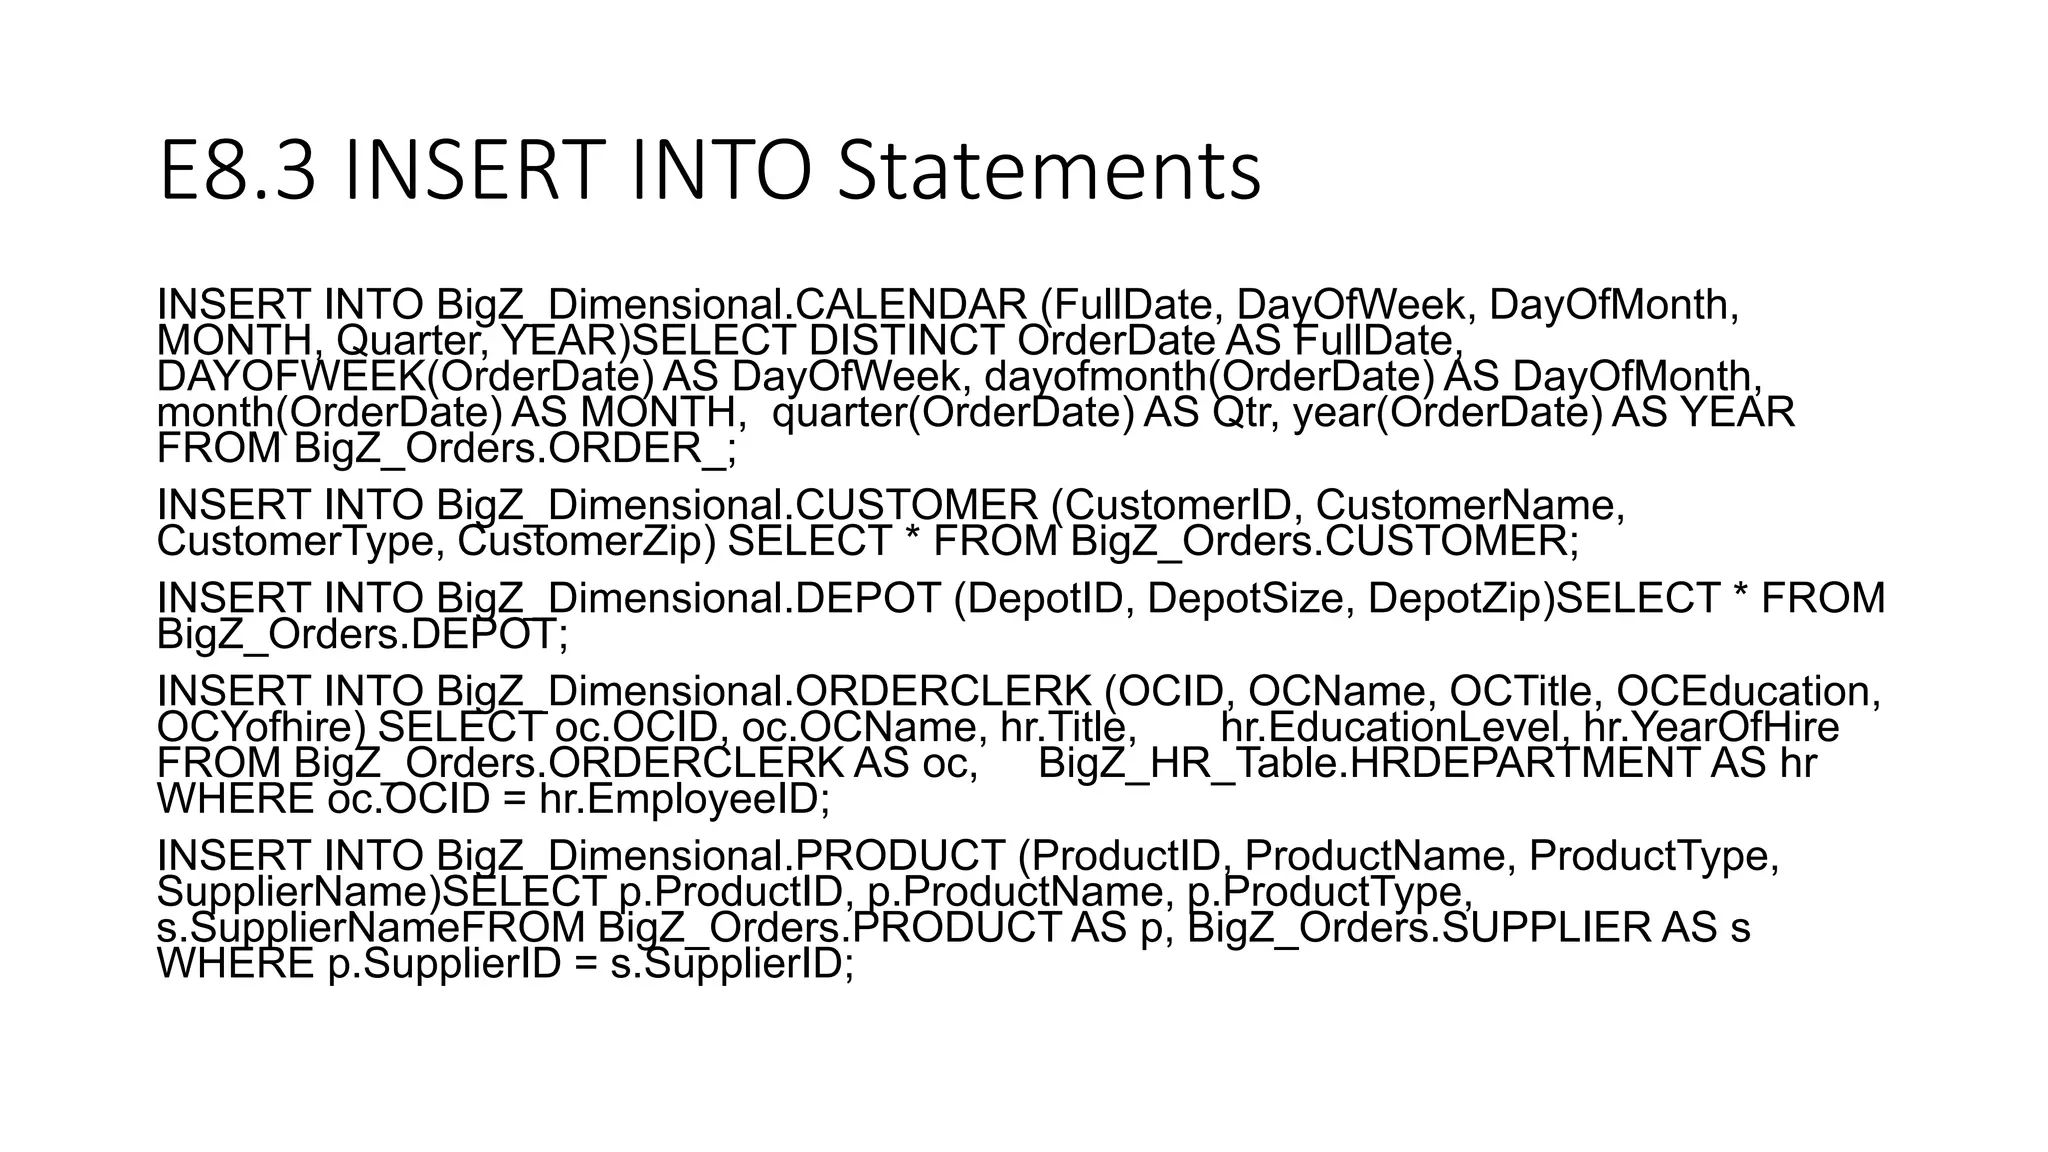


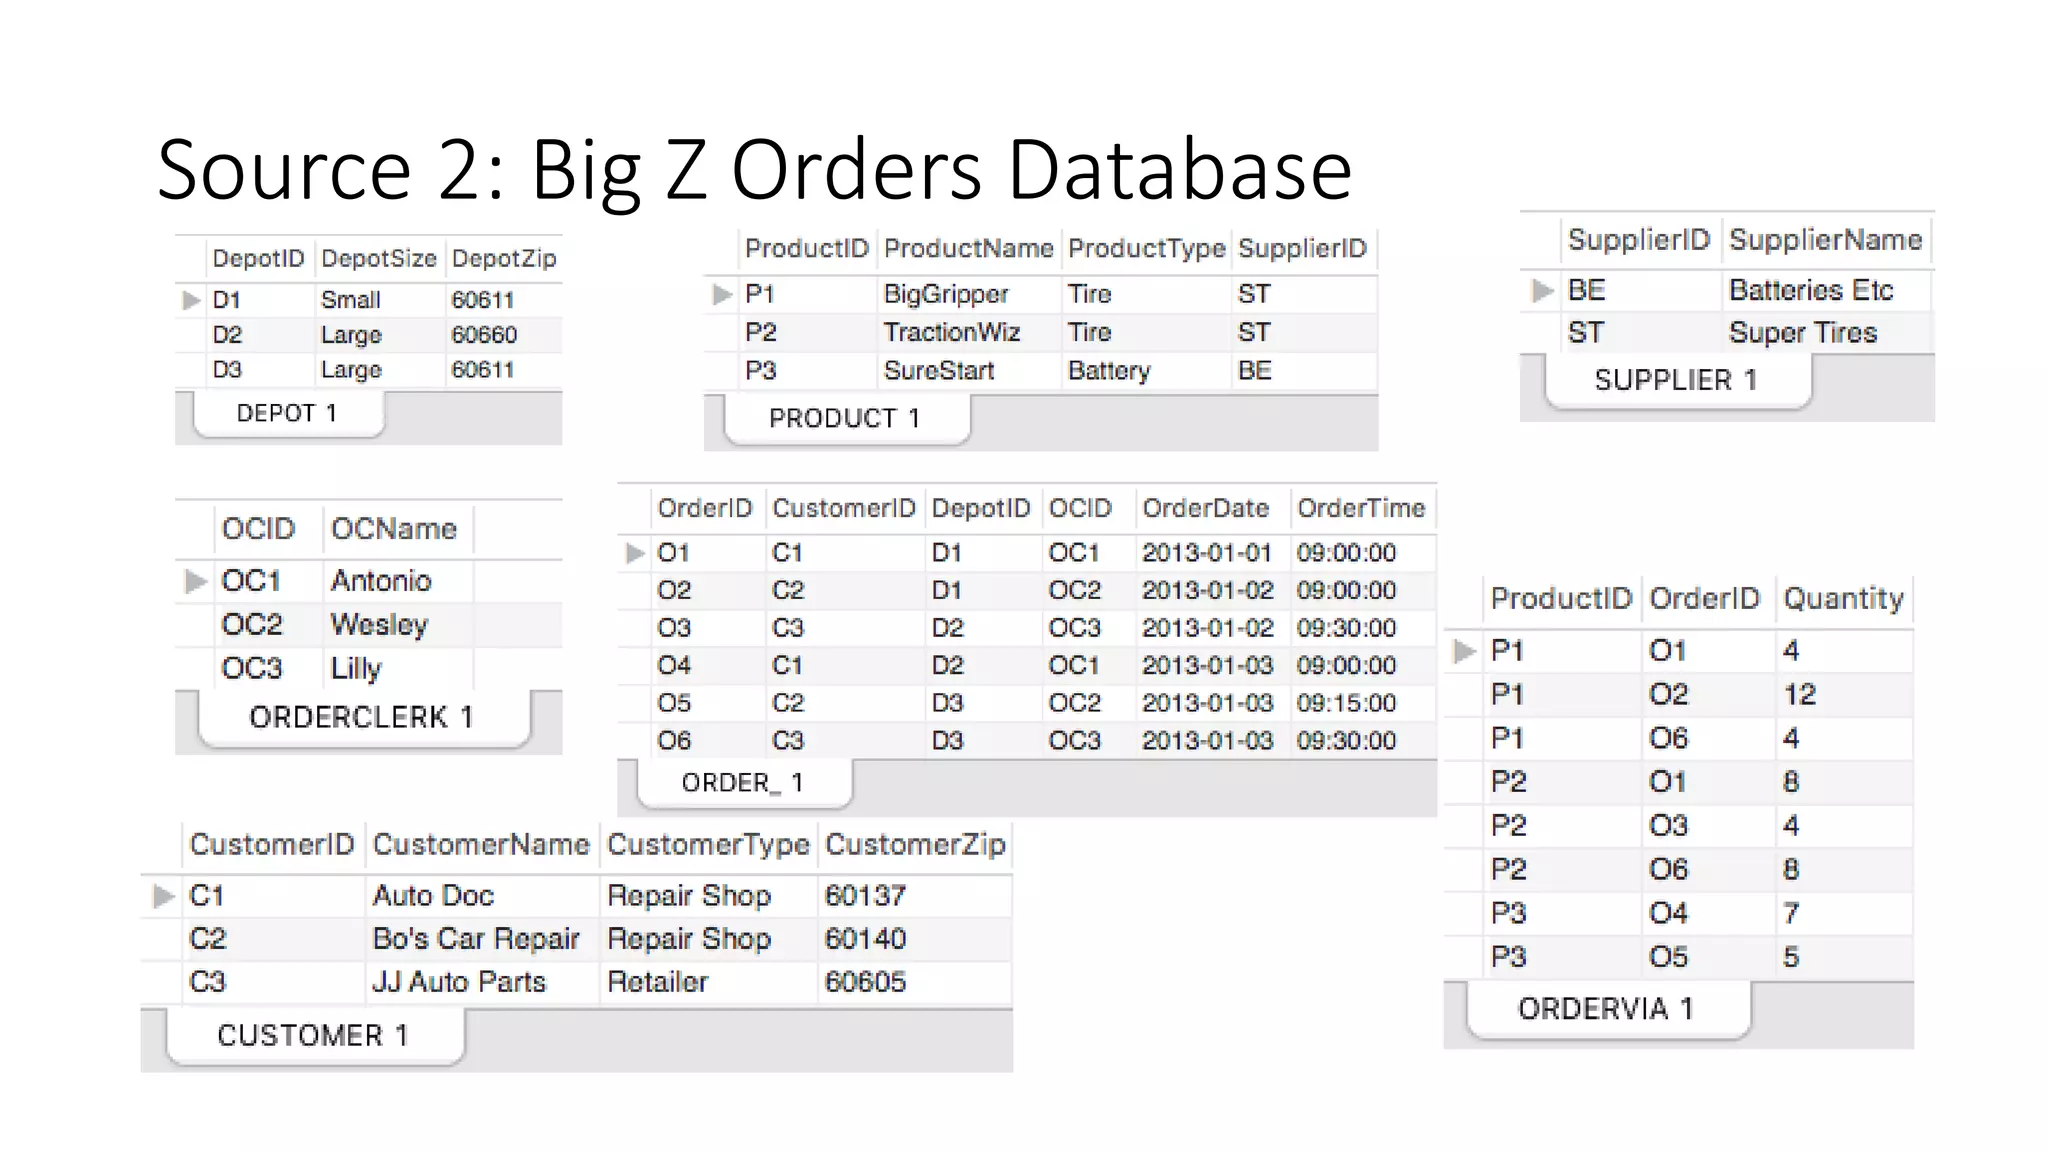
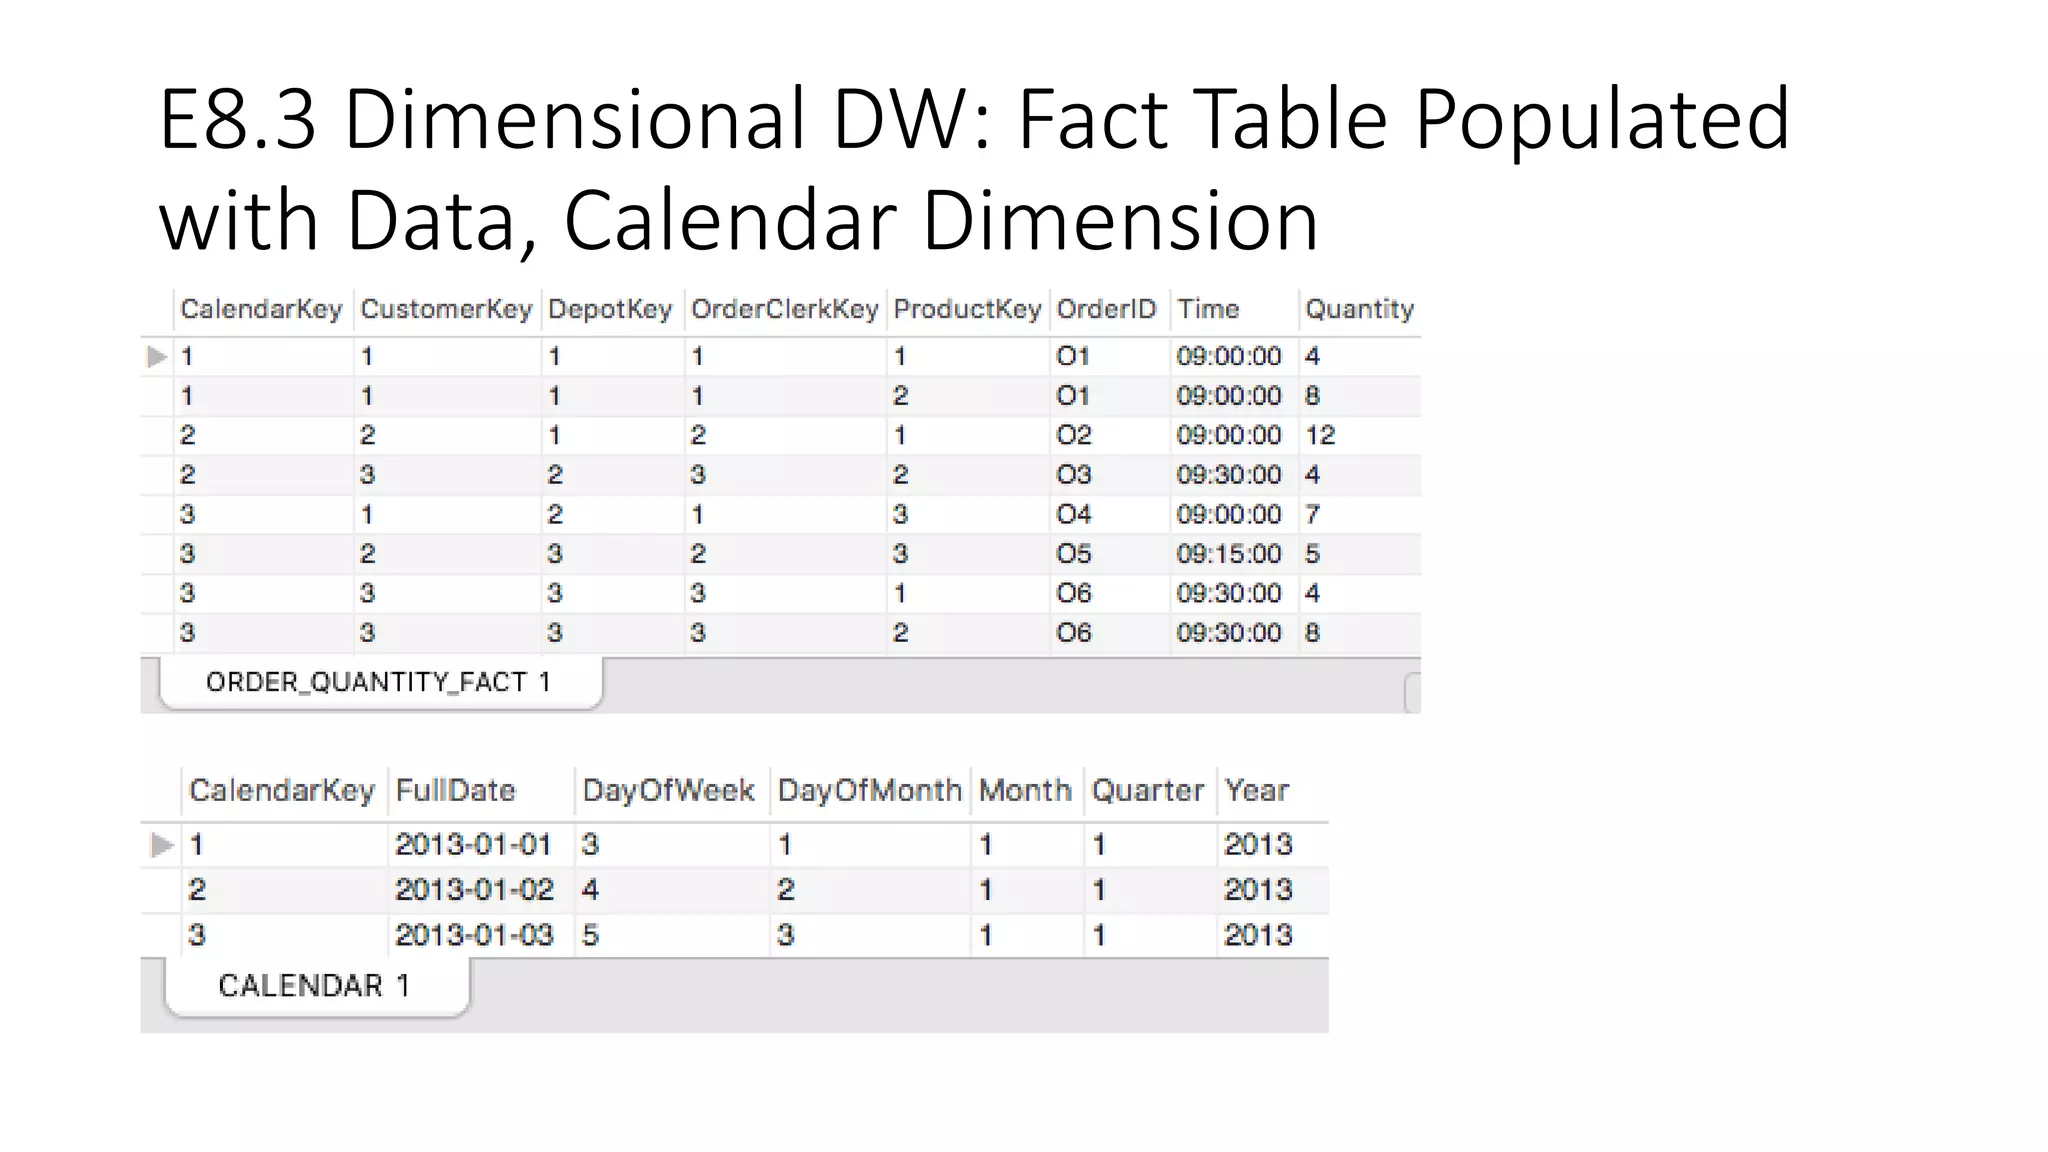
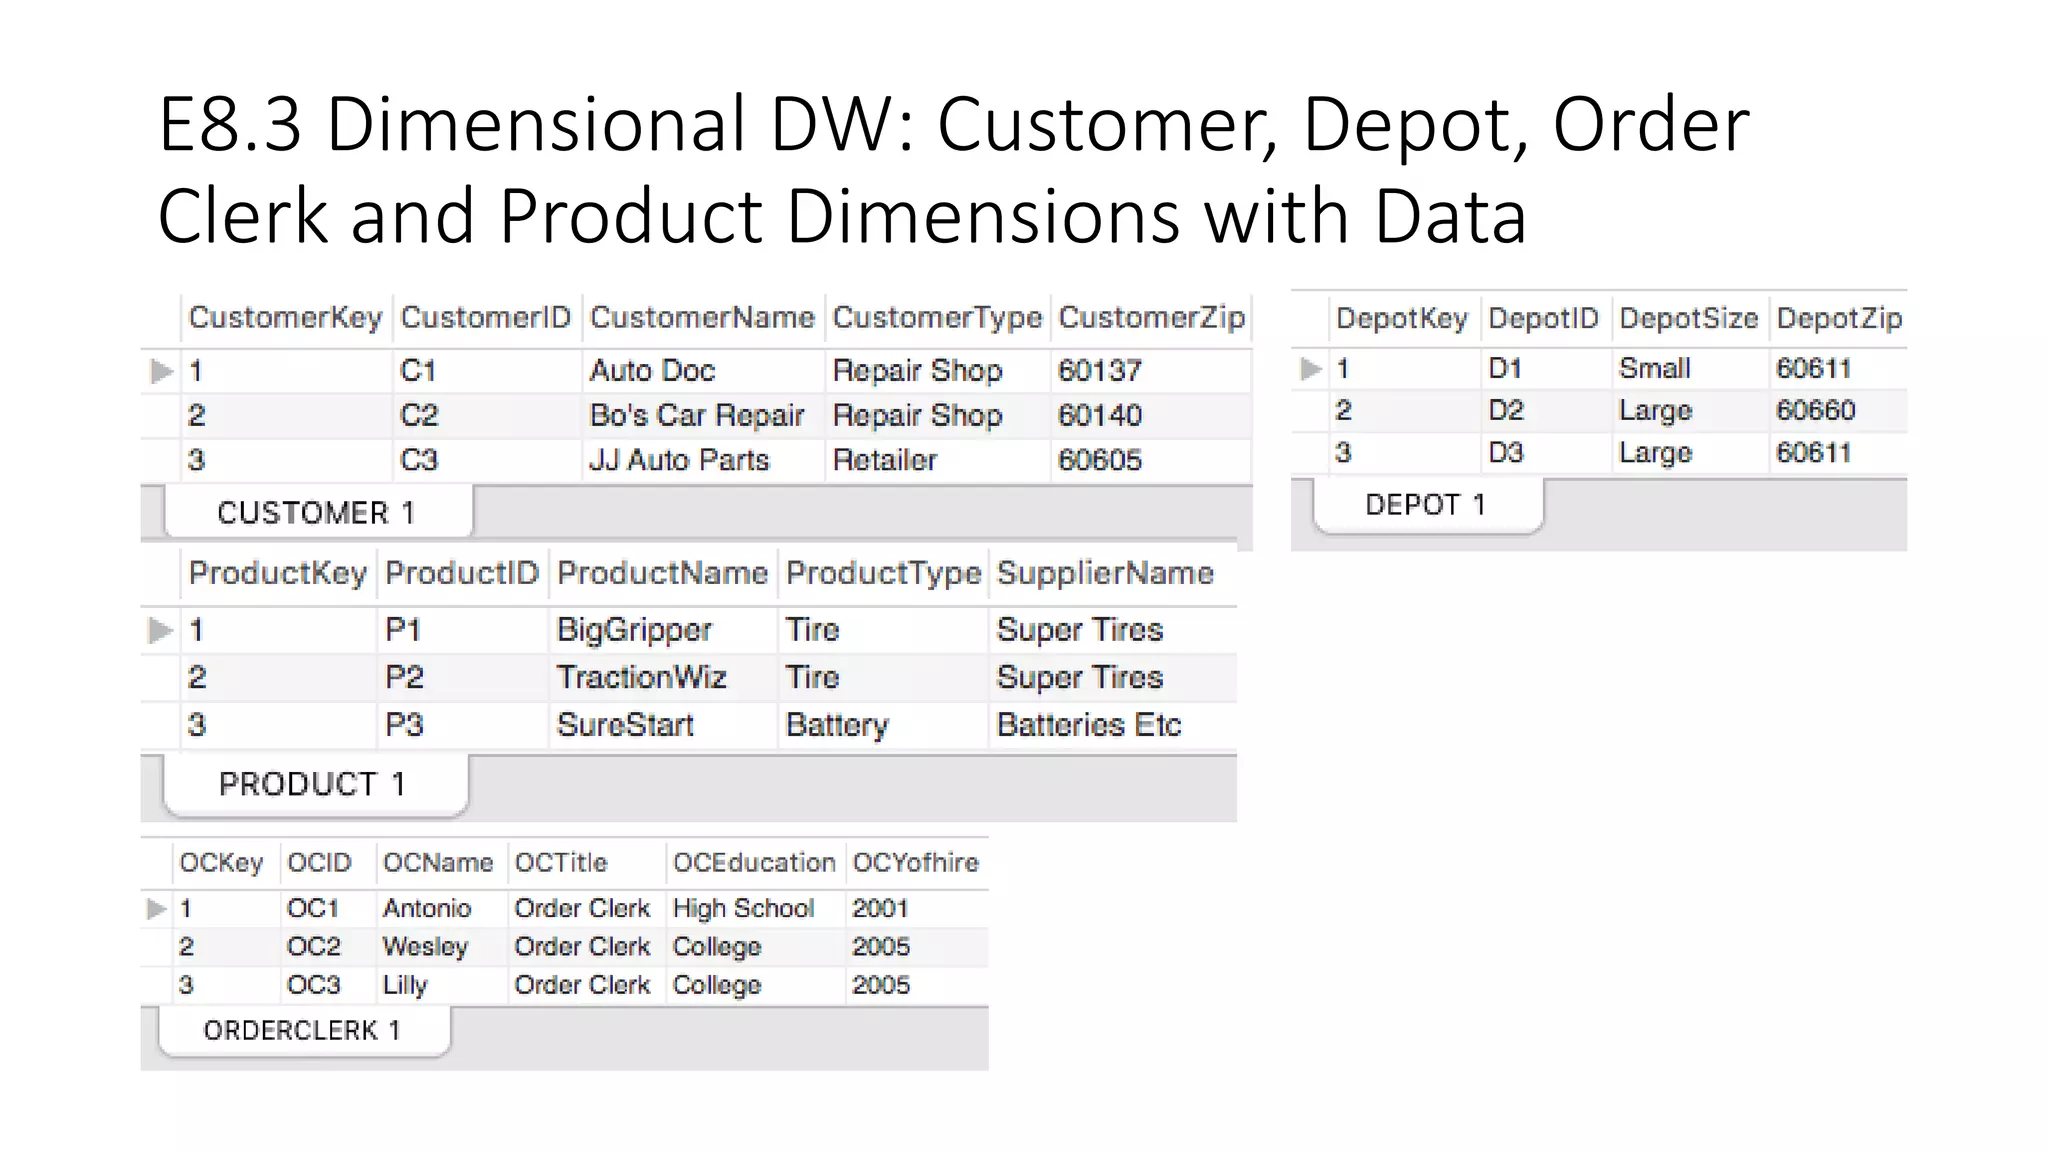


The document describes the process of building dimensional data warehouses for three different companies - ZAGI Retail Company, City Police Department, and Big Z Inc. It provides details of the source data, dimensional models created with star schemas, and SQL insert statements to populate the fact and dimension tables. The dimensional models are analyzed by date, product, customer, and other attributes. Aggregated fact tables are also created to summarize daily sales or revenue amounts.


![ict_presentation_final_final_final[1].pptx](https://cdn.slidesharecdn.com/ss_thumbnails/ictpresentationfinalfinalfinal1-251230145259-2b4839bd-thumbnail.jpg?width=640&height=640&fit=bounds)

