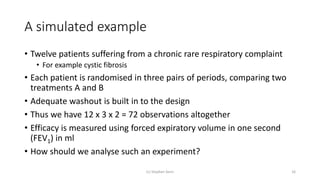
Downloaded 26 times


![The general balance approach
(c) Stephen Senn 21
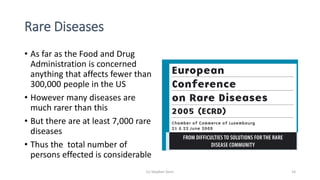
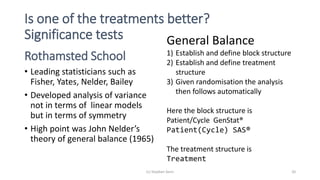
BLOCKSTRUCTURE Patient/Cycle
TREATMENTSTRUCTURE Treatment
ANOVA[FPROBABILITY=YES;NOMESSAGE=residual] Y
.
Analysis of variance
Variate: FEV1 (mL)
Source of variation d.f. s.s. m.s. v.r. F pr.
Patient stratum 11 1458791. 132617. 10.04
Patient.Cycle stratum 24 316885. 13204. 1.04
Patient.Cycle.*Units* stratum
Treatment 1 641089. 641089. 50.57 <.001
Residual 35 443736. 12678.
Total 71 2860501.](https://image.slidesharecdn.com/thechallengeofsmalldata-160423143710/85/The-challenge-of-small-data-21-320.jpg)
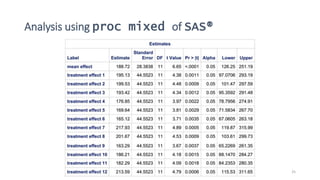

1) The document discusses the challenge of studying rare diseases due to the small amount of available data. It proposes that N-of-1 trials, where individual patients are repeatedly randomized to treatment or control, could help address this issue. 2) It provides examples of how careful experimental design and statistical analysis are important even with small data sets. Factors like randomization, blocking, and replication can increase efficiency and validity. 3) Analyzing an N-of-1 trial for a rare disease, the document explores objectives like determining if one treatment is better, estimating average effects, and predicting effects for future patients. It discusses randomization and sampling philosophies and mixed effects models.


![Polymer [ बहुलक ] Chemistry Notes PDF - Irfanullah Mehar - JJ Sir Chemistry.pdf](https://cdn.slidesharecdn.com/ss_thumbnails/polymerchemistrynotespdf-irfanullahmehar-jjsirchemistry-260210172118-3f9b37f7-thumbnail.jpg?width=640&height=640&fit=bounds)


