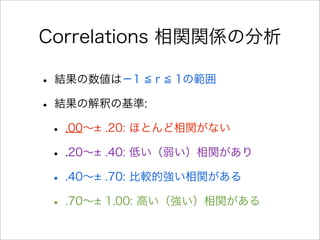
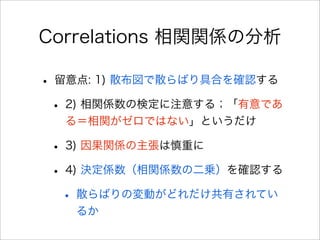
Correlations 相関関係の分析
•報告: r= r値, p = p値(nまたはdf)
• A Pearson correlation coefficient of r =.
06, p = .66 (n = 50) was found between
scores on the memory test and a timed
vocabulary recall test that students took.
This means that scores on the memory
test explained R2 = 4% of the variance in
the vocabulary test, a very small effect
size.
研究事例検討
Research question
• Coulddifferent cooperative learning
approaches to teaching reading
comprehension affect scores on a
semester-final reading comprehension
test at the university level?
19.
研究事例検討
Participants
• 90 femaleIranian leaners of English who
attended 16 sessions of 45 minutes each
during a college semester.
20.
研究事例検討
Method
• There were3 groups:
• STAD: those who received a
cooperative learning approach to
reading labeled STAD
• GI: who received a different
cooperative approach called GI
• control group: who practiced reading
through Conventional instruction (CI)
21.
研究事例検討
Results
• Mean scoresand standard deviations on a
semester-final comprehension test ... the STAD
group (M=12.3, SD=3.3) ... the control group
(M=10.23, SD=2.76). A one-way ANOVA was
performed, F (2, 87) = 3.46, p = .036,
indicating that not all of the groups performed
the same way .... Post-hoc tests found a
statistical difference between the STAD and
control groups only. (... Cohen s d effect
sizes ... STAD vs. control, d = .68, effect size is
medium)