Research focuses on monitoring landscapes downgrading in specific conditions of Arctic ecosystems with cold climate conditions (marshes, permafrost, high humidity and moisture). Specific case study: cryogenic landslides typical for cold environments with permafrost. Area: Yamal Peninsula. Aim: analysis of the environmental changes caused by cryogenic landslides in northern land- scapes affecting sensitive Arctic ecosystems. Thaw of the permafrost layer causes destruction of the ground soil layer and activates cryogenic landslide processes. After disaster, vegetation coverage needs a long time to recover, due to the sensitivity of the specific northern environment, and land cover types change. ILWIS GIS was used to process 2 satellite images Landsat TM taken at 1988 and 2011, to assess spatiotemporal changes in the land cover types. Research shown ILWIS GIS based spatial analysis for environmental mapping.
Human interactions with the environment are identified as one of the leading causes of climate change and variation. Modification, conversion and maintenance of land cover are all forms of anthropogenic interactions with the environment that result in a variety of vital changes to the environment that either positively or negatively feedback to the environment and climate. The identification and monitoring of these Land Use/ Land Cover Changes (LULCC) is therefore important since changes in land cover, occasioned more often than not by anthropogenic land use, alter land-atmosphere interactions upon which ecosystem services rely thus resulting in climate change and variation. Land Surface Temperature (LST) is a property of the land surface and refers to the temperature of the interface between the earth’s land surface and the atmosphere. It is therefore an important variable in land-atmosphere interactions and a climate change indicator which varies over space and in time as a function of vegetation cover, surface moisture, soil types, topography and meteorological conditions. Normalized Difference Vegetation Index (NDVI) is a numerical indicator derived from the Visible (Red) and Near Infrared (NIR) bands of the electromagnetic spectrum used in remote sensing to assess the concentration of green leaf vegetation and plant phenology. It is also an accepted and widely used parameter in characterization and assessment of vegetation change. This study uses a remote sensing approach in one of the most ecologically rich and diverse ecosystems to investigate the effect of Land Use/ Land Cover Change and in particular vegetation change on Land Surface Temperature (LST). The study area is in the Mara ecosystem located in South Western Kenya. LANDSAT satellite images for 1985, 1995, 2003 and 2010 were used to derive NDVI and LST. We found that human related Land Use/ Land Cover Change (LULCC) in the form of conversion of land for cultivation purposes has been and is taking place around the Maasai Mara National Reserve (MMNR). We also found that a negative correlation exists between LST and NDVI thus indicating that with decrease in vegetation cover and conversion to cultivated land, there is increase in Land Surface Temperature (LST).
The rural-urban socioecological transformation of Mediterranean mountain areas under global change. Local studies in Olzinelles and Matadepera (Barcelona Metropolitan Region)
Environmental Changes and Effects on a Population of Smooth Newt Lissotriton ...IJEAB
The population of Lissotriton meridionalis in the area of “Bosco di Palo” Natural Park are monitored since 1995. From 2004 to 2005 in the area it was carried out a massive cutting of dead trees with evidence of alteration of the undergrowth. The study aims to verify, through the index of the population estimate, if the species has suffered changes in the size of the population following environmental changes. For the research were chosen three ponds in the wood and the data collection took place from the breeding season of 1995 – 1996 to 2014 – 2015, in each of the seasons was made an estimation of the population density. The data obtained are been compared in order to make assessments on the conservation status and persistence of the species in the site, also as a result of environmental changes suffered by “Bosco di Palo” Natural Park. The analysis of the population estimate, used in this work as an index of the conservation status of the species in the Park, confirms that, in the previous period and in the period following the die-off of trees and cutting plant health, we have substantially the same values of population size.
Systematic framework to assess restoration actions and outcomes based on meas...Richard Thackway
A unifying framework is presented for tracking the outcomes of intentional and unintentional land management practices on the condition components of plant communities. The framework is based on 22 indicators hierarchically organised into 10 functional, structural and compositional criteria. Changes in the values of criteria and indicators over time track the response of a plant community to land management practices. This involves a twostep process. First develop a systematic and comprehensive site-based chronology of land management practices over time. Second fully integrate relevant data and information on the responses of the plant community into the chronology of practices, actions and interventions. How, and to what degree, the practices effect the indicators is also recorded, including deliberate and/or inadvertent actions and outcomes. Data and information on the outcomes of actions is compiled from various sources including; direct measures of field-based attributes, estimates of attributes derived from expert elicitation, environmental histories, interviews with skilled subject specials and relevant metrics derived from multi-spatial and multi-temporal remote sensing datasets. Provided a competent ecologist has access to key resources, a preliminary assessment can be completed in three days. Indicators are scored separately using a metric 0-1, based on the response of the plant community’s indicator assessed relative to the indicator in the reference state. Indicator scores are aggregated and weighted separately for three components; functional (55%), structural (27%) and compositional (18%). The reference state is assigned 100%. This framework has been widely applied across major climate zones in Australia to track and explain observed decadal spatial and temporal changes in the condition of plant communities including changes due to restoration activities. Examples will be provided in how applications of this framework also provide insights in plant community resilience, possible system trajectories and future management options.
Remote sensing of the environment and Earth observation sciences are relatively young research domains that are highly interdisciplinary, combining expertise in biology, ecology, geography, physics, and computing science. Combining data from space-based and airborne sensors with traditional field observations provides powerful insights on how different ecosystems function and what drives changes in them at a global scale. With the turn of the 21st century we have seen a major expansion of our Earth observation capabilities with hundreds of new satellite systems in orbit around our planet and a myriad of new environmental sensor systems at the surface keeping an eye on how our planet is changing and how those changes influence our societies.
This presentation reviews the basics of remote sensing of vegetation biophysics for ecology and environmental monitoring and explores in greater depth how we can use these new technologies to better understand how more sensitive ecosystems respond to global change forces and can act as canaries in the coal mine for the early detection of climate change risks. I will also discuss how our research capabilities in this field are changing with the start-up of commercial aerospace agencies, the ever-decreasing size and cost of consumer electronics, and the emergence of affordable unmanned aerial vehicles, or ‘drones’.
Mapping Land Cover Changes Using Landsat TM: a Case Study of Yamal Ecosystems...Universität Salzburg
This poster presents image processing by ILWIS GIS. It demonstrates changes in land cover types in tundra landscapes (Yamal) since 1988 to 2011. The research method is supervised classification (Minimal Distance) of the Landsat TM scenes. The new approach of the current work is application of ILWIS GIS and RS tools for Arctic, Bovanenkovo region. The poster demonstrates techniques of the remote sensing data processing by ILWIS GIS.
The North America and Eurasia Arctic transects: Edie Barbour
Walker, D.A., Kuss, H.P., Kopecky, M., Frost, G.V., Kade, A., Vonlanthen, C., Raynolds, M.K., and Epstein, H., 2011, The North America and Eurasia Artctic transects: Using phytosociology and remote sensing to detect vegetation pattern and change: Proceedings Euiropean Vegetation Survey, 20th Workshop, Rome, 6-9 April 2011,
Geoinformation monitoring of regenerative successions at the territory of Kho...Liashenko Dmytro
In this research, the case study of ex-arable lands in a period from 2013 to 2020 at the National Reserve "Khortytsia" has been conducted. The regenerative successions that cause grasslands and woody-shrub vegetation at the Khortytsia were the main objects of the research. The succession factors (the proximity of natural complexes as sources of seeds, the presence of adventitious species, fires, rats, human activities) have been analyzed. It has proposed the vegetation changes detection and mapping technique on the abandoned lands. The study of vegetation changes has been performed by visual and semi-automatic interpretation of Landsat 7, 8 satellite images. In addition map series of the NDVI changes have worked out. The vegetation changes have been studied by a linear trend of NDVI average median values analysis. Research has shown the effectiveness of geoinformation technologies application for regenerative successions monitoring at the territory of Khortytsia National Reserve.
Geohydrological study of weathered basement aquifers in Oban Massif and envir...iosrjce
The focus of this research is to model the geohydrology of the precambrian Oban Massif using
geospatial techniques. Groundwater control indicators such as geology, geomorphology, drainage density,
lineament density, land use / land cover and slope steepness were derived from landsat ETM+
imagery, ASTER
DEM and SRTM DEM. Image processing software such as ENVI 3.2, ARC GIS9.2 and PCI Geomatica were
used for image processing , digitizing and lineament density computation respectively. Weighted averages of the
groundwater controlling factors were used to produce thematic maps of geology, lineament density, drainage
density, slope steepness, land use/land cover and geomorphological units. The thematic maps were overlaid in a
GIS environment to model the ground water potential map of the area. Arc GIS, Arc View and Map Info were
used for geographic Information System analysis. ERDAS imagine 8.6 and ENVI 4.2 were used for
georeferencing, image analysis and coordinate transformation. ASTER DEM was used for analysis of
geomorphology. For vegetation, discrimination in land cover / land use mapping band 4: 3: 2 for landsat ETM+
was used. Unsupervised was used to have a general idea of the area. Supervised classification was used for
final land use/ land cover mapping. Result show that geology, lineament density, and slope steepness are the
most influential groundwater controlling factors of groundwater potential. Their degree of influence can be
summarized as geology > lineament density> slope>geomorphology>drainage density>land use / land cover.
From the groundwater potential map, four groundwater potential zones: very good, moderately good, fair and
poor. Successful boreholes drilled in the groundwater favourable potential areas should be reticulated to the
neighbourhood with poor groundwater potentials to salvage groundwater problem in the study area.
Research Inventy : International Journal of Engineering and Science is published by the group of young academic and industrial researchers with 12 Issues per year. It is an online as well as print version open access journal that provides rapid publication (monthly) of articles in all areas of the subject such as: civil, mechanical, chemical, electronic and computer engineering as well as production and information technology. The Journal welcomes the submission of manuscripts that meet the general criteria of significance and scientific excellence. Papers will be published by rapid process within 20 days after acceptance and peer review process takes only 7 days. All articles published in Research Inventy will be peer-reviewed.
Greening of the Arctic: An IPY initiative
1-Rationale and overview of the GOA initiative.
2-North American Arctic Transect.
3-Yamal Russia Transect.
4-Circumpolar analysis of 28-year trends of sea-ice concentration, land-surface temperatures and greening patterns
I° Riunione Gruppo di Lavoro SISEF Modellistica Forestale
Workshop, Bologna, 18 Dicembre 2009
The GEOtop model: eco-hydrological applications at plot and catchment scale.
G. Bertoldi, S. Della Chiesa, S. Endrizzi, M. Dall’Amico, E. Cordano, S. Simoni, U.Tappeiner, R. Rigon
Land Use Land Cover Change Detection of Gulbarga City Using Remote Sensing an...ijsrd.com
Land use and land cover(LULC) recently these days became a major component to handle natural resources and managing changes occurring in the environment.which is due to expansion of the urban area it has lead to critical losses of agriculture land,vegetation land and water bodies.followed by this the urban sprawl created a environmental issues. For example :decreased air quality and increase in the temperature etc. Land use and land cover change is driven by human actions and also drives changes that limit availability of products and services for human and animals, and it can undermine ecological wellbeing also. Land use and land cover is an important component in understanding various interactions of the human activities with the environment and thus it is necessary to be able to simulate changes. Therefore, this study was aimed at understanding land use and land cover change in Gulbarga city. In this work we took Gulbarga city to study the urban expansion and LULC change that took place in 2001 and 2012 to know the changes happened in the year 2012 by comparing with data of 2001.remote sensing methodology is used in this study which provides major coverage mapping & classification of land cover features such as vegetation,soil,water,forest etc. A wide range of environmental parameters can be measured including the land use, vegetation types, surface temperatures , soil types, precipitation, phytoplankton, turbidity, surface elevation and geology.satellite images of two different years i.e 2001 and 2012 are taken in to consideration.after image processing classification is done so as to classify images in to various different land use categories.
Hydrological responses to forest cover change in mountains under projected cl...Agriculture Journal IJOEAR
Abstract— This study quantified the hydrological responses to the forest cover change in the upper part of Sola River basin, Forest Creek catchment, southern Poland, under projected climatic conditions. The Soil Water Assessment Tool (SWAT) will be applied to investigate the response of the hydrology regime to deforestation and reforestation processes. Under two emission scenarios (A1B and B1, IPCC) of the general circulation model GISS_E (NASA Goddard Institute) were employed to generate future possible climatic conditions. The detailed research was performed on a Forest Creek catchment during the 2002-2012.A key point is to assess both the rate of change in hydrological conditions after the collapse of the spruce stands and the time necessary to stabilize the water management after the afforestation. The results of elaborations show that deforestation process reduces the retention by 40% (10 years), in the same time water drainage from the catchment shortened by 47%.
ABSTRACT. The Mediterranean terraced landscapes are mainly shaped by agrarian drainage systems. They are nowadays increasingly exposed to degradation as a consequence of their changed management. The aim of this research is to characterize the slope lands drainage systems, at the landscape scale, in a hilly Mediterranean context, in order to define action priorities for their “active conservation, based on structural and agronomic parameters.
RÉSUMÉ. Les paysages méditerranéens de terrasse sont souvent façonnés par des systèmes de drainage agricole. Ils sont aujourd'hui fortement exposés à des dégradations du fait de changements et abandon progressifs de leur gestion. L'objectif de la recherche présentée est de caractériser les systèmes de drainage des terrains en pente à l'échelle d'un territoire dans des secteurs de collines méditerranéennes, pour aider à définir des priorités d'interventions agronomiques, environnementales et socio-économiques pour préserver ces systèmes de drainage. La zone d'étude comprend 6 200ha, principalement couverte d'oliveraies, et située sur le versant sud-ouest du Monte Pisano (près de Pise en Toscane). La méthodologie mobilise le SIG et les techniques de la télédétection ; elle conduit à la caractérisation du territoire en termes agronomiques et de structure physique. Ceci permet de dégager des orientations de gestion de ces territoires pour assurer le maintien de leurs fonctions agro-environnementales.
________________
suggested citation: Rizzo D, Sabbatini T, Galli M, Bonari E (2006) Mediterranean landscapes characterization. SAGEO (Spatial Analysis and GEOmatics). Strasbourg (FRA).
Identification Of Soil Erosion Prone Zones Using Geomatics Technology In Part...IJERA Editor
Soil erosion is the removal and subsequent loss of soil by the action of water, ice, wind and gravity. Soil erosion is a process that occurs naturally at a slow rate. The average natural geologic rate of soil erosion is approximately 0.2 tons per acre per year. Erosion is the process were by the earth or rock is loosened or dissolved and removed from any part of earth‟s surface. Geological erosion is the rate at which the catchment or land would normally be eroded without any disturbance by human activity. If man alters the natural system by means of various land use practices that is caused accelerated erosion. The present study area is covering Parts of North Arcot The area is lies between E78°30'-E78°45' lattitudes N12°15'-N12°30„. The total aerial extent of the study area is 720 sq.km. It falls in the survey of India Toposheet 58 L11 on 1:50,000 scale. The IRS – 1D satellite imagery data were subjected to different types of image enhancement techniques and soil erosion areas were mapped out and GIS databases were generated showing the soil erosion areas using Arc Map 9.1 version. GIS overlay function was executed between soil erosion prone areas and the various controlling variables and the area has been fragmented into a number of polygons of land segments depending upon the controlling variables. Finally, the remedial measures were suggested for each land segment according to the controlling variables.
The study determined and analysed morphometric characteristics of the Sumanpa catchment in the Forest-
Savannah Transitional zone of the Ashanti Region of Ghana. Quantitative morphometric parameters were determined
using remote sensing and GIS techniques to assess the requirements for ecological and hydrological conservation,
planning, development and management of the catchment landscape. Results indicated that the total length of stream
segments was highest under the first order streams and decreased as the stream order increased. The catchment has an area
of 38 km2with channel closeness of 0.934 km km-2 indicating permeable sub-soil. The catchment has a relief of 137m and
a total length of stream network of 36.51km out of which 61% was ephemeral, 38.9 % was second and third order streams.
The catchment has 44 % of its area located on slopes between 5-10o with generally good vegetation cover. There are 31
streams linked to a 3rd order trunk stream forming a trellis drainage pattern. The catchment’s morphometric features
suggest a general fragile topographic condition which needs strategic approach for soil and water conservation measures
and urban landuse planning.
Evaluation of Land Suitability for Stone Pine (Pinus pinea) plantation in Leb...IJEAB
Stone pine (Pinus pinea) is a typical Mediterranean tree well adapted to drought and high temperatures. It is a species of great interest and economical importance in Lebanon and has a strong beneficial impact on the local communities from the marketing of its edible nuts. This tree is threatened by human activities and fire that are leading to its degradation. Therefore, the aim of this study is to delineate and map the suitability of soils for the plantation and extension of the stone pine. For this purpose, the adopted research methods were composed of the following three steps: (1) identifying through available data and traditional methods the ability of the lands to be planted with stone pine (2) identifying the various factors influencing the growth and fruiting of the treeand (3) transforming and integrating all the data into geo-referenced thematic maps and introducing them into the Geographic Information System (GIS) suitable for delimiting Lebanese areas suitable for planting stone pines. The obtained results were presented in a form of 10 thematic maps (GIS layers) that represent the influence of each ecological factor on the land suitability for afforestation by stone pine. A final thematic map that illustrates the most suitable areas for Pinus pinea plantations was generated by superimposing the 10 GIS layers.
Accurate and rapid big spatial data processing by scripting cartographic algo...Universität Salzburg
Accurate and rapid big spatial data processing by scripting cartographic algorithms: advanced seafloor mapping of the deep-sea trenches along the margins of the Pacific Ocean
Bringing Geospatial Analysis to the Social Studies: an Assessment of the City...Universität Salzburg
Current poster presents an example of Landsat TM image processing using ENVI GIS. Research area: Taipei, Taiwan. Located on the north of the island, Taipei is Taiwan’s core urban, political and economic center; population >2.6 M continuing to expand affecting urban landscapes. Research aim: spatio- temporal analysis of urban dynamics in study area during 15 years (1990- 2005) Research objective: application of GIS methodology and remote sens- ing data to spatial analysis for a case study of Taipei. Data: Landsat TM images taken from the USGS. Software: ENVI GIS. Workflow includes following steps: 1) Preliminary processing 2) Creation color composites 3) Classification using K-means algorithm 4) Mapping using classification results 5) Accuracy assessment. The preliminary data processing includes image contrast stretching, which is useful as by default, ENVI displays images with a 2\% linear contrast stretch. For better contrast the histogram equalization contrast stretch was applied to the image in order to enhance the visual quality. The analysis of landscape changes was performed by geospatial analysis. 2 satellite images Landsat TM were processed and classified using ENVI GIS. Result of classification: areas occupied by different land cover types were calculated and analyzed. It has been detected that different parts of the city of Taipei were developing with different rate and intensity. 3 different residential types of the city were recognized and mapped. The results demonstrated following outcomes: 1) intensive urban development of the city of Taipei; 2) decline of green areas and natural spaces and, on the contrary, increase in anthropogenic urban spaces; 3) not parallel urban development in different districts of the city of Taipei during the 15-year period of 1990-2005.
Detection of Vegetation Coverage in Urban Agglomeration of Brussels by NDVI I...Universität Salzburg
Detection of vegetation coverage in urban agglomeration of Brussels by NDVI indicator using eCognition software and remote sensing measurements Lemenkova Polina Introduction The study area encompasses selected regions of the Brussels municipality, Belgium. In the past years the city of Brussels is experiencing intensification of the density of building structures. Unlike in some other European cities, where the most evident problem is urbanization and expansion of the city margins to the suburbia, the urban structure Brussels is the intensification of the buildings density in the city centre and the existing dwelling districts. Thus, the city structure tends to become more intense and dense, due to the process of filling the empty spaces in the urban patterns and high level housing. Another example of urban processes in Brussels is reorganisation of the industrial areas. At the same time, monitoring vegetation areas is essential for environmental sustainability of the capital city. The lack of the green spaces may cause ecological instability and increase atmospheric pollution. For studies of the specific problems of the Brussels city the remote sensing data (raster image) was used together with NDVI function, in order to detect areas covered by city parks. Acknowledgement: Current work has been supported by Bourse d'excellence, Service de Bourse d' ́ etude, Wallonie-Bruxelles International for research stay of Polina Lemenkova at l'Université libre de Bruxelles.
Investigation of the Lake Victoria Region (Africa: Tanzania, Kenya and Uganda)Universität Salzburg
This poster is a student assignment for a course 'GISA 02 GIS: Geographical Information Systems - Advanced Course 0701', a part of the MSc studies. It presents an ArcGIS based spatial analysis of the Victoria Lake region including environmental, biological, social and economic characteristics of the region. The methodology includes data organizing and management in ArcGIS 9.3. Operations and technique: ArcGIS Spatial Analyst. Project architecture: ArcCatalog. Spatial referencing and re-projection: ArcToolbox. Data include DEMs: elevations (USGS). 2 tiles of the USGS DEM, Land cover data (raster), Population data: UNEP, ArcGIS vector.shp files of administrative boundaries fof Uganda, Tanzania, Kenya. Data preprocessing include following data preparation. Initial vector data: UNEP .shp. Spatial reference properties: Africa Albers Equal Area Conic projection, standard parallels 20 and -23, central meridian 25 and Datum WGS-84, Projection GEOGRAPHIC, Spheroid CLARKE1866. Data conversion from ASCII text data format to raster using ArcToolbox / Conversion Tools / ASCII to Raster (Climate precipitation data). Data were projected, processed and several layer formatting and overlays were created. Mapping was created using ArcMap. Victoria Lake has unique environment, important role in the economy of countries supporting 25 M people through fish catchment reaching up to 90-270$ per capita per annum. Kenya, Tanzania and Uganda control 6%, 49% and 45% of the lake surface. Lake catchment provides livelihood of 1/3 of the population of 3 countries with agricultural economy supported by fishing and agriculture (tea and coffee plantations).
Interpretation of Landscape Values, Typology and Quality Using Methods of Spa...Universität Salzburg
The main result of this work consists in determined ecological significant areas of habitats that are under protection´s system of Natura 2000 Sites. The patches quantification of habitats is the partial result that influences process of determination of ecological significance. The interpretative process examines land cover patches by the set of landscape metrics for the area, size, density and shape (NP, PD, MPS, PSSD and MSI). The output values could express a spatial processes in the landscape, such as perforation, dissection, fragmentation, shrinkage or attrition. The final ecological significance of the study area-Sitno Natura 2000 site-is at degree 3, what means that the area is represented by moderately significant land cover patches-habitats. It indicates the same value as the one at the initial level. According to the value of the ecological significance, the study area has been diversified into three zones, where each one indicates specific level of conservation. The zones and the final degree of the ecological significance of habitats are retroactively compared to historical and cultural human development that started in this area as early as in 1st century BC. Theoretically, such a long period of intense human impacts on the local environment should completely destroy natural environment. Nevertheless, this area demonstrates rather good natural ecosystems conditions and well functioning ecological processes within the habitats. The human impact is now observed only in small range of size not more than 1,50% from total area of Sitno Natura 2000 Site. It can be explained, first, by low population density within the study area comparing to other EU areas, secondly, by accurate usage of the living area by the local population in general, and thirdly, by high resilience of the elements of landscapes towards any human impacts.
Economic assessment of landslide risk for the Waidhofen a.d. Ybbs region, Alp...Universität Salzburg
The research focuses on the monetary estimation of the possible losses caused by landslides. Estimation of the economic damages is performed using existing simplified methodologies. Calculations were based on real estate and market price of the elements at risk. While assessing potential damage of landslides confusion arises due to these factors. 1. First, the temporal probability of the landslides occurrence is highly difficult to assess: it can only be estimated based on the reliable and obtainable data. This includes historical data continuously reporting the occurrence of the landslides. 2. Secondly, difficulties arise by estimation of the indirect losses and partially damaged objects. The amount of the damages can be assessed based on elements vulnerability, which is very uncertain to estimate exactly. Thus, the vulnerability may differ depending on object location, individual characteristics and external factors. 3. The term “landslide” is not differentiated between debris flows and shallow or rotational landslides. This is an important source for uncertainty, as movement characteristics of these landslides are different. 4. Confusing over different method approaches in the risk assessment may generate various results: difference in magnitude and occurrence of landslides, risk perception and vulnerability assessment. The estimation of landslide risk should be based on complex investigations. The data about landslide probability should be gained from monitoring programmes. The elements at risk are defined based on spatial analysis and infrastructure inventory. The vulnerability estimation should include census data and social questionnaire. The real-life situations may vary depending on the exact price of the individual object.
Current poster presents a student assignment for the CHRIS/PROBA image processing by ENVI GIS. Study Area: Thorney Island, Chichester harbour (UK): unique wetland environment, a place for rare bird colonies. Quality of CHRIS images is affected by two types of noises: vertical noise (vertical stripes; can be corrected by comparing values of neighbouring pixels) and horizontal noise (easy to detect and correct using the horizontal profile of each file. Correction of noises can be made through DIELMO 3D Methodology. PROBA (Project for On-Board Autonomy) and CHRIS (Compact High Resolution Imaging Spectrometer) image was taken with characteristics: 18 bands, 07/10/2004, 17m ground resolution. To obtain a good-quality natural-coloured image of wetlands a need: nadir-taken colour CHRIS image with bands combination of corresponding spectral channels was selected and processed. Comparing images taken at +55° dgr (47A2_41) and nadir images (479F_41) right Images taken at the nadir are of good quality, while those at different angles have defects: Images taken at +36° dgr (47A0_41), left and nadir images (479F_41) right. Images taken at +36° and-36° (CHRIS 47A0_41 and CHRIS 47A1_41) both have inverted direction. Several bands were tried, processed and visualized. Spectral bands assessed and visually compared. This is a student poster as a part of MSc studies, University of Southampton.
Current poster presents a student assignment on Course: 'GEOG6038 Calibration and Validation of Earth Observation Data'. Study aim is image classification using ENVI GIS and remote sensing data aimed at national park area classification. Study area is Páramo National Park in Ecuador is known for its unique natural resources in high altitude grasslands. The ecosystems of Páramo consist mostly of rare species and are the key protected area for exceptionally high endemism. ENVI software enablesd to make an analysis of the area in 9 (nine) working steps and to produce a map based on 2 criteria: vegetation amount and altitude. Methodology includes following steps: 1) True-colour composite of the ETM+ image, bands 3,2,1; 2) Image contrast enhancement (Enhance-Gaussian); 3) SRTM-Data Upload to derive elevation model; 4) 3D surface visualization; 5) Calculating Greenness Index; 6) Creation Vegetation Layer ROI; 7) Creating Altitude Layer Zones by “Intersect Regions” for each pair of ROIs. Final altitude zones are: Lowland Vegetation (1-2500m), Subparamo Vegetation (2501-3500), Paramo Vegetation (3501-4100) and Superparamo Vegetation (4101 – 5000). These zones are shown on the map in different colors (yellow, beige, two greens) ; 8) Mapping and Design; 9) 3D-Mapping and DEM. The research was done as part of MSc studies at the University of Southampton, UK, autumn 2009.
Seagrass mapping and monitoring along the coast of Crete, GreeceUniversität Salzburg
Job interview for the Research Training Group (RTG) Baltic TRANSCOAST. topic ’B1: Impact of nutrient emissions from land on communities of macrophytes’. This research is presented at the job interview in the University of Rostock. Originally based on author's MSc thesis (2009-2011) summarizing research in marine observations using remote sensing and GIS methods. Study object is seagrass Posidonia oceanic (P. oceanica) along the coast of Crete, Greece. The most important facts about seagrass: endemic Mediterranean seagrass, P. oceanica is a main species in marine coastal environment of Greece. P. oceanica is the largest, the most widespread, homogeneous, dense “mattes” forming meadows between 5-40 m in Mediterranean Sea. Seagrass is a component of coastal ecosystems of high importance for the marine life, playing important functions in the marine environment. Seagrasses are subjects to external factors and therefore have environmental vulnerability. The study area is located in General research area: Island of Crete, Greece. Seagrass sampling will be performed at three stations at a depth of 6-7 m: Heraklio, Agia Pelagia, Xerokampos, Crete Island, Greece. The general research objectives of the MSc research includes GIS and environmental analysis: 1) Mapping the extent of the spatial distribution of seagrass P. oceanica along the northern coast of Crete; 2) Monitoring environmental changes in seagrass meadows in the selected fieldwork sites (Agia Pelagia, Xerokampos) over the 10-year period (2000-2010). There are various multi-sources data proposed for using in spatial analysis. data of the previous measurements received during the last year fieldwork, to analyze whether P.oceanica is spectrally distinct from other sea floor types, using differences in the spectral signatures on the graphs in a WASI, the Water Color Simulator software. Other data include satellite images from the open sources (Landsat TM), aerial images, Google Earth; underwater videographic measurements of 3 cameras Olympus ST 8000 made during the ship route (20 total in the selected areas of the research places) resulting in series of consequent images, covering area under the boat path; in-situ measurements of the seagrass in selected spots, using measurement frame and other devices for marine biological research for the validation of the results. Arc GIS vector layers of Crete island and surroundings (.shp files). Hypothesis testis is performed by ANOVA, SPSS. The results of WASI spectral analysis illustrating graphs of the spectral reflectance of different sea floor types (sand, P.oceanica, rocky, etc) at various depths (0.5-4 m), based on the results of 20. Precise, correct and up-to-date information about the seagrass distribution over the coasts is necessary for the sustainable conservation of marine environment.
Why Should We Stand for Geothermal Energy ? Example of the Negative Impacts o...Universität Salzburg
Geothermal energy is a clean, environmentally friendly, renewable resource that provides energy around the world. Heat flowing constantly from the interior of the Earth ensure to be an inexhaustible supply of energy. However, existing traditional sources of energy, such as oil and gas are still popular nowadays. Current paper gives an example of environmentally danger of these sources of energy. The given example of oil and gas operations within the shelf and the coast of the Barents Sea and Pechora Sea causes contamination of waters by phenol and its accumulation in the bottom sediments and life tissues of the marine habitants. At the same time, ecosystems of the south-eastern part of the Barents Sea and Pechora Sea are characterized by their high biodiversity and high level of primary production. The last one is the fundamental biological characteristics for the marine ecosystems meaning the formation of the organic substance in the water by the chlorophyll-contains organisms: phytoplankton. The primary production plays an exceptional role in the functionality of the marine ecosystem's components. Therefore, presentation gives some brief ideas on the importance of the 'green', eco-friendly sources of energy and a need for the constant development in the environmental protection of our planet. The presentation was given at the International Conference 'Geoenergy' in Grozny (Chechnya), Russia, 19 June 2015.
This presentation introduces research on using geoinformation technologies for education at universities. A case study is ArcGIS 9.1. Specifically, it presents a methodology of effective teaching of a group of students based on ArcGIS. Several ArcGIS modules are presented and their functionality reviewed and highlighted: ArcGIS Spatial Analyst, ArcScene, ModelBuilder, ArcMap, ArcCatalog. Technical questions of how to better explain students data processing, data converting and modelling using ArcGIS are discussed and better pedagogical solutions are proposed. The presentation also briefly reviews the advantages of using ArcGIS by different groups of students studying at various specializations: geomorphology, cadaster, hydrology, economic geography. In this way it is stressed that using a highly functional GIS software such as ArcGIS should be learned not only by cartographers but also to wider audience of students. Presented at Lomonosov Moscow State University, Faculty of Educational Studies as a graduation works for additional qualification 'University Teacher', Moscow, Russia, 2007. The presentation is given in Russian language with a TOC summary in English.
How could obligation chain be structured along cross-border gas supply for...Universität Salzburg
Research points: to measure components and linkages of legal obligations undertaken by the actors involving cross-border gas supply chain; to investigate possibility to establish a legal structure for promoting security of gas supply chain; to examine consequences of gas supply chain for government and companies; to analyze legal structures (international-domestic-contract law): entitlement vs. state responsibility as requirements for functioning/enforcing obligation chain.
The seminar presentation demonstrates research on land cover analysis in western Estonia. Study area is Pärnu region located on the western part of the country, along the coasts of Baltic Sea. The region is a valuable environmental part and a unique recreational area of Estonia. The presentation consists of two parts. The fist part presents technical workflow of the image processing by means of GIS and Lansat TM satellite imagery. Methodology is base don Arc GIS 10.0 and IDRISI GIS Andes 15.0 for image processing. The aim is to detect land cover changes using image classification by 'ISOCLUST'. Raster images processing and classification was applied for Landsat TM two images. The ISOCLUST is an unsupervised classification method in IDRISI GIS. It performs image processing workflow in semi-automatically regime. Results include 16 land cover types typical for the study area classified and visualized on the images. In 2006 the urban area became larger than in 1992 (land cover class "3" on the histogram. This can be explained by various reasons. Changes in land cover types in selected Estonian landscapes are shown on the statistical histograms on 1992 and 2006. The second part presents social analysis of the current development of tourism and recreation on Baltic Sea coasts with discussion of new directions and perspectives. Notable natural settings include mild marine climate condition and precious coniferous forests. Presentation briefly discusses historical development of the tourism in the country and gives directions on its modern development caused by active socio-economic changes since 1990s. The research is methodologically based on the author's fieldwork in the study area, literature review and analysis of the statistical graphs of the socio-economic data. The study presents photos of the Estonian landscapes.
Using K-means algorithm classifier for urban landscapes classification in Tai...Universität Salzburg
Current presentation summarizes spatial analysis studies of Taipei urban growth using ENVI GIS based image classification. The presentation consists in two parts. The first part describes the city, urban and social settings and gives a brie history of the development in 20th century. The second part is focused don the GIS based technical description of the algorithms of image analysis: classification of the multi-temporal Landsat TM series of the selected stud area of Taipei, Taiwan. Methodology aims at spatio-temporal analysis of urban dynamics in study area during 15 years (1990-2005). Research objective: application of geoinformatic tools, remote sensing data and application of methodology to spatial analysis for urban studies, a case study of Taipei. Current presentation consists in 2 parts: 1) Overview of the environmental research problem, urbanization and characteristics of Taipei. Consequences of urban sprawl for the global cities, such as Taipei; 2) Detailed technical description of the GIS part: remote sensing data capture, pre-processing, algorithm processing, image classification and spatial analysis. The spatial analysis performed by means of GIS ENVI enabled to use satellite images for social and urban studies. The spatio-temporal analysis was applied to Landsat TM images taken at 1990 and 2005. Built-in functions of the mathematical algorithms (K-means) enabled to process raster Landsat TM images and to derive information from them.
Rural Sustainability and Management of Natural Resources in Tian Shan Region,...Universität Salzburg
Current presentation introduces an analysis of the land use and current environmental situation of the Tian Shan region. Tian Shan (the ’Celestial Mountains’) is the largest high mountain systems (800,000 km2) in the World. geopolitically, Tian Shan is located in the heart of Central Asia. It crosses five densely populated countries: China, Kazakhstan, Kyrgyzstan, Uzbekistan and Tajikistan. Tian Shan regions has unique ecosystems, Shrenk mountain forests and endemic species. Tian Shan is composed by large, isolated mountains, surrounded by the Tarim desert basin of north-western China, Lake Issyk Kul and deserts of Uzbekistan and Kazakhstan. Tian Shan region is outstanding for the richness of natural resources, landscapes and ecosystems. Rare species: ca 70\% of species (both animal and plants) have specific south Asian distribution, typical for steppe and desert ecosystems. The ecosystems include numerous protected and rare species (over 4000 wild species), relicts and endemics, unique coniferous forests, rich biodiversity. The slopes of the Tian Shan mountains at altitudes 2000 to 3000m are mostly covered by precious coniferous forests of Schrenk’s Spruce (Picea schrenkiana), recorded in the International Union for Conservation of Nature (IUCN) Red List of Threatened Species. At the same time, the region has environmental problems such as overgrazing, deforestation, decreased species composition, soil depletion and erosion, desertification and land degradation. Current presentation demonstrates and discusses these problems.
Mapping Agricultural Lands by Means of GIS for Monitoring Use of Natural Reso...Universität Salzburg
The presentation demonstrates a technical case study of the image processing by ILWIS GIS. Study area is located in the southwestern, agricultural part of Hungary (Mecsek Hills foothill area). The landscapes of the Mecsek region represent a unique part of the Hungarian environment belonging to the Carpathian basin. However, changes in the land cover types were detected recently caused by various environmental reasons. Study aim was to compare changes in the land cover types and landscape dynamics. 3 Landsat TM images have a temporary gap of 14 years (1992-2006). The gap aimed to assess vegetation changes in the summer months (June). The study includes following methodological steps: 1) Data collection: 3 Landsat TM images; 2) Data import and conversion. 3) Data preprocessing: scenes of 1992, 1999 and 2006. 4) Making color composites from 3 Landsat TM spectral channels (multi-band layers). 5) Image segmentation and classification (clustering). 6) GIS mapping and spatial analysis. 7) Google Earth snapshot verification. 8) Results interpretation. Results analysis shown changes in the selected area detected by ILWIS GIS image classification.
Seagrass Mapping and Monitoring Along the Coasts of Crete, GreeceUniversität Salzburg
This research proposal introduces MSc thesis research. Study object is seagrass Posidonia oceanic (P. oceanica) along the coast of Crete, Greece. The most important facts about seagrass: endemic Mediterranean seagrass, P. oceanica is a main species in marine coastal environment of Greece. P. oceanica is the largest, the most widespread, homogeneous, dense “mattes” forming meadows between 5-40 m in Mediterranean Sea. Seagrass is a component of coastal ecosystems of high importance for the marine life, playing important functions in the marine environment. Seagrasses are subjects to external factors and therefore have environmental vulnerability. The study area is located in General research area: Island of Crete, Greece. Seagrass sampling will be performed at three stations at a depth of 6-7 m: Heraklio, Agia Pelagia, Xerokampos, Crete Island, Greece. The general research objectives of the MSc research includes GIS and environmental analysis: 1) Mapping the extent of the spatial distribution of seagrass P. oceanica along the northern coast of Crete; 2) Monitoring environmental changes in seagrass meadows in the selected fieldwork sites (Agia Pelagia, Xerokampos) over the 10-year period (2000-2010). There are various multi-sources data proposed for using in spatial analysis. data of the previous measurements received during the last year fieldwork, to analyze whether P.oceanica is spectrally distinct from other sea floor types, using the differences in the spectral signatures on the graphs in a WASI, the Water Color Simulator software. Other data include satellite images from the open sources (Landsat TM), aerial images, Google Earth; underwater videographic measurements of 3 cameras Olympus ST 8000 made during the ship route (ca 20 total in the selected areas of the research places) resulting in series of consequent images, completely covering the area under the boat path; in-situ measurements of the seagrass in selected spots, using measurement frame and other devices for marine biological research for the validation of the results. Arc GIS vector layers of Crete island and surroundings (.shp files). Hypothesis testis is formulated for the proposed research, questions defined, methods prepared and planned. The research work is expected to have following results : Over the northern coasts of Crete: thematic maps showing seafloor types and seagrass P.oceanica spatial distribution along the coasts of Crete. Within the fieldwork locations, Ligaria beach: monitoring the environmental changes, based on the classification of the satellite and aerial imagery and fieldwork video camera footage. Within the fieldwork locations : maps of the sea floor cover types, based on the fieldwork measurements and UVM. Results of the WASI spectral analysis illustrating graphs of the spectral reflectance of different sea floor types (sand, P.oceanica, rocky, etc) at various depths (0.5-4 m), based on the results of 20.Precise, correct and up-to-date information about th
Data Sharing, Distribution and Updating Using Social Coding Community Github ...Universität Salzburg
The presentation introduces using LaTeX and GitHub for data sharing, distribution and updating in graduate research. The questions of using, advantages and functionality of GitHub, a web-service for hosting (i.e. serving and maintenance) of IT-projects online, are discussed and screenshots of the projects are presented. The main advantages in using GitHub consists in the fact that Github allows control latest changes, discuss and discuss work with students, post comments into the text using syntax coloring add online comments. This enables to effectively collaborate for a group of students of to supervise a research thesis. Technical illustrations of the git config command of GitHub area presented. Command ’git init’ is an initiation of the project from scratch. Command ’git add files’ - selecting all files for the project. (texts, tables, graphs, maps, figures). Advantages of LaTeX for thesis writing consists in its a built-in flexible system of bibliographic cross-referencing in the list of references, which enables making automatic linking to the bib sources, as well as updating links. Examples of structuring text in a thesis by LaTeX and GitHub are presented. Mark up language was used to highlight text when writing codes with a high level of nesting, allowing to quickly navigate over the work. The presentation has a technical and methodological character and introduces using IT tools, GitHub and LaTeX in academic environments.
…
Seagrass Mapping and Monitoring Along the Coasts of Crete, Greece. MSc Thesis...Universität Salzburg
Current presentation introduces a MSc thesis defense. The research focuses on the P. oceanica, an endemic species of the seagrass in Mediterranean Sea. Study area is Crete Island, Greece. The goal of this study is to analyse optical properties of the seagrass P. oceanica and other seafloor types (carbonate sand), and to apply remote sensing techniques for seagrass mapping in the selected locations of northern Crete. Analyzing spectral reflectance of the P. oceanica and other seafloor cover types by means of tools Radiative Transfer Model (RTM) using Water Color Simulator (WASI). Other technical tools included ArcGIS and Erdas Imagine GIS software, Gretle for plotting and statistical analysis, SPSS for ANOVA based Hypothesis testing. Data include spectral measurements of the seagrass optical properties by Trios-RAMSES (Hyperspectral radiometers for measuring optical properties of water), Google Earth aerial images, Landsat TM scenes. Fieldwork measurements were done using iPAQ data and GPS records, SCUBA equipment. Optical properties of the water columns were tested : spectral reflectance, radiance, irradiance. Characteristics reflect current chemical content and physical specifics of the water with and without sediments. Results of this research proved that P. oceanica is spectrally distinct from other seafloor types (carbonate sand) at varying environmental conditions, as well as from other seagrass species (Thalassia testudinum). The RTM software is a useful tool for analyzing spectral signatures of various seafloor types enabling simulations of data received from the broadband and narrowband remote sensors. Application of the RS data from the broadband sensors is highly advantageous for the seagrass mapping. Spectral discrimination of P. oceanica from other seafloor cover types is possible at diverse and changing environmental conditions (water column height). Maps, graphics and imagery are provided. Current presentation contains 72 slides. Defended at University of Twente, Faculty of Earth Observation and Geoinformation (ITC), Enschede, Overijssel Province, the Netherlands on March 8, 2011.
Professional air quality monitoring systems provide immediate, on-site data for analysis, compliance, and decision-making.
Monitor common gases, weather parameters, particulates.
Seminar of U.V. Spectroscopy by SAMIR PANDASAMIR PANDA
Spectroscopy is a branch of science dealing the study of interaction of electromagnetic radiation with matter.
Ultraviolet-visible spectroscopy refers to absorption spectroscopy or reflect spectroscopy in the UV-VIS spectral region.
Ultraviolet-visible spectroscopy is an analytical method that can measure the amount of light received by the analyte.
THE IMPORTANCE OF MARTIAN ATMOSPHERE SAMPLE RETURN.Sérgio Sacani
The return of a sample of near-surface atmosphere from Mars would facilitate answers to several first-order science questions surrounding the formation and evolution of the planet. One of the important aspects of terrestrial planet formation in general is the role that primary atmospheres played in influencing the chemistry and structure of the planets and their antecedents. Studies of the martian atmosphere can be used to investigate the role of a primary atmosphere in its history. Atmosphere samples would also inform our understanding of the near-surface chemistry of the planet, and ultimately the prospects for life. High-precision isotopic analyses of constituent gases are needed to address these questions, requiring that the analyses are made on returned samples rather than in situ.
Earliest Galaxies in the JADES Origins Field: Luminosity Function and Cosmic ...Sérgio Sacani
We characterize the earliest galaxy population in the JADES Origins Field (JOF), the deepest
imaging field observed with JWST. We make use of the ancillary Hubble optical images (5 filters
spanning 0.4−0.9µm) and novel JWST images with 14 filters spanning 0.8−5µm, including 7 mediumband filters, and reaching total exposure times of up to 46 hours per filter. We combine all our data
at > 2.3µm to construct an ultradeep image, reaching as deep as ≈ 31.4 AB mag in the stack and
30.3-31.0 AB mag (5σ, r = 0.1” circular aperture) in individual filters. We measure photometric
redshifts and use robust selection criteria to identify a sample of eight galaxy candidates at redshifts
z = 11.5 − 15. These objects show compact half-light radii of R1/2 ∼ 50 − 200pc, stellar masses of
M⋆ ∼ 107−108M⊙, and star-formation rates of SFR ∼ 0.1−1 M⊙ yr−1
. Our search finds no candidates
at 15 < z < 20, placing upper limits at these redshifts. We develop a forward modeling approach to
infer the properties of the evolving luminosity function without binning in redshift or luminosity that
marginalizes over the photometric redshift uncertainty of our candidate galaxies and incorporates the
impact of non-detections. We find a z = 12 luminosity function in good agreement with prior results,
and that the luminosity function normalization and UV luminosity density decline by a factor of ∼ 2.5
from z = 12 to z = 14. We discuss the possible implications of our results in the context of theoretical
models for evolution of the dark matter halo mass function.
A brief information about the SCOP protein database used in bioinformatics.
The Structural Classification of Proteins (SCOP) database is a comprehensive and authoritative resource for the structural and evolutionary relationships of proteins. It provides a detailed and curated classification of protein structures, grouping them into families, superfamilies, and folds based on their structural and sequence similarities.
(May 29th, 2024) Advancements in Intravital Microscopy- Insights for Preclini...Scintica Instrumentation
Intravital microscopy (IVM) is a powerful tool utilized to study cellular behavior over time and space in vivo. Much of our understanding of cell biology has been accomplished using various in vitro and ex vivo methods; however, these studies do not necessarily reflect the natural dynamics of biological processes. Unlike traditional cell culture or fixed tissue imaging, IVM allows for the ultra-fast high-resolution imaging of cellular processes over time and space and were studied in its natural environment. Real-time visualization of biological processes in the context of an intact organism helps maintain physiological relevance and provide insights into the progression of disease, response to treatments or developmental processes.
In this webinar we give an overview of advanced applications of the IVM system in preclinical research. IVIM technology is a provider of all-in-one intravital microscopy systems and solutions optimized for in vivo imaging of live animal models at sub-micron resolution. The system’s unique features and user-friendly software enables researchers to probe fast dynamic biological processes such as immune cell tracking, cell-cell interaction as well as vascularization and tumor metastasis with exceptional detail. This webinar will also give an overview of IVM being utilized in drug development, offering a view into the intricate interaction between drugs/nanoparticles and tissues in vivo and allows for the evaluation of therapeutic intervention in a variety of tissues and organs. This interdisciplinary collaboration continues to drive the advancements of novel therapeutic strategies.
Risks of Cryogenic Landslide Hazards and Their Impact on Ecosystems in Cold Environments
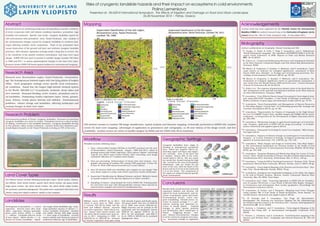
1. Risks of cryogenic landslide hazards and their impact on ecosystems in cold environments
Polina Lemenkova
Presented at: IRLA2014 International Symposium. The Effects of Irrigation and Drainage on Rural and Urban Landscapes.
26-28 November 2014 | Patras, Greece
Abstract
Research focuses on monitoring landscapes downgrading in specific conditions
of Arctic ecosystems with cold climate conditions (marshes, permafrost, high
humidity and moisture). Specific case study: cryogenic landslides typical for
cold environments with permafrost. Area: Yamal Peninsula. Aim: analysis of
the environmental changes caused by cryogenic landslides in northern land-
scapes affecting sensitive Arctic ecosystems. Thaw of the permafrost layer
causes destruction of the ground soil layer and activates cryogenic landslide
processes. After disaster, vegetation coverage needs a long time to recover, due
to the sensitivity of the specific northern environment, and land cover types
change. ILWIS GIS was used to process 2 satellite images Landsat TM taken
at 1988 and 2011, to assess spatiotemporal changes in the land cover types.
Research shown ILWIS GIS based spatial analysis for environmental mapping.
Research Area
Research area: Bovanenkovo region, Yamal Peninsula. Geomorphol-
ogy: flat homogeneous lowland region with low-lying plains of heights
<90m. Such geographic settings create specific local environmen-
tal conditions. Yamal has the largest high-latitude wetland system
in the World: 900,000 km2 of peatlands, wetlands, dense lakes and
river network. Seasonal flooding, active erosion, permafrost and lo-
cal landslides. Dominating tundra vegetation types: heath, grasses,
moss, lichens, woody plants (shrubs and willows). Environmental
problems: climate change and landslides, affecting landscapes and
causing changes in land cover types.
Research Problem
Environmental problem of Yamal: cryogenic landslides. Processes of superficial
cryogenic landslides are active in tundra. Permafrost serves as a shear surface
for sliding, contributes to the landslide formation. Cryogenic landslides develop
on fine-grained, saline marine sediments: common destructive disastrous geo-
morphological hazards on the Yamal Peninsula covering ca 70% of the area.
Land Cover Types
The defined classes include following landscapes types: shrub tundra, willows,
tall willows, short shrub tundra, sparse short shrub tundra, dry grass heath,
sedge grass tundra, dry short shrub tundra, dry short shrub sedge tundra,
wet peatland, peatland (sphagnum). The pixels were associated with land cover
classes using their digital numbers, similar to key samples.
Landslides
Development of permafrost => scarce
vegetation. Several years after land-
slides, vegetation changes gradually:
grass, moss, lichen, shrub => sedge
=> willows. Landslide-affected areas
of bare slopes: willow shrubs => in-
dicator for former landslides. Vegeta-
tion stages show landslides age: early-
stage (primitive mosses or lichen) =>
recent landslide formation; meadow
and willow shrubs with high canopy
=> final stage of landslides. Ground
waters salinity and chemical content of
sediments indicates age of landslides.
Mapping
GIS method consists in Landsat TM image classification, spatial analysis and thematic mapping, technically performed in ILIWIS GIS. Landsat
scenes for land cover mapping: advantages of application in geosciences and cartography, ca 40 year history of the image record, and free
availability. Landsat scenes are series of satellite imagery by NASA and the USGS with 30-m resolution.
Workflow
Workflow includes following steps:
1. Data: orthorectified Landsat TM files in GeoTIFF acquired over the area
of Bovanenkovo, Yamal Peninsula. Images: 1988 and 2011, taken in
growing season with visible vegetation. Data capture, import, converting
.img file into ASCII raster format (GDAL). After converting, each image
contained collection of 7 Landsat raster bands.
2. Data pre-processing: Enhancement of visual color and contrast. Geo-
graphic referencing of Landsat TM: setting UTM projection, E Zone 42,
N Zone W, WGS 1984 datum (Georeference Corner Editor).
3. Area Of Interest (AOI) was identified and cropped on raw images This
area shows region in a large scale which represents tundra landscapes.
4. Supervised Classification by Minimal Distance method. Method is based
on spatial analysis of the spectral signatures of object variables.
5. Sampling of classes: using Sample Set tool in ILWIS GIS. Training pixels
for each land cover type with distinguishable contrast colors selected as
representative samples and stored as classification key.
Results
Willows covers 2750,57 ha in 2011,
which is more than in 1988, when
it covered 1547,52 ha (both ’tall wil-
lows’ and ’willows’ classes). Increase
in tundra vegetation: ’short shrub tun-
dra’, ’sparse short shrub tundra’ and
’dry short shrub tundra’ have more ar-
eas in 2011 comparing to 1988: ca
5442,00 ha vs 1823,00 ha. Increase
of wooden vegetation class goes along
with shrunk of grass and heath areas:
’dry grass heath’ had area of 3335.39
ha in 1988, now covers 1204.94 ha.
Slight decrease can be noticed in the
’peatlands’ and ’wet peatlands’ classes
3958.40 ha against 2765.41 ha in
2011 by ’wet peatlands’, and 625.71
ha in 1988 vs 488.69 ha by ’peatland
(sphagnum)’ class.
Geographic Settings
Cryogenic landslides have origin in
thawing of underground permafrost
layer, which has negative effects de-
structing upper soil layer and vegeta-
tion coverage. Area of the Kara Sea
is shallow: almost 40% of the conti-
nental shelf is <50 m. The sea coasts
are mostly flat, flooded during the high
tide. Located in the area of permafrost
distribution, soils are frozen for the
most of the year, with the depth of the
frozen soil up to 0.2 m in the north and
2 m in the south. The ecosystems of
the region are adapted towards specific
Arctic environment.
Conclusions
Results show overall increase of woody
vegetation (willows and shrubs), not
typical for local environment, and de-
crease of peatlands, grass and heath.
Environmental factors: active cryo-
genic landsliding. Climatic factor: in-
crease of annual average T => per-
mafrost thawing and abnormal in-
crease of woody plants. Gradual
changes in plant species patterns
and distribution affect landscapes in
Yamal. Triggering factors: com-
plex climatic-environmental changes
in Arctic and local cryogenic processes,
e.g. successive change in vegetation
recovering after cryogenic landslides.
Acknowledgements
Current work has been supported by the Finnish Center for International
Mobility (CIMO) for author’s research stay at the University of Lapland, Arctic
Center (Grant No. TM-10-7124), during 01 July - 31 December 2011.
Bibliography
Author’s publications on Geography, Remote Sensing and GIS:
1
S. Gauger, G. Kuhn, K. Gohl, T. Feigl, P. Lemenkova, and C. Hillenbrand,
“Swath-bathymetric mapping”, The expedition ANTARKTIS-XXIII/4 of the Re-
search Vessel ’Polarstern’ in 2006. Reports on Polar and Marine Research
557, 38–45 (2007).
2
K. Gohl et al., Crustal and Sedimentary Structures and Geodynamic Evolution
of the West Antarctic Continental Margin and Pine Island Bay (Bremerhaven,
Germany, 2006).
3
M. Klauˇco, B. Gregorová, U. Stankov, V. Markovi´c, and P. Lemenkova, “Land-
scape metrics as indicator for ecological significance: assessment of Sitno
Natura 2000 sites, Slovakia”, in Ecology and environmental protection, Pro-
ceedings of International Conference (2014), pp. 85–90.
4
M. Klauˇco, B. Gregorová, U. Stankov, V. Markovi´c, and P. Lemenkova, “De-
termination of ecological significance based on geostatistical assessment: a
case study from the Slovak Natura 2000 protected area”, Central European
Journal of Geosciences 5, 28–42 (2013).
5
G. Kuhn et al., The response of quaternary climatic cycles in the South-East Pa-
cific: development of the opal belt and dynamics behavior of the West Antarctic
ice sheet (Bremerhaven, Germany, 2006).
6
P. Lemenkova, “Cost-Effective Raster Image Processing for Geoecological Anal-
ysis using ISOCLUST Classifier: a Case Study of Estonian Landscapes”, in
Modern problems of geoecology and landscapes studies (2014), pp. 74–76.
7
P. Lemenkova, “Rural Sustainability and Management of Natural Resources
in Tian Shan Region, Central Asia”, in Celebrating pastoral life. heritage and
economic development (2014), pp. 81–89.
8
P. Lemenkova, “Opportunities for Classes of Geography in the High School:
the Use of ’CORINE’ Project Data, Satellite Images and IDRISI GIS for Geovi-
sualization”, in Perspectives for the Development of Higher Education (2014),
pp. 284–286.
9
P. Lemenkova, “Monitoring changes in agricultural landscapes of Central Eu-
rope, Hungary: application of ILWIS GIS for image processing”, in Geoinfor-
matics: theoretical and applied aspects (2013).
10
P. Lemenkova, “Geospatial Technology for Land Cover Analysis”, MEA Geospa-
tial Digest (2013).
11
P. Lemenkova, “Impacts of Climate Change on Landscapes in Central Europe,
Hungary”, in Current Problems of Ecology, Ecological monitoring and man-
agement of natural protection, Vol. 2 (2012), pp. 134–136.
12
P. Lemenkova, “Water Supply and Usage in Central Asia, Tian Shan Basin”,
in 4th International Symposium for Doctoral studies in the Fields of Civil
Engineering, Architecture & Environmental Protection (PhiDAC-2012) (Sept.
2012), pp. 331–338.
13
P. Lemenkova, “Seagrass Mapping and Monitoring Along the Coasts of Crete,
Greece”, M.Sc. Thesis (University of Twente, Faculty of Earth Observation and
Geoinformation (ITC), Enschede, Netherlands, Mar. 8, 2011), 158 pp.
14
P. Lemenkova, “Using ArcGIS in Teaching Geosciences”, Russian, B.Sc. Thesis
(Lomonosov Moscow State University, Moscow, Russia, June 5, 2007), 58 pp.
15
P. Lemenkova, “Geoecological Mapping of the Barents and Pechora Seas”, Rus-
sian, B.Sc. Thesis (Moscow, Russia, 2004), 78 pp.
16
P. Lemenkova, Ecological and Geographical Mapping of the Baltic Sea Region
in the Gulf of Finland, Russian, Moscow, Russia: Lomonosov Moscow State
University, Mar. 30, 2002, Term Paper.
17
P. Lemenkova and I. Elek, “Clustering Algorithm in ILWIS GIS for Classifica-
tion of Landsat TM Scenes: a Case Study of Mecsek Hills Region, Hungary”,
in Geosciences and environment, Near-surface geophysics, Proceedings 3rd
International Conference (2012).
18
P. Lemenkova, B. Forbes, and T. Kumpula, “Mapping Land Cover Changes
Using Landsat TM: A Case Study of Yamal Ecosystems, Arctic Russia”, in
Geoinformatics: theoretical and applied aspects (2012).
19
H. W. Schenke and P. Lemenkova, “Zur Frage der Meeresboden-
Kartographie: Die Nutzung von AutoTrace Digitizer für die Vektorisierung
der Bathymetrischen Daten in der Petschora-See”, German, Hydrographische
Nachrichten 25, 16–21 (2008).
20
I. Suetova, L. Ushakova, and P. Lemenkova, “Geoecological Mapping of the
Barents Sea Using GIS”, in International Cartographic Conference (ICC)
(2005).
21
I. Suetova, L. Ushakova, and P. Lemenkova, “Geoinformation mapping of the
Barents and Pechora Seas”, Geography and Natural Resources 4, 138–142
(2005).