
Recommended
Recommended
More Related Content
What's hot
What's hot (20)
Similar to From global to regional scale: Remote sensing-based concepts and methods for mapping land-cover and land-cover change in tropical regions
Similar to From global to regional scale: Remote sensing-based concepts and methods for mapping land-cover and land-cover change in tropical regions (20)
More from Repository Ipb
More from Repository Ipb (20)
Recently uploaded
Recently uploaded (20)
From global to regional scale: Remote sensing-based concepts and methods for mapping land-cover and land-cover change in tropical regions
- 1. From global to regional scale: Remote sensing-based concepts and methods for mapping land-cover and land-cover change in tropical regions Stefan Erasmi1∗ , Martin Kappas1 , Andr´e Twele1 , and Muhammad Ardiansyah2 1 Institute of Geography, Department of Cartography, GIS and Remote Sensing, University of G¨ottingen, Goldschmidtstr. 5, 37077 G¨ottingen, Germany 2 Institute of Soil Sciences, Bogor Agricultural University (IPB), Bogor, Indonesia *corresponding author: Stefan Erasmi, phone: +49 (0)551 398003, fax: +49 (0)551 398020, Email: serasmi@uni-goettingen.de Summary A great number of studies have been dealing with land-cover mapping of tropical regions using earth remote sensing technology recently. This is partly due to a growing number of operational sensor systems for both scientific and commercial use and also because of an increasing demand for land-cover information relevant to global environmental issues and international policy instruments (e.g. the Kyoto protocol). Within this context, the present article discusses the state of the art of data processing and analysis for the assessment of broad scale land-cover and land-cover change in tropical regions. Current global scale land-cover maps are compared with regional satellite mapping products (Landsat/ETM+) for a test region in the humid tropics of Central Sulawesi, Indonesia. The paper suggests the land cover classification system (LCCS) to be used as the conceptual basis for future land-cover analysis in Sulawesi because it delivers a consistent and comparable scale-independent class structure for satellite image-based land-cover mapping and monitoring. The results of the comparative analysis of land-cover and land-cover change document the in- homogeneity, inconsistency and hence high uncertainty of existing estimates. The outcome of the harmonized and generalized land-cover products for two base years (1992 and 2000) indicates considerable disagreements in area esti- mates and spatial distributions of land-cover classes for a single date that in some cases exceed the detectable changes between years. Tscharntke T, Leuschner C, Zeller M, Guhardja E, Bidin A (eds), The stability of tropical rainforest margins, linking ecological, economic and social constraints of land use and conservation, Springer Verlag Berlin 2007, pp 437-462
- 2. 436 S. Erasmi et al. Future work aiming at a long-scale operational land-cover mapping of trop- ical environments has to account for (a) a further harmonization of existing and planned land-cover definitions and products, (b) the regional validation of products and (c) the implementation of a multi-level standardized technical and conceptual classification workflow for ecosystem mapping and monitoring in tropical regions. Keywords: land-cover, change detection, tropical ecosystems, MODIS, AVHRR, VEGETATION, LCCS, GLC2000 1 Introduction Since the early 1980ies, information about land-cover has been recognized as being of utmost importance for the description and study of the environment (Watson et al. 2000). The main variable defining primary productivity and biodiversity of a land surface is the type of land-cover (Turner et al. 2005). Land-cover is the easiest detectable indicator of human interventions on the land and is a critical parameter for environmental databases of any kind. Tremendous advances were made during the 1980ies in the use of remote sensing data to support research related to global change and sustainabil- ity. Land-use and land-cover change (LUCC) has become a key topic within global change research programs. The first international research program con- cerned with this topic was the International Geosphere-Biosphere Programme (IGBP). IGBP and ISCC (International Social Science Council) started up a core project on LUCC (Turner et al. 1995) that combined environmental and social science expertise in land-cover and land-use change analysis. After that, other programs funding research on land-use and land-cover such as the IAI (Inter-American Institute for Global Change Research), APN (Asian-Pacific Network for Global Change Research), START (Global Change System for Analysis, Research and Training), and GCTE (Global Change in Terrestrial Ecosystems) were initiated. Complementary to LUCC and GCTE, NASA de- veloped its own land-cover and land-use change research program (NASA- LCLUC). Each of these programmes identifies land-use and land-cover change as the prior research topic (Townsend et al. 1994). The LUCC and GCTE core projects ended in 2005 but have been continued within the integrated “Global Land Project (GLP)” of the IGBP which aims at the identification, analy- sis and modelling of the character, causes and consequences of land system change (GLP 2005). Tropical land-cover, especially the extent of tropical forests and the rate of deforestation, are of particular interest in environmental and socio-economical studies dealing with land-cover and land-use change. This can be documented by three major facts. 1) The tropical land surface is home to more than 55 % of the global human population (UN 2005) and hence human activities re- lated to land-use, commercial structure and social structure constitute the ma-
- 3. Land-cover mapping in tropical regions 437 jor driving forces of tropical deforestation; 2) Tropical ecosystems harbour a high biodiversity and thus deforestation and land-cover conversion contribute greatly to genetic erosion in tropical regions; 3) Tropical forests comprise a major terrestrial carbon sink and thus tropical deforestation contributes to global warming issues. In summary, the determination of reliable land-cover information constitutes a key input to any kind of spatially explicit analysis and scenario contributing to of one of these topics. Several efforts to map land-cover in the tropics and monitor changes of forest cover have been undertaken in the past. Besides the problem of accu- rate assessment, these studies are not directly comparable due to differences in processing and analysis methods, land-cover class definitions and classification concepts. Another disadvantage of recent global land-cover maps (GLC2000, MODIS-IGBP) is the coarse resolution of 1 km2 / pixel. This restricts the min- imum detectable area of change and leads to mixed land-cover types resulting in a significant information loss especially in small-scaled heterogeneous land- scapes that are common in Southeast Asia. This paper deals with the problem of reliable and up-to-date spatially explicit information on land-cover and land-cover change in tropical regions. The introductory chapters provide an overview of the broad range of existing concepts for land-cover change analysis. Furthermore, a review of the most widely used and implemented techniques of image pre-processing, land-cover mapping and change analysis is given. In chapter 6 we present results of a re- gional study of land-cover monitoring in Central Sulawesi, Indonesia. Within this study different land-cover products are compared with regard to area estimates of land-cover and cover change for the base years 1992 and 2000. The comparison is based on area statistics and spatial distribution of harmo- nized and aggregated land-cover types. The quality of the global products is investigated by cross comparison with higher level land-cover products. The comparison delivers valuable information about the potential of coarse-scale mapping products for ecological and socioeconomic modeling and scenario analysis in tropical forest margin areas. 2 Basic principles of land-cover mapping and change detection 2.1 Concepts of land-cover characterization Land-cover is defined as “the observed physical and biological cover of the Earth s land, as vegetation or man-made features” (Watson et al. 2000). In contrast, land-use describes the activities that people undertake in a certain land cover type (FAO 2003) and thus comprises a major driving factor of land-cover change (Meyer and Turner 1994). In principle, land-cover mapping from satellite data is related to the amount of radiation that is recorded by a sensor on a platform in space for a
- 4. 438 S. Erasmi et al. Table1:Land-coverclassesofIGBPandLCCSlegendsforinsularSouth- eastAsia IGBPclassLCCSclass EvergreenNeedleleafForestForestcover,broadleaved,evergreen,closedandclosedtoopen EvergreenBroadleafForestForestcover,broadleaved,deciduous,mainlyopen(incl.DryDiptero- carpus) DeciduousNeedleleafForest– DeciduousBroadleafForest– MixedForestsMosaic:Forestcover/Othernat.vegetationorCropland(incl.very degradedandopentreecover) ClosedShrublandsMosaicsandShrubCover,shrubcomponentdominant,mainlyever- green OpenShrublandsMosaicsandShrubCover,shrubcomponentdominant,mainlydecidu- ous WoodySavannasShrubcover,mainlydeciduous,(Dryorburnt) SavannasShrubcover,mainlydeciduous,(Dryorburnt) GrasslandsHerbaceousCover(incl.alpinegrassland) Sparseherbaceouscover>3000m PermanentWetlandsTreecover,regularlyflooded,Mangrove Treecover,regularlyflooded,Swamp CroplandsCultivatedandmanaged,nonirrigated(mixed) Cultivatedandmanaged,irrigated(flooded,rice,shrimpfarms) Cropland/NaturalVegetationMosaicMosaicsofCropland/Othernaturalvegetation BarrenorSparselyVegetatedBareAreas(Rock:Limestone) UrbanandBuilt-UpArtificialsurfaces WaterBodiesWaterBodies
- 5. Land-cover mapping in tropical regions 439 certain area on the ground. Data acquisition is followed by processing, analysis and product generation (e.g. land-cover maps). However, each of these steps differs fundamentally between different environmental studies, even when they are carried out on the same region and / or topic. The first major efforts on land-cover mapping at the global to regional scale using earth observing data were initiated by the IGBP in 1990. These activities were driven by the need for information on the distribution of veg- etation types and the disturbance of vegetation cover for climate and carbon cycle dynamics studies. The IGBP land-cover mapping studies were based on data from the Advanced Very High Resolution Radiometer (AVHRR) with a nominal resolution of 1 km and covered the period between 1992 and 1993. These data were processed to a global land-cover map and are available to the public (IGBP DISCover). A globally consistent land-cover legend was first defined by Running et al. (1994) and subsequently refined by IGBP core projects (Loveland et al. 2000). It consists of 17 classes and is currently used for the DISCover dataset as well as for present large scale land-cover maps such as the products of the Moderate Resolution Imaging Spectroradiometer (MODIS) land discipline group (Friedl et al. 2002). Another approach to land-cover description is the Land-cover Classifica- tion System (LCCS) of the UN Food and Agricultural Organization (FAO) (Di Gregorio and Jansen 2000). LCCS is not based on a predefined list of class names, but instead uses a simple set of attributes and classifiers that are organized in a hierarchical manner (Bartholom´e and Belward 2005). In the first stage of class characterization LCCS uses classifiers that describe the presence of vegetation, the edaphic condition and the nature of ground cover. The results of this “dichotomous phase” are eight land-cover classes (Di Gregorio and Jansen 2000). In the second stage, the modular-hierarchical phase of LCCS, the classes are further subdivided, based on environmental attributes (e.g. life form, land form, climate) and technical specifications (e.g. crop type). In this manner, the LCCS offers high flexibility to the user to de- scribe and classify land-cover features at any desired scale and level of detail. Each of the classifiers and attributes that are used for the generation of a single land-cover class is associated with a unique code and thus every class is explicitly identifiable and is assigned a standard name by the classification system. The system offers the possibility to describe land-cover categories at a high level of detail, but also allows for the generalization and upscaling of complex land-cover maps to national or global levels. LCCS has been applied to the maps of the Global Land-cover project (GLC2000) and also forms the conceptual basis for the class descriptions of the forthcoming Medium Resolution Imaging Spectroradiometer (MERIS) land- cover product GLOBCOVER. The GLC2000 legend is scale-dependent. At the global scale, it consists of 22 general land-cover types that are defined at the biome level. The legend for Southeast Asia contains 16 classes that inherit features of the major classes while classes that are not prevalent in the tropical biome are neglected. According to Bartholom´e and Belward (2005),
- 6. 440 S. Erasmi et al. the classes at the global level provide compatibility with maps that are based on the IGBP classification system. This means that any regional product that is based on the LCCS system can be compared to IGBP-based land-cover maps. In practice, this compatibility is not fully accomplished due to some inconsistencies in class definitions (see table 1 for a comparison of LCCS and IGBP legends). A workaround for the comparison of land-cover products that are based on different classification systems is the aggregation of the land- cover classes in two systems to a set of major land-cover types at the biome level (Giri et al. 2005). Table 2 provides an overview of current and planned land-cover products covering insular Southeast Asia. These maps can be grouped into two cate- gories: 1) maps based on global AVHRR data that have been generated during the 1990ies and use 1992 as the base year and 2) products for the base year 2000 from MODIS and VEGETATION using different classification concepts. In addition, table 2 includes the forthcoming GLOBCOVER product that is based on Envisat/MERIS. The year 2000 has been chosen as a benchmark for environmental, ecological and economic long-term analysis. The comparison of the land-cover product characteristics points to the general problem of in- consistency and thus incomparability between products that are generated by different workgroups. In addition to these products, the land-cover of insular Southeast Asia or its sub-regions are subject to a number of studies aiming at the characterization and delineation of land-cover types at the global to regional level (Sato and Tateishi 2004, Mayaux et al. 1998, Stibig et al. 2003) 2.2 Concepts of land-cover change analysis All over the world terrestrial ecosystems are changing at multiple spatial and temporal dimensions. In the context of land-cover, change is defined as the “alteration of the physical or biotic nature of a site”. As an example, the transformation of forest to cropland represents a change in land-cover whereas land-use change involves “alterations in the human management of land, in- cluding settlement, cultivation, pasture, rangeland and recreation” (Meyer and Turner 1994). Land-use induced land-cover change is one important fac- tor affecting terrestrial ecosystems and human livelihoods and thus comprises a major driving factor of global change. Remote sensing studies are generally restrained to land-cover change analysis. Change can be either abrupt or grad- ual and thus can be described in categories (classes) or continuous variables. The complete replacement of one land-cover type by another is referred to as land-cover conversion, whereas slight changes affecting the attributes of a land-cover without changing the nature of the land-cover type are defined as land-cover modifications (Coppin et al. 2004). Considering tropical environments, land-cover change is frequently caused by human-induced deforestation activities (Lambin 1997, Lu et al. 2005). The most general definition of deforestation is given in Watson et al. (2000) as the “sum of both, permanent and temporary human-induced removal of forest
- 7. Land-cover mapping in tropical regions 441 Table2.Currentandplannedgloballand-coverproductscoveringinsularSoutheastAsia ProductGLCCUMDland-coverGLC2000MODISland-coverTREESGLOBCOVER SensorAVHRRAVHRRSPOTVegetationMODISSPOTVegetationMERIS TimeframeofApril1992-April1992-Nov.1999-Oct.2000-March-Sept.1998Jan.2005- datacollectionMarch1993March1993Dec.2000Oct.2001March-Nov.1999Dec.2005 InputdataMonthlyNDVIMonthlyNDVISpotVGT1S1MOD43(nadirSpot-VGT1S10MERISLevel2 compositescompositesandBRDF-adjusted metricsreflectance Spatial1km1km1km1km1km300m Resolution MapProjectionGoode’sGoode’sGeographicSinusoidalGeographicGeographic HomolosineHomolosine ClassificationUnsupervisedSupervisedflexibleclassifi-SupervisedN/AN/A techniqueclusteringclassificationcationsystemclassification (decisiontree)dependingon(decisiontree) partnerinstitution ClassificationIGBPSimplifiedIGBPLCCS(16classesIGBPTREESLCCS scheme(legend)(17classes)(14classes)forSEAsia)(andothers)9classes IntendedAnnual*Annual*2005Annual*–N/A updateschedule(GLOBCOVER) DetailedLovelandetal.Hansenetal.Bartholom´eandStrahleretal.(1999)Stibigetal.N/A descriptionof(2000)(2000)Belward(2005)Friedletal.(2002)(2003) product Dataaccesshttp://edcdaac.http://glcf.http://www.gvm.http://edcimswww.http://www.gvm.http://www.gvm. usgs.gov/glcc/umiacs.umd.edu/jrc.it.glc2000cr.usgs.gov/pub/sai.jrc.it/Forest/jrc.it/tem/pro- glcc.aspdata/landcover/imswelcome/defaultForest.htmducts.complete.htm *noupdatesavailableattimeofpapersubmission+Version1.2ofGLCChasbeenupdatedbyversion2.0in2004butisbasedon thesamedataset(1992-1993)
- 8. 442 S. Erasmi et al. cover”. This definition includes short-term removals by shifting-cultivation as well as selective and clear-cut logging activities and all other kinds of conver- sion or modification of forest land. Lund (1999) restricts the term deforestation to “the long-term or permanent removal of forest cover and conversion to a non-forested land-use”. Besides human induced alteration, land-cover change can also be caused by long-term changes that are related to climate change, geomorphological (soil erosion) and ecological processes (vegetation succes- sion) as well as inter-annual climate variability (Lu et al. 2004). Within the present study, deforestation is only addressed in terms of short- to long-term forest conversion (e.g. changes in forest or land-cover type). Detailed descriptions of change detection concepts can be found in Coppin et al. (2004), Lu et al. (2004) and Singh (1989). The most important point in determining the appropriate concept is the decision for a spatial and tempo- ral scale for the intended investigation. Vegetation cover changes seasonally, inter-annually or between any other points in time (directional change). The change concept can either rely on two different images (bi-temporal) or on a set of images covering a complete time trajectory (time series analysis). Bi- temporal change detection concepts have to take into account the dates of image acquisition as the most important factor that may bias the resulting change. This is especially of interest in areas showing significant phenological differences in vegetation status or seasonal / intra-seasonal land-use patterns. Hence, bi-temporal change analysis is only meaningful if acquisition dates are comparable, phenological cycles follow distinct seasonal patterns and if they cover the interval length of the change process that is observed. In practice, bi-temporal change analysis is the dominating concept for change analysis in tropical areas (Achard et al. 2002, Alves et al. 2003, Castro et al. 2003, Erasmi et al. 2004). In most cases, the choice of a data pair for bi-temporal analysis is more related to the availability of appropriate satellite image data than to the above mentioned factors. To overcome the limitations of bi-temporal analysis, recent approaches in satellite based ecosystem analysis focused on the analysis of temporal profiles of image data covering seasonal, annual and inter-annual observation periods. These change concepts require a time se- ries of remote sensing data that are transformed into indicators of ecosystem characteristics (e. g. spectral vegetation indices). Time series-based change detection has recently been successfully implemented for regional and global studies of climate induced land-cover changes (Friedl et al. 2002, Zhang et al. 2004) and for the assessment of the variability of inter-annual net primary productivity of tropical ecosystems (Turner et al. 2005). Overall, the most important challenges for remote sensing-based ecosystem change analysis are (1) the detection of land-cover modifications in addition to conversions; (2) the detection of abrupt as well as gradual changes in land- cover; (3) the detection and separation of spontaneous, seasonal and annual changes from inter-annual changes and long-term trends; (4) the scale depen- dency of change estimates derived from satellite images at different spatial resolutions; (5) the precise geometric co-registration of multi-temporal im-
- 9. Land-cover mapping in tropical regions 443 ages and time series of satellite data; (6) the development of an appropriate change detection method; (7) the adoption of a consistent and hierarchical classification concept. 2.3 Remote sensing sensors and systems for land-cover mapping As described in the previous section, the success of land-cover studies is di- rectly related to the availability of satellite imagery at the desired spatial and temporal resolution. Concerning the spatial resolution of existing satel- lite systems, three main categories of sensors can be defined: (a) coarse to medium-resolution sensors (> 250 m); (b) high-resolution sensors (> 10 m); (c) very high-resolution sensors (< 10 m). These spatial resolutions can be linked to studies at different level of detail: (a) global to landscape level (< 1:200.000); (b) regional level (< 1:25.000); (c) local level (> 1:25.000). In gen- eral, the temporal resolution of optical satellite sensors is a function of the spatial resolution, due to sensor limitations (instantaneous field of view) and repetition rate of a sensor system. This means that an increase in the temporal resolution will most likely reduce the spatial resolution available for analysis. In addition to these characteristics, the choice for a satellite system also de- Fig. 1. Effective temporal and spatial characteristics of current and future mul- tispectral and SAR earth observation satellite sensors for humid tropical regions (dotted rectangle highlights desired resolution configuration for operational tropical land-cover monitoring pends on the spectral resolution (bandwidth, number of channels) and nature
- 10. 444 S. Erasmi et al. of radiation source (optical, radar, lidar). Figure 1 provides a broad overview of selected multi-spectral optical and SAR (synthetic aperture radar) satellite sensors that are used for earth observation purposes at present. The shown temporal coverage for optical sensor systems does not represent the nominal coverage of the observing system based on its repetition rate, but accounts for the effective mean availability of imagery for humid tropical areas due to atmospheric disturbances and cloud coverage. In contrast to this, the tempo- ral coverage of SAR satellite sensors is identical with its repetition rate due to the ability of radar waves to penetrate clouds. The summary shows that, in general, regional to local level mapping and monitoring is mainly related to observation systems with less frequent coverage whereas frequent observations of seasonal, annual and inter-annual phenomena (time series analysis) often require medium to coarse-resolution satellite systems. The lack of available systems in the intermediate space (high acquisition frequency, high spatial resolution) may be accounted for by using spaceborne imaging SAR systems. As illustrated in figure 1, satellite SAR sensors may comprise a key data source for land-cover observations in tropical areas. So far, only few studies have ac- counted for this opportunity and revealed the potential of the synergetic use of optical and radar data for the mapping and monitoring of land-cover in the tropics (Sano et al. 2005, Siegert et al. 2001). An explanation for this fact is that despite the operational availability of SAR satellite data, still too little is known about the relation of SAR signals to vegetation properties. 3 Pre-Processing of satellite data 3.1 Single-time and bi-temporal mapping Land-cover studies that are carried out based on single images mainly re- quire accurate geometric registration to a reference system or co-registration to other spatially explicit data sources for geospatial analysis purposes in a geographical information system (GIS). Geometric accuracy of (co-) registra- tion is of utmost importance to any form of land-cover mapping or change analysis and should be accounted for at the sub-pixel level. Mis-registration at the pixel level may lead to significant differences in area or change esti- mates and, hence, may cause pseudo-events in change detection or geospatial modelling. Radiometric consistency is not needed in the case of single image analysis if isolated empirical studies are intended, because land-cover maps are created individually for a single area and a single date. The challenges for radiometric image pre-processing increase with the number of images that are being processed and analysed. In the case of bi-temporal analysis, major causes for the alteration of the sensor signals that are recorded and converted into digital numbers (DNs) are the variability of atmospheric constituents and topography. Radiometric pro- cessing always aims at the normalisation of these effects by the use of models
- 11. Land-cover mapping in tropical regions 445 that in general invert the signal to DN conversion and eliminate the noise that is apparent in the signal or, in other words, maximize the signal to noise ratio (SNR). In general, there are two types of radiometric pre-processing: (a) relative radiometric calibration and (b) absolute radiometric calibration. Detailed summaries of pre-processing techniques for land-cover mapping and change detection are available from Cihlar (2000) and Coppin et al. (2004). Simple relative radiometric normalisation approaches are linear regression al- gorithms, or pseudo-invariant feature-based techniques. These methods rely on image based statistics and perform a relative normalisation of spectral im- age layers. Most of these methods use invariant features that are assumed to retain their spectral characteristics over long periods of time (e. g. empirical line calibration). More sophisticated radiometric calibration approaches aim at the computation of the absolute intensity of radiance reflected or emitted by a surface. These models are grouped in image-based atmospheric correction methods (Chavez 1996, Twele and Erasmi 2005) and physically based meth- ods (radiative transfer models). A study by Songh et al. (2001) revealed that the complexity of a radiometric calibration technique does not necessarily im- prove the accuracy of a classification or change detection analysis. This only implies qualitative analysis of the land surface. If further quantitative anal- ysis (biophysical ecosystem variables) from calibrated remote sensing data is intended, an accurate and robust absolute atmospheric correction method should be applied. 3.2 Time series computation Satellite image analysis that is based on a time series of observation dates gen- erally requires the same pre-processing workflow as has been explained in the previous section. Adequate geometric accuracy is obligatory for change anal- ysis in time profiles. Current sensor systems already account for this necessity and provide precise geo-located products to the user community (Terra/Aqua- MODIS, Envisat-MERIS, Spot-VEGETATION). The radiometric calibration of time series data has mainly to deal with the removal of clouds and other atmospheric effects (e. g. water vapour content, aerosols) that are inherent in a single image. Since the existence of clouds constitutes a major problem in tropical land surface remote sensing, the development of methods to min- imize or remove these effects is imperative for land-cover analysis. A simple but robust approach to reduce the amount of cloudy and atmospherically con- taminated image pixels is the generation of temporal composites based on a constant number observation dates. The processing and archiving facilities of the currently available satellite systems that deliver daily image data already, developed and implemented such compositing techniques in standard pre- processing workflows and provide the compositing results as an operational data product (Terra/Aqua-MODIS, Spot-VEGETATION, NOAA-AVHRR). In most cases, these temporal composites rely on the maximum vegetation index value within a given period of time (several days or weeks). Maximum
- 12. 446 S. Erasmi et al. value composites (MVC’s) are very simple to use and have been applied to early temporal profiling satellite data sets (e. g. AVHRR Pathfinder; Hol- ben 1986). Newer approaches further account for the influence of the viewing geometry (panoramic distortions, sensor off-nadir angle) (Huete et al. 2002, Duchemin et al. 2002). Global imaging sensor systems are operated at a wide field of view, which results in signal alterations in off-nadir areas. These effects are mainly caused by the directionality of the reflectance behaviour of natural objects and are described for every land surface object by its bi-directional reflectance distribution function (BRDF). Table 3 summarizes the temporal composite products that are currently available for insular Southeast Asia. All land-cover products that are sum- marized in Table 2 are based on one of these compositing techniques or use enhanced techniques that have been developed complementary to the basic methods. These recent approaches are mainly driven by the fact that even the BRDF-adjusted composite for MODIS and VEGETATION products (Schaaf et al. 2002, Duchemin et al. 2002) does not yield uniform results for the globe and can further be improved for specific regions, especially the tropics, where cloud coverage and atmospheric disturbances are eminent (Cabral et al. 2003, Carreiras and Perreira 2005, Hagolle et al. 2004). 4 Techniques of land-cover mapping and change detection Satellite image classification, the assignment of a discrete object attribute (e.g. land-cover type) to a single image unit (pixel or object), is one of the earliest application fields of digital image processing and analysis in remote sensing. Two types of approaches have evolved and are used to this day as the basic options for digital image classification. These types are based on different general concepts about the previous knowledge of the area that is to be classified (Cihlar 2000). Supervised classification uses a priori knowl- edge about the surface types that is used to create representative signatures which are applied to the entire area of interest. The unsupervised classifica- tion concept does not take into account prior information about cover type and distribution. The assignment of clusters to land-cover types is done a pos- teriori, based on available ground truth information. A number of enhanced techniques have evolved from these two classification techniques, including decision tree classifiers, neural networks and fuzzy logic classification (Coppin et al. 2004). In addition to the analysis of the spectral dimension, the spatial domain contains also valuable information about land-cover features, especially when high spatial resolution satellite data are available. The most utilized ap- proaches comprise texture analysis and other spatial measures based on image segments.
- 13. Land-cover mapping in tropical regions 447 Table3.VegetationindexcompositeproductsavailableforSoutheastAsia ProductMODISMOD13SPOT-VGTS10SPOT-VGTD10AVHRR1kmAVHRRGIMMS SensorTerra/AquaMODISSPOT-Vegetation-1/2SPOT-Vegetation-1/2AVHRRAVHRR TemporalApril2000-April1998-July2001-April1992-July1981- coveragepresentpresentpresentMay1996Dec.2003 Spatial250/500/1000m1km1km1km8km resolution MapSinusoidalEquirectangular/Equirectangular/Goode’sGeographic projectionPlateCar´ee(Lat/Lon)PlateCar´ee(Lat/Lon)Homolosine Compositing16days10days10days10days1month period CompositingMODISVIMaximumvalueBidirectionalMaximumvalueMaximumvalue algorithmcompositingcompositecompositecompositecomposite algorithm(MVC)(BDC)(MVC)(MVC) DetailedHueteetal.(2002)Holben(1986)Ducheminetal.Holben(1986)Tuckeretal. productSchaafetal.(2002)(2002)(2005) description Dataaccesshttp://edcimswww.cr.http://free.vgt.vito.be/http://free.vgt.vito.be/http://edcdaac.usgs.http://glcf.umiacs. usgs.gov/pub/imswelindex.phpindex.phpgov/1KM/1kmhomeumd.edu/data/gimms/ come/page.asp
- 14. 448 S. Erasmi et al. If area distributions of land-cover classes are to be compared over time, a classification of all image pixels for each point in time is obligatory. Con- sequently, the multi-temporal dataset is classified separately and a pixel-by- pixel comparison is employed. Subsequently, changes in area distribution of all land-cover classes can be calculated and the history of land-cover develop- ment can be analysed and interpreted under different (e.g. social, ecological) perspectives. However, land-cover studies frequently deal with single, sometimes drastic change phenomena such as deforestation, forest fires, landslides and floods. In this case, mapping all image pixels is neither necessary nor feasible with respect to time requirements. Therefore, it is possible to use special techniques which are developed to highlight the specific change phenomena. The most popular of these methods utilize image algebra or image transformations to convert multi-temporal spectral reflectance to a feature space that highlights changes. Comprehensive reviews of change detection techniques can be found in Coppin et al. (2004), Lu et al. (2004) and Lu et al. (2005). If land-cover mapping aims at the detection of gradual changes in land- cover (e.g. forest thinning, selective logging or reforestation), mapping land- cover modifications in a continuous manner is desirable. The most common approach to derive such information from multispectral remote sensing data is the computation of fractions of land-cover types within a pixel (e.g. fraction of vegetation) or of biophysical attributes over time (Lambin 1999). 5 Land-cover and change analysis in Sulawesi It is evident from numerous studies (Achard et al. 2002, Erasmi et al. 2004, FAO 2003, FWI & GFW 2002) that substantial land degradation and land- cover conversion at the rainforest margin in Southeast Asia has taken place during the past decades and significantly increased during recent years. Re- gional studies based on satellite data state an annual loss of forest cover of 0.6 % for the time period 1972 to 2002 for Central Sulawesi (Erasmi et al. 2004). National estimates for Indonesia assume a loss of forest of 1.2 % to 1.7 % per year (FAO 2003, FWI & GFW 2002). These discrepancies in deforestation estimates allude to the problem of data comparability and scale dependency for socio-economic and ecological modelling. Within this context, a study has been carried out for a test region in Central Sulawesi that evaluated the satellite data products and land-cover mapping concepts that have been explained above. 5.1 The land-cover classification system for Sulawesi The comparison of the IGBP and LCCS classification system for insular Southeast Asia revealed some problems that are mainly caused by the dif- ferent class definition concepts.
- 15. Land-cover mapping in tropical regions 449 In general, these concepts follow the same idea that land-cover stratifi- cation is based on the nature of the surface cover. In addition, LCCS offers the opportunity to further describe the surface cover based on environmental attributes (topography, geology and soils, life form and cover, etc.). The conse- quence is that the LCCS system can be better adapted to regional land-cover characteristics. Considering the natural vegetation classes, the inconsistencies are generally related to differences in thresholds that are used in both sys- tems to define stages of vegetation coverage (e. g. percent of vegetation or tree cover per pixel). Two examples of class definitions are used here to explain this fact. First, the class evergreen broadleaved forest is employed in both sys- tems. The IGBP legend uses a threshold of 60 % tree cover whereas the LCCS definition is based on a 15 % threshold. The second case of shrubland defi- nitions shows similar inconsistencies in threshold designations (IGBP=60%; LCCS=15%). In addition to this, the class descriptions for shrubland and for evergreen broadleaved forest use different height thresholds (shrubland: IGBP=3 m, LCCS=2 m; forest: IGBP=5 m, LCCS=2 m).
- 17. Fig. 2. Subsequent land-cover specification for tropical forest areas in Sulawesi using the modular hierarchical classification system (LCCS) The flexibility and hierarchical concept of LCCS were the major criteria for the decision to adopt this system as a fundament to create a consistent land-cover classification system for Sulawesi. The first and lowest level of the hierarchical multi-level system comprises the land-cover classes that have been defined within the GLC2000 project for insular Southeast Asia. These class definitions already account for the specifics of tropical land-cover and are tai- lored to general tropical vegetation types (Table 1). Land-cover analysis at this level is limited to large area observations, temporal trajectory analysis and comparison of results from different regions. At the next and more detailed level, the initial classes are subdivided into more detailed descriptions of the
- 18. 450 S. Erasmi et al. land-cover that is dominant in the area under investigation. Other classes that are less important within the area remain unchanged. At this level regional analysis of land-cover is performed, aiming at a more complex characteriza- tion of tropical landscape patterns. The third and highest observation level again contains more detailed descriptions of land-cover units. At this stage, a description of local land-cover phenomena is carried out with regard to the characterization of land-use intensity gradients at the rainforest margin. An example of the specification of land-cover classes within this modular concept is given in Figure 2 for broadleaved evergreen forest areas. The concept has been adapted to satellite-based mapping approaches for the investigation area in Central Sulawesi. Land-cover analysis based on this classification system guarantees consistent and comparable land-cover infor- mation at multiple scales. Land-cover mapping results at higher levels can be transferred to lower levels by means of aggregation of land-cover classes at any time without class overlap or inconsistencies. 5.2 Land-cover area comparison based on global products Despite the inconsistencies of the IGBP and LCCS classes, the IGBP classes have been translated into the LCCS system for insular Southeast Asia as shown in Table 1. This made a direct quantitative comparison of the MODIS and the GLC2000 land-cover products possible. Figure 3 shows the resulting area fractions of the LCCS classes for the MODIS land-cover compared to the GLC2000 land-cover classification. Most obvious discrepancies are appar- ent for the classes “broadleaved evergreen forest” and “mosaics of cropland / other natural vegetation”. Other findings by Hansen and Reed (2000) and Giri et al. (2005) also reported major differences in forests as well as in shrub- lands and savannas that are mostly related to the different class definitions of forest, resulting in an overlap of forests in the LCCS system with savannas / shrublands of the IGBP land-cover classes. In the specific case of Sulawesi, the discrepancies cannot solely be explained by these class inconsistencies. In contrast to other reported results (Hansen and Reed 2000, Giri et al. 2005) the forest area in the MODIS land-cover product is 20 percent above the es- timates of the GLC2000 product (MODIS: 81.5 %; GLC2000: 61.5 %). The second major difference in area fractions is found for the “mosaics of cropland / other natural vegetation” class. The amount (in percent of total area) nearly compensates for the shift of forest cover rates between the two maps (MODIS: 7.9 %; GLC2000: 24.0 %). The area statistics also reveal some noticeable dif- ferences between the estimates for “cultivated areas” as well as “tree cover and other natural vegetation mosaics”. The fractions and differences for the remaining classes that are found in the investigation area are below 1 % and neglected in this discussion. The large overestimation of forest cover in the MODIS land-cover classi- fication compared to the GLC2000 product is surprising, because the class definition of the IGBP legend for forest is based on a threshold of 60 % tree
- 19. Land-cover mapping in tropical regions 451 Fig. 3. Occurrence of LCCS land-cover classes based on the GLC2000 and MODIS land-cover products for Sulawesi cover in contrast to only 15 % for the LCCS. Based only on this fact, the simple translation of the IGBP forest class to the LCCS system that has been accomplished here must lead to an overestimation of forest area in the GLC2000 product. Since the opposite is observed in this study, it cannot be argued that the different area estimates are simply based on different class definitions or inconsistencies in legend translations. This has been further ap- proved by the comparison of the two classifications at the biome level, using only seven aggregated land-cover classes based on the LCCS class definition scheme (Figure 4). Additional investigation thus concentrated on the valida- tion of the two products for a regional study site in Central Sulawesi. 5.3 Comparison of global products with regional studies There are several options to validate satellite-based land-cover products. The approach for the GLC2000 data sets was based on the participation of inter- national, national and regional experts from more than 30 countries. Within this consortium, the land-cover maps were produced at the regional level and
- 20. 452 S. Erasmi et al.
- 21. ! !
- 22. ! ! ! !! !! Fig. 4. Area statistics based on aggregated LCCS land-cover classes for the GLC2000 and MODIS land-cover classifications of Sulawesi later transferred to the continental and global scale using the hierarchical LCCS classification scheme. This bottom-up classification concept already accounted for a regional validation by a team of experts that created maps at higher levels. All input data sources, the classification scheme and methodol- ogy were adapted to the needs of the participating institutions and optimized for the land-cover types that are found in the respective regions. In contrast to this, the MODIS product uses a top-down approach to characterize land- cover. The MODIS land-cover product is based on a consistent classification methodology that uses a supervised decision tree classifier and is adopted for the entire terrestrial surface. A validation using results from regional studies and high-resolution satellite data has not been carried out within the project. The two products (MODIS land-cover, GLC2000) have been validated within the current study using a land-cover map of a test site in Central Sulawesi, Indonesia. The site covers approximately 7.200 square kilometres and is dominated by broadleaved evergreen natural forest and land cultivation of different intensities at the forest margins. The validation dataset consists of a Landsat/ETM+ based land-cover map that has been validated by local
- 23. Land-cover mapping in tropical regions 453 Fig. 5. Area statistics for aggregated classes of Landsat-based classification com- pared to GLC2000 and MODIS land-cover products (STORMA project area, Central Sulawesi) and regional experts (producer’s accuracy: 87,7 %). All data products have been created using the LCCS legend or translated from other systems and have been aggregated to the major land-cover types that are prevalent in the study area. Figure 5 shows the results of the area statistics calculations for the three land-cover maps. It is apparent that the GLC2000 map better reflects the results of the regional study. The forest areas can be estimated with a total difference of only 10 square kilometres (0.1 % of total area). The “cropland / natural vegetation mosaic” areas are larger in the GLC2000 land-cover map whereas the cropland area is larger in the regional land-cover map. This can be explained by the small-scaled landscape pattern of annual and perennial crops, grassland and agroforestry systems that are mixed up when using lower resolution satellite images. Considering the MODIS regional validation, forest areas are strongly overestimated (94 % of the study area). The remaining area is shared by the other six classes, which leaves no space for interpretation of agreement or disagreement with the regional map. A comparison of the spatial distribution of the forest areas from GLC2000 and MODIS clearly shows the areas of disagreement between these two products (Figure 6). Inconsistencies mainly occur at the transition zones between natural forest and cultivated land and hence in the areas that are of primary interest in most studies with regard to the stability of rainforest margins.
- 24. 454 S. Erasmi et al. Fig. 6. GLC2000 land-cover map for Sulawesi including areas of disagreement be- tween GLC2000 and MODIS land-cover (in magenta)
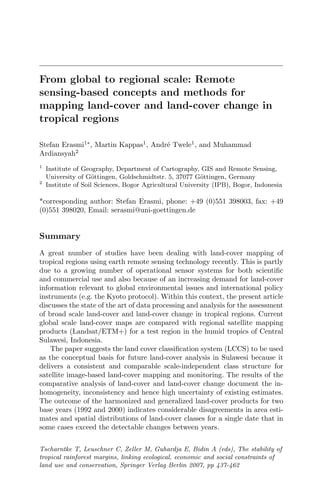
- 25. Land-cover mapping in tropical regions 455 Fig. 7. Area statistics of land-cover change for Sulawesi based on global products for the years of 1992 and 2000 5.4 Change analysis based on global products The change analysis was based on a comparative post-classification analysis of the existing global land-cover products for insular Southeast Asia. The com- putation of change statistics and the results of change analysis are strongly dependent on reliable and consistent data for at least two base years. In this study five land-cover products have been compared (see Table 2 for product details) with regard to feasibility and consistency of area estimates for the tropical land-cover of Sulawesi. The results of the area calculations based on aggregated classes are shown in Figure 7. A comparison of the area distri- bution reveals some remarkable aspects. The revision of the GLCC product (version 2.0) leads to a considerable increase in forest cover. At the same time, cultivated land decreases to less than half of the previous estimate for the GLCC version 1.2. The AVHRR UMD map includes the “Mosaic: Tree cover / other natural vegetation” class while this class is not apparent in the other AVHRR-based products for the base year 1992. In general, the area estimates for forest cover show an increase in forests during the time period of 1992 to 2000 even if the strong overestimation of the MODIS product is neglected in the comparison. Moreover, there seems to be no increase in land cultiva- tion. The consequence of these results would be that tropical ecosystems in Sulawesi regenerated during the past decade. This finding is contradictory to all assessments and field observations at the local, regional and global level and is abandoned from further interpretation. The reason for the implausi- ble area estimates is rather to be seen in the inconsistencies of data sources, methodologies and classification concepts of the different studies.
- 26. 456 S. Erasmi et al. As a consequence of these findings, further change analysis based on the existing land-cover products has not been conducted within this study. 6 Discussion and conclusions A comparative analysis of the global land-cover products for Sulawesi has been carried out. The data set for the comparison consisted of five land-cover maps covering two base years (1992 and 2000). The analysis for the base year 2000 included the MODIS land-cover and the GLC2000 product. Area statistics for these two products show a strong overestimation of forest areas in the MODIS land-cover classification. In comparison, the present study underlines the high consistency of forest cover estimates from GLC2000 land-cover with regional land-cover mapping from high-resolution satellite data for Central Sulawesi. Moreover, cropland is mixed up with natural forest cover in the MODIS prod- uct, whereas the GLC2000 map better delineated cultivated land from natural forest areas. The spatial analysis of area distributions for the main land-cover classes reveals large areas of disagreement between MODIS and GLC2000, especially near the rainforest margins. Overall, the GLC2000 is superior to the MODIS product considering the investigation area in Sulawesi. This con- clusion is not surprising because of the lack of regional validation studies for the MODIS land-cover data. The data were not intended for regional or local applications, thus the data have not been optimized for those purposes. On the other hand, the GLC2000 data demonstrate the feasibility of integrat- ing global land-cover data sets into regional studies and the importance of regional studies for the verification of global land-cover products. The GLC2000 concept will be adapted to the forthcoming GLOBCOVER data set in a similar manner. This scheme presumes that GLOBCOVER data will provide a land-cover map that is comparable to the GLC2000 and may deliver the basis for a consistent change analysis in tropical regions. Neverthe- less, the classification and validation strategy of GLC/GLOBCOVER is not operational due to the large number of involved partners and institutions at different operating levels. In contrast, the MODIS classification methodology is consistent and repeatable. It aims at the provision of a global data set every six months, but the intended update schedule has not been accomplished up to now. The MODIS and GLC2000 data sets have also been compared with the global data sets for the base year 1992 (GLCC, AVHRR UMD). The com- parative analysis for the Sulawesi area confirms the problem of inconsistency with regard to data sources, classification methods and concepts. Even if the data source of a land-cover product is identical, the processing and analysis differs fundamentally, thus making it difficult to compare the results (Hansen and Reed 2000, Giri et al. 2005). The results of the present study for Central Sulawesi conclude that the area disagreements between products for a single
- 27. Land-cover mapping in tropical regions 457 year can be of the same dimension as estimated changes of land-cover between years. Considering land-cover classification systems, the LCCS comprises a basis for the definition of land-cover legends at multiple levels, using a hierarchical tree concept and a combination of environmental and technical attributes of land-cover. The concept has been successfully adapted to the land-cover types for the tropical environment of Central Sulawesi. The advantage of the LCCS system is that it is flexible and adaptable to biome specific characteristics while the IGBP consists of an irreversible number of major land-cover classes. Hence the LCCS is more useful for multi-level investigations from local to global scale. In contrast, the IGBP class definitions are restricted to global monitoring issues. Future work will aim at the generation of consistent data products for change analysis. These attempts have to account for a robust pre-processing chain focussing on data harmonization (spectral, spatial and temporal fitting). If data harmonization is achieved at a certain level, standardized classifica- tion workflows can be established and adapted to the different data sets. The overall scope of future studies of land-cover assessment within the project will be on the routine mapping of tropical ecosystems which comprise a hot spot region with regard to global change. It is obvious that future work should therefore focus on the integration of single isolated mapping approaches and aim at developing a comprehensive and reliable operational monitoring con- cept for tropical environments. Acknowledgements We would like to thank the German Research Foundation (DFG) for funding parts of this work within the collaborative research centre SFB-552 (Stability of Rainforest Margins in Indonesia). References: Achard F, Eva HD, Stibig HJ, Mayaux P, Gallego J, Richards T, Malingreau JP (2002) Determination of Deforestation Rates of the World s Humid Tropical Forests. Science 297 (9): 999-1002 Alves DS, Escada MIS, Pereira JLG, De Albuquerque Linhares C (2003) Land- use intensification and abandonment in Rondonia, Brazilian Amazonia. Int J Remote Sens 24 (4): 899-903 Bartholom´e E, Belward AS (2005) GLC2000: a new approach to global land- cover mapping from Earth observation data. Int J Remote Sens 26 (9): 1959-1977 Cabral A, De Vasconcelos MJP, Pereira JMC, Bartholom´e E, Mayaux P (2003) Multi-temporal compositing approaches for SPOT-4 VEGETATION. Int J Remote Sens 24: 3343–3350
- 28. 458 S. Erasmi et al. Carreiras JMB, Pereira JMC (2005) SPOT-4 VEGETATION multi-temporal compositing for land-cover change studies over tropical regions. Int J Re- mote Sens 26 (7): 1323-1346 Castro KL, Sanchez-Azofeifa GA, Rivard B (2003) Monitoring secondary trop- ical forests using space-borne data: implications for Central America. Int J Remote Sens 24 (9): 1853-1894 Chavez PS (1996) Image-based atmospheric corrections. Revisited and im- proved. Photogramm Eng Rem S 62: 1025–1036 Cihlar J (2000) Land-cover mapping of large areas from satellites: status and research priorities. Int J Remote Sens 21 (67): 1093-1114 Coppin P, Jonckheere I, Nackaerts K, Muys B, Lambin E (2004) Digital change detection methods in ecosystem monitoring: a review. Int J Remote Sens 25 (9): 1565-1596 Di Gregorio A, Jansen LJM (2000) Land-cover Classification System (LCCS): Classification Concepts and User Manual. FAO, Rome, 194 pp Duchemin B, Berthelot B, Dedieu G, Leroy M, Maisongrande P (2002) Nor- malisation of directional effects in 10-day global syntheses derived from VEGETATION/SPOT: II. Validation of an operational method on actual data sets. Remote Sens Environ 81: 101-113. Erasmi S, Twele A, Ardiansyah M, Malik A, Kappas M (2004) Mapping de- forestation and land-cover conversion at the rainforest margin in Central Sulawesi, Indonesia. EARSeL eProceedings, 3(3): 388-397 FAO (Food and Agriculture Organisation of the UN) (2003) The State of the World’s Forests. (FAO, Rome) 151 pp Forest Watch Indonesia (FWI), Global Forest Watch (GFW) (2002) The State of the Forest: Indonesia. Bogor, Indonesia Friedl MA, McIver DK, Hodges JCF, Zhang XY, Muchoney D, Strahler AH, Woodcock CE, Gopal S, Schneider A, Cooper A, Baccini A, Gao F, Schaaf C (2002) Global land-cover mapping from MODIS: algorithms and early results. Remote Sens Environ 83 (1): 287-302 Giri C, Zhub Z, Reed B (2005) A comparative analysis of the Global Land- cover 2000 and MODIS land-cover data sets. Remote Sens Environ 94: 123-132 GLP (2005): Science Plan and Implementation Strategy. IGBP Report No. 53/IHDP Report No. 19.Stockholm Hagolle O, Lobo A, Maisongrande P, Cabot F, Duchemin B, De Pereyra A (2004) Quality assessment and improvement of temporally composited products of remotely sensed imagery by combination of VEGETATION 1 and 2 images. Remote Sens Environ 94 (2004) 172–186 Hansen MC, Reed R (2000) A comparison of the IGBP DISCover and Uni- versity of Maryland 1 km global land-cover products. Int J Remote Sens 21 (67): 1365-1373 Hansen M, DeFries R, Townshend JRG, Sohlberg R (2000) Global land-cover classification at 1km resolution using a decision tree classifier. Int J Remote Sens 21: 1331-1365
- 29. Land-cover mapping in tropical regions 459 Holben BN (1986) Characteristics of maximum-value composite images from temporal AVHRR data. Int J Remote Sens 7: 1417–1434 Huete A, Didan K, Miura T, Rodriguez EP, Gao X, Ferreira LG (2002) Overview of the radiometric and biophysical performance of the MODIS vegetation indices. Remote Sens Environ 83: 195-213 Lambin, EF (1997) Modelling and monitoring land-cover change processes in tropical regions. Prog Phys Geog 21 (3): 375-393 Lambin EF (1999) Monitoring forest degradation in tropical regions by remote sensing: some methodological issues. Global Ecol and Biogeogr 8: 191–198 Loveland TR, Reed BC, Brown JF, Ohlen DO, Zhu Z, Yang L, Merchant JW (2000) Development of a global land-cover characteristics database and IGBP DISCover from 1 km AVHRR data. Int J Remote Sens 21(6+7): 1303-1330 Lu D, Mausel P, Batistella M, Moran E (2005) Land-cover binary change detection methods for use in the moist tropical region of the Amazon: a comparative study. Int J Remote Sens 26(1): 101-114 Lu D, Mausel P, Brondizio E, Moran E (2004) Change detection techniques. Int J Remote Sens 25 (12): 2365-2407 Lund G (1999) A forest by any other name. Environmental Science and Policy 2(2): 125-134 Mayaux P, Achard F, Malingreau JP (1998) Global tropical forest area mea- surements derived from coarse resolution satellite imagery: a comparison with other approaches. Environ Conserv 25: 37–52 Meyer WB, Turner BL (1994) Changes in Land-use and Land-cover: A Global Perspective. Cambridge University Press, Cambridge Running SW, Loveland TR, Pierce LL (1994) A vegetation classification logic based on remote sensing for use in global scale biogeochemical models. Ambio 23: 77–81 Sano EE, Laerte GF, Huete AR (2005) Synthetic Aperture Radar (L band) and Optical Vegetation Indices for Discriminating the Brazilian Savanna Physiognomies: A Comparative Analysis. Earth Interactions 9: 1-15 Sato HP, Tateishi R (2004) Land-cover classification in SE Asia using near and short wave infrared bands. Int J Remote Sens 25 (14): 2821-2832 Schaaf CB, Gao F, Strahler AH, Lucht W, Li X, Tsang T, Strugnell NC, Zhang X, Jin Y, Muller JP, Lewis P, Barnsley M, Hobson P, Disney M, Roberts G, Dunderdale M, Doll C, D’Entremont RP, Hu B, Liang S, Privette JL, Roy D (2002) First operational BRDF, albedo nadir reflectance products from MODIS. Remote Sens Environ 83: 135-148 Siegert F, Rueker G, Hinrichs A, Hoffmann AA (2001): Increased damage from fires in logged forests during droughts caused by El Nino. Nature 414(6862): 437-440 Singh A (1989) Digital change detection techniques using remotely sensed data. Int J Remote Sens 10: 989–1003
- 30. 460 S. Erasmi et al. Songh C, Woodcock CE, Seto KC, Lenney MP, Macomber SA (2001) Classi- fication and change detection using Landsat TM data: when and how to correct atmospheric effects? Remote Sens Environ 75: 230–244 Stibig HJ, Beuchle R, Achard F (2003) Mapping of the tropical forest cover of insular Southeast Asia from SPOT4-Vegetation images. Int J Remote Sens 24 (18): 3651-3662 Strahler A, Muchoney D, Borak J, Friedl M, Gopal S, Lambin E, Moody A (1999) MODIS Land-cover Product Algorithm Theoretical Basis Docu- ment (ATBD) Version 5.0: MODIS Land-cover and Land-Cover Change Townsend JRG, Justice CO, Skole D, Malingreau JP, Cihlar J, Teillet P, Sadowski F, Ruttenberg S (1994) The 1 km resolution global data set – Needs of the Int. Geosphere Biosphere Program. Int J Remote Sens 15 (17): 3417-3441 Tucker CJ, Pinzon JE, Brown ME, Slayback D, Pak EW, Mahoney R, Ver- mote E, El Saleous N (2005) An Extended AVHRR 8-km NDVI Data Set Compatible with MODIS and SPOT Vegetation NDVI Data. Int J Remote Sens (in press) Turner II BL, Skole DL, Sanderson S, Fischer G, Fresco L, Leemans R (1995) Land-use and Land-cover Change Science/Research Plan. IGBP Report No. 35 and HDP Report No. 7. Stockholm Turner DP, Ritts WD, Cohen WB, Maeirsperger TK, Gower ST, Kirschbaum AA, Running SW, Zhao M, Wofsky SC, Dunn AL, Law BE, Campbell JE, Oechel WC, Kwon HJ, Meyers TP, Small EE, Kurc SA, Gamon JA (2005) Site-level evaluation of satellite-based global terrestrial gross primary pro- duction and net primary production monitoring. Global Change Biol 11: 666-684 Twele A, Erasmi S (2005) Optimierung der topographischen Normalisierung optischer Satellitendaten durch Einbeziehung von Koh¨arenzinformation. Photogrammetrie Fernerkundung Geoinformation (PFG) 2005 (3): 227- 234 UN (united Nations) (2005) World Population Prospects: The 2004 Revi- sion, vol. I, Comprehensive Tables (United Nations publication, Sales No. E.05.XIII.5), New York 2005 Watson R, Noble I, Bolin B, Ravindranath NH, Verardo D, Dokken DJ (eds) (2000) Land-use, Land-Use Change, and Forestry – a special report of the IPCC. Cambridge University Press, Cambridge Zhang P, Anderson B, Barlow M, Tan B, Myneni RB (2004) Climate- related vegetation characteristics derived from Moderate Resolution Imag- ing Spectroradiometer (MODIS) leaf area index and normalized difference vegetation index. J Geophys Res 109: D20105