SlideShare a Scribd company logo
1 of 1
Download to read offline
Interpretation of landscape values, typology and quality using methods of spatial metrics for ecological planning
Michal Klaučo; Bohuslava Gregorová, Uglješa Stankov, Vladimir Marković, Polina Lemenkova
* Matej Bel University in Banská Bystrica, ** University of Novi Sad, *** Dresden University of Technology
6. Conclusion
The main result of this work consists in determined ecological significant areas of habitats that are under
protection´s system of Natura 2000 Sites. The patches quantification of habitats is the partial result that
influences process of determination of ecological significance.
The interpretative process examines land cover patches by the set of landscape metrics for the area, size, density
and shape (NP, PD, MPS, PSSD and MSI). The output values could express a spatial processes in the landscape,
such as perforation, dissection, fragmentation, shrinkage or attrition.
The final ecological significance of the study area – Sitno Natura 2000 site - is at degree 3, what means that the
area is represented by moderately significant land cover patches – habitats. It indicates the same value as the one
at the initial level. According to the value of the ecological significance, the study area has been diversified into
three zones, where each one indicates specific level of conservation. The zones and the final degree of the
ecological
significance of habitats are retroactively compared to historical and cultural human development that started in
this area as early as in 1st century BC. Theoretically, such a long period of intense human impacts on the local
environment should completely destroy natural environment. Nevertheless, this area demonstrates rather good
natural ecosystems conditions and well functioning ecological processes within the habitats. The human impact
is now observed only in small range of size not more than 1,50% from total area of Sitno Natura 2000 Site. It
can be explained, first, by low population density within the study area comparing to other EU areas, secondly,
by accurate usage of the living area by the local population in general, and thirdly, by high resilience of the
elements of landscapes towards any human impacts.
1. Introduction: research problem
This research focuses on landscapes studies with selected research area located in central Slovakia, Sitno area. The research purpose is to
perform spatial analysis of the landscapes and patches within the landscapes, in order to assess, which parts of the selected study area have the
highest environmental quality and value, for further environmental monitoring and management. This paper presents quantitative ecological
assessment of the landscapes within the natural protected area located in Slovakia, central Europe. It contributes to the sustainable development
and environmental management of the environmentally protected zones.
2. Methodology
In this research we performed spatial analysis of Sitno landscapes
using methods of landscapes metrics calculation and quantification.
This include measurements of landscape elements, assessment of
ecological significance, zoning of area into areas of ecological
significance with different value levels. Methodologically, the
landscape metrics assessment included calculations of Number of
Patches (NP), Patch's density (PD), Mean patch size (MPS), Patch's
size standard deviation (PSSD) and Mean shape index (MSI).
3. Techniques
The output of this interpretation is defined by the stepwise levels of
ecological values: 1)very significant 2) significant 3) moderately
significant 4) almost insignificant 5) insignificant.
The final results are presented as calculated numerical values which are
assigned for each land cover patch within the landscape. The interpretation
of these quantified data allows to define ecological value and quality of
the landscapes. The ecological value, or significance, of the landscape
elements is represented by the numerical values which indicate quality of
the complex ecological processes within the landscape.
This enables to assess it as high-level value (very precious) or low-level
value (not significant). These degrees are used for zoning of the protected
areas. This process quantitatively divides study area into different zones
with approach to landscape conservation. The final results consist in
assessed ecological values for landscapes in Sitno Natura 2000 Site.
LCC
Code
Annex
Code
NP1 NP2 PD1 PD2 MPS1 MPS2 PSSD1 PSSD2 MSI1 MSI2
Artificial surfaces X 11 10,48 1,18 10,48 2,21 2,49 2,09 1,97 10,2 25,62
1.1.2. X(1.1.2) 4 3,81 0,43 3,81 0,47 0,53 0,29 0,27 1,34 3,37
1.2.2. X(1.2.2) 7 6,67 0,75 6,67 1,73 1,96 1,80 1,70 8,86 22,25
Agricultural areas
X 33 31,43 3,53 31,43 9,05 10,27 5,16 4,87 11,71 29,45
65,10 15 14,29 1,60 14,29 2,05 2,33 1,89 1,79 1,70 4,27
X(2.3.1) 1 0,95 0,11 0,95 0,34 0,39 0,00 0,00 2,15 5,40
6410 5 4,76 0,53 4,76 0,51 0,58 0,45 0,42 1,40 3,51
6110* 3 2,86 0,32 2,86 0,51 0,58 0,31 0,29 1,46 3,68
6210 4 3,81 0,43 3,81 0,69 0,78 0,67 0,63 1,41 3,55
6240* 4 3,81 0,43 3,81 3,47 3,94 1,84 1,74 1,96 4,93
6230* 1 0,95 0,11 0,95 1,48 1,67 0,00 0,00 1,63 4,11
Forests & semi-
natural areas
X 61 58,08 6,52 58,11 76,85 87,22 98,48 93,15 17,88 44,91
3.1.1
X(3.1.1) 2 1,90 0,21 1,91 1,22 1,38 0,91 0,86 1,77 4,44
91G0* 18 17,14 1,92 17,15 12,85 14,58 30,96 29,28 1,88 4,72
91H0* 5 4,76 0,53 4,76 2,13 2,42 2,67 2,53 1,33 3,33
91M0 4 3,81 0,43 3,81 5,64 6,40 3,24 3,07 1,61 4,06
9180* 7 6,67 0,75 6,67 13,21 15,00 21,15 20,01 1,78 4,47
3.1.3 9130 14 13,33 1,50 13,34 35,17 39,92 37,07 35,06 1,90 4,77
3.2.4 40A0* 4 3,81 0,43 3,81 1,42 1,61 0,52 0,49 1,58 3,96
X(3.2.4) 5 4,76 0,53 4,76 1,37 1,55 1,96 1,86 1,91 4,81
3.3.2 8150 1 0,95 0,11 0,95 0,29 0,33 0,00 0,00 1,60 4,03
8220 1 0,95 0,11 0,95 3,55 4,03 0,00 0,00 2,52 6,32
Total landscape value
105,
00
100,00 11,22 100,0
0
88,11 100,0
0
105,72 100,00 39,80 100,00
Table 2 Quantification of habitats by landscape metrics
CORINE Land
Cover
Annex
EUNIS
Class Area
Code Description Code Description ha %
1. Artificial surfaces 13,9
8
1,49
1.1.2. Discontinuo
us urban
fabric
X (1.1.2) x x 1,86 0.20
1.2.2. Road and
rail networks
and
associated
land
X (1.2.2) x x 12,1
2
1,29
2. Agricultural area 53,3
2
5,69
2.3.1 Pastures
6510 Lowland hay meadows E2.22 30,7
9
3,29
X (2.3.1) Large Carex beds C3.26
(D5.21)
0,34 0,04
6410 Molinia meadows on
calcareous, peaty or
clayey-slitladen soils
E3.51 2,54 0,27
6110* Middle European
pioneerswards
E1.11
(E1.29)
1,54 0,16
6210 Arid subcontinental
steppic grassland
E1.22
(E1.23)
E1.28)
2,74 0,29
6240* Sub-Pannonic steppic
grasslands
E1.2
(E1.29)
13,8
9
1,48
6230* Mat-grass swards E1.71
(E4.31)
1,48 0,16
3. Forests and seminatural areas 868,
25
92,81
3.1.1 Broad-
leaved
forests
X (3.1.1) Oak-hornbeam forests G1.A16 2,44 0,26
91G0* Pannonic woods with
Quercus.
petraea & Carpinus
betululus
A1.A16 231,
29
24,72
91H0* Pannonian woods with
Quercus
pubescens
41.7374 10,6
7
1,14
91M0 Pannonian-Balkanic
turkey oaksessile
oak forests
G1.76 22,5
5
2,41
9180* Tilio-Acerion forest of
slopes,
screes and ravines
G1.B5 92,4
9
9,89
3.1.3. Mixed
forests
9130 Asperulo-Fagetum
beech
forests
G1.63 492,
44
52,64
3.2.4 Transitional
woodland
shrub
40A0* Continental deciduous
thickets
F3.24 5,69 0,61
X (3.2.4) Temperate thickets and
scrub
F3.1 6,84 0,73
3.3.2 Bare rocks 8150 Medio-European
upland
siliceous screes
H2.32
(H2.5)
0,29 0,03
8220 Siliceous rocky slopes
witch
chasmophytic
vegetation
H3.11 3,55 0,38
Total area (TA) / hectares (ha) 935,
56
100 %
The study area of Sitno Natura 2000 Sites is located in Slovakia,
central Europe. This area (Fig.1) belongs to the pan-European Natura
2000 network of ecologically protected areas.
Natura 2000 sites are defined as pan- European reserved nature
zones, which meet the requirements of high environmental criteria
and belong to natural heritage of Europe. These landscapes are under
strict environmental protection due to their high ecological value,
unique species, rich biodiversity and other characteristics. Selected
under Natura 2000 programme, habitats and endangered species of
high ecological value and significance are considered as primary
targets of nature conservation. Sitno Natura 2000 Sites include
unique landscapes with rare and endangered species. Therefore, they
have high environmental and natural value, as important part of the
Slovakian and European natural heritage. At the same time, there are
detected anthropogenic impacts on Sitno Natura 2000 Sites, caused
by the uncontrolled tourism and other factors.
Table 1 Habitats representation and the area of
Sitno Nature 2000 Site
Table 3 Determination of ecological significance of study area
LCC Code
Annex
Code Sa
NP PD MPS PSSD MSI
Sc
P(%) Sb P(%) Sb P(%) Sb P(%) Sb P(%) Sb
Artificial
surfaces
X 5 5 5 5 5 5 5
1.1.2 X(1.1.2) 5 3,81 5 3,81 5 0,53 5 0,27 5 3,37 5 5
1.2.2 X(1.2.2) 5 6,67 5 6,67 5 1,96 5 1,70 5 22,21 5 5
Agricultural
area
x 2 2 2 2 2 2 2
6510 2 14,2 2 14,2 2 2,33 2 1,79 2 4,27 2 2
2.3.1
X(2.3.1) 3 0,95 3 0,95 3 0,39 3 0,00 3 5,40 3 3
6410 2 4,76 2 4,76 2 0,58 2 0,42 2 3,51 2 2
6110* 1 2,86 1 2,86 1 0,58 1 1,29 1 3,68 1 1
6210 2 3,81 2 3,81 2 0,78 2 0,63 2 3,55 2 2
6240* 1 3,81 1 3,81 1 3,94 1 1,74 1 4,93 1 1
6230 1 0.95 1 0,95 1 1,67 1 0,00 1 4,11 1 1
Forests & semi-
natural areas
X 2 2 2 2 2 2 2
3.1.1
X(3.1.1) 2 1,90 2 1,91 2 1,38 2 0,86 2 4,44 2 2
91G0* 1 17,1 1 17,15 1 14,58 1 29,28 2 4,72 1 2
91H0* 1 4,76 1 4,76 1 2,42 1 2,53 1 3,33 1 1
91M0 1 3,81 1 3,81 1 6,40 1 3,07 1 4,06 1 1
9180* 1 6,67 1 6,67 1 15,00 1 20,01 2 4,47 1 2
3.1.3 9130 2 13,3 2 13,3 2 39,92 3 35,06 4 4,77 2 4
3.2.4 40A0* 1 3,81 1 3,81 1 1,61 1 0,49 1 3,96 1 1
X(3.2.4) 3 4,76 3 4,76 3 1,55 3 1,86 3 4,81 3 3
3.3.2 8150 2 0,95 2 0,95 2 0,33 2 0,00 2 4,03 2 2
8220 2 0,95 2 0,95 2 4,03 2 0,00 2 6,32 2 2
Total landscape value 3 3 3 3 3 3 3
7. Acknowledgment
The financial support of this research has been partly provided by the SAIA Scholarship Committee of the Slovakian Academic
Information Agency and Slovak Research and Development Agency within bilateral grant schemes.
The data used in the current work were distributed by the Matej Bel University, Department of Natural Sciences
4. Results
The main result of this work is determined ecological significance of Sitno
Natura 2000 Site. The ecological significance of landscape elements
represents numerical values (degrees), which interpret quality of the on-
going ecological process in landscape. The zoning of the protected area is
done according to the degrees of the ecological significance. This process
objectively divides study area into different zones with separately regime
for nature conservation and landscape usage. It is characterized as a
process based on the objective and ecological approach that respects
human sustainable development.
4.3 Diversifying study area on zones
Natura 2000 sites are designed according to the ecological and biogeographical criteria, in order to meet
specific conservation objectives that are to be achieved by the appropriate conservation measures. They also
provide a wide range of provisioning, regulating and sociocultural ecosystem services (Kettunen et al., 2009).
Sitno Natura 2000 Site represents type of the protected area, where human impacts are detected, though not in
a wide range. The final ecological significance of the study area is in the same range as at the initial level.
According to the mentioned above situation, we may conclude that human impact is not destructing natural
processes, naturalness and natural functioning (self-regulatory processes) within the habitats. The spatial
organization of the study area has been described according to the final ecological significance and partial
ecological interpretation of the landscape metrics (Figure 2). Every part of the study area represents zone with
different regime of conservation. Three different types of zones are described and defined as parts of the
holistic nature of the protected area, diverse in natural values, originality, ecosystem extent, human actions and
human land use types. First, “zone A” represents the “silent” zone, i.e. the most stringent level of protection,
“zone B” is an area under limited using, and finally, “zone C” is an area suitable for human sustainable
development.
4.2 Ecological significance of study area
Ecological significance of landscape elements is based on the described above methodology.
The Table 3 illustrates starting value (SA) of each one habitat. It is a baseline value of the ecological significance, where
degrees are assigned according to Hrnčiarová et al. (1997). The study area has ecological significance at degree 3.
Modification (SB) of this starting was realized according to: - Value outputs of the landscape metrics for each habitat and
their percentage proportion to the metric´s total number. - Scale degree which has stabile or moving values by increasing
method. The final degree of the ecological significance is assessed by the mathematical average using partial ecological
significance. The study area has final ecological significance (SC) at degree 3, but this value is needed to be diversified to
the main class categories of habitats which are represented in the study area. "Artificial surfaces" occupy only 1,49 % of
the total area and have final ecological significance at degree 5. "Agricultural areas" occupy 5,69 % and have value of SC
at degree 2. Finally, the last class is represented by "Forests and semi-natural areas", which occupy 92,81 % and have
degree 2 as well. The mentioned above values represent background materials for the diversification of the study area on
zones with special regime of nature and landscape conservation within each zone accordingly.
This is done using information on area, size, density and shapes of the
landscapes. Patches, separate parts of the landscapes, were classified
using code classification, which allowed to divide landscapes into three
ground categories: 1) Artificial surfaces 2) Agricultural areas 3). Forests
and seminatural areas. These categories were further sub-divided into 19
sub-clusters, which were defined according to the reference scale and
methodological concept of habitat classification.
During the interpretation, the levels of ecological significance (SA) were
assigned to every habitat. This process is based on the analysis and
assessment of ecological processes in the landscape. The next step
modifies the assigned degrees by the percentage proportion (P%) of
habitat´s metrics (NP, PD, MPS, PSSD and MSI) to the total number of
the metric´s value. Percentage proportion modified starting value of the
ecological significance (SA). The result value of the modification factor
is partial ecological significance (SB). The final ecological significance
for the habitats (value SC) is presented as match average of values SB.
Outputs values of MPS (Table 2) focus on fact that Artificial surfaces have very small
mean size (2,21 ha) within mutual relationship with NP and CA / TA occupy total
landscape in partial form. On the other side, the category of Forest and semi-natural areas
occupies wide range of the landscape and is diversified into big sum of NP and MPS.
The most significant patch value is located in habitat of Tilio-Acerion forest of slopes,
screes and ravines (9180*), where MPS is 13,21 ha and CA is 92,49 ha. Comparable
patch is Pannonic woods with Quercus petraea & Carpinus betululus (91G0*) but CA
represent almost 3 time more value. Each one patch of habitat 9180* indices big size, and
it looks like compact biotope, which is not common in Slovakian environment. This
habitat is endangered due to its small scale and fragmented appearance. Another
remarkable habitat is Pannonic woods & Quercus. petraea & Carpinus betululus (91G0*).
Its values of MPS, CA and NP indicate small size for some patches within the habitat.
Patch size standard deviation (PSSD) is focused on the significance of the size difference
among the patches within the landscape (Table 2).
The value of PSSD that is closer to zero means the same size of
all patches which indicates uniform structure of patches, created
by human impact or human planning of landscape. The biggest
deviation sizes have the following habitats: Asperulo-Fagetum
beech forests (9130), Pannonic woods with Quercus. petraea &
Carpinus betululus (91G0*) and Tilio-Acerion forest of slopes,
screes and ravines (9180*).
According to the above interpretation of habitat 9180*, we can
conclude that natural processes are dominating within these
habitat patches. This value is needed to be interpreted with other
metrics. Visual example is habitat 91G0* with value
combination of MPS, CA, NP and PSSD, which illustrates small
size of patches and, at the same time, different scale size within
them. It should be interpreted as human impact based on
forestry which is common in Slovakia. This type of habitat is
threatened by the mismanagement, dimensions of intensive
using and expansions of acacia.
For these reasons, they are highly endangered habitats. No type
of human impact in form of tourism is detected within these
habitats. The Mean size index (MSI) indicates shape of patches
(Table 2). The Value index increases with irregularity of the
patch shape. Patches with low values have circular shape and
imply small range of human impact. This metrics should be
interpreted with the Number of patches or area.
According to NP and CA/TA, the most significant value range
have artificial surfaces. Very high value has agricultural area in
relation to size of patches. It indicates human impact within this
area, on one side by agricultural and historical settlement
genesis and on the other side, by tourism.
4.1 Landscape elements of the study area
Landscape of the study area is diversified into three base categories:
1. Artificial surfaces, where abstracted human impact; 2. Agricultural
area, without any part of arable land; 3. Forests and semi-natural areas.
Mentioned categories are divided into 19 sub-categories (Table 1).
The number of categories is defined in accordance with used referenced
scale and with the methodological concept of habitat classification. The
most representative landscape element within the study area is Asperulo-
Fagetum beech forests (9130), as shown in Table 1. It occupies 52,64 %
of the total area (TA). The study area is represented (91,81 % of TA)
mostly by Forests and semi-natural areas. The number of patches (NP) in
the study area reaches 105.
The Patch density (PD) shows distribution and concentration of patches in the landscape,
with values 11,22 patches per 1000 ha. It is very small value, which indicates large and
compact patches. The study area is not fragmented too much, though, notably, as shown
in Table 2: A) Number of categories and subcategories, B) Number of patches, C) Patch
density and D) Class area (CA) and TA. The Mean patch size (MPS) was determined
from the Number of patches and their area.
Riga Technical University Institute of Energy Systems and Environment. Faculty of Power and Electrical Engineering Kronvalda bulv.1 Riga, Latvia.
54th International Scientific Conference “Environmental and Climate Technologies”, October 14-16, 2013, Riga. Latvia.

More Related Content

Similar to Interpretation of Landscape Values, Typology and Quality Using Methods of Spatial Metrics for Ecological Planning

Landslide Risk Reduction Plan for Pashupati Monument Zone (Kathmandu Valley ...
Landslide Risk Reduction Plan for Pashupati Monument Zone  (Kathmandu Valley ...Landslide Risk Reduction Plan for Pashupati Monument Zone  (Kathmandu Valley ...
Landslide Risk Reduction Plan for Pashupati Monument Zone (Kathmandu Valley ...Akrur Mahat
 
Ecological Analysis & Visualisation using GIS to Inform Planning for Large In...
Ecological Analysis & Visualisation using GIS to Inform Planning for Large In...Ecological Analysis & Visualisation using GIS to Inform Planning for Large In...
Ecological Analysis & Visualisation using GIS to Inform Planning for Large In...Comit Projects Ltd
 
GIS and landscape Restoration
GIS and landscape RestorationGIS and landscape Restoration
GIS and landscape Restorationtrisurat2000
 
Dr. pavlos konstantinidis (forest research institute of thessaloniki) “use of...
Dr. pavlos konstantinidis (forest research institute of thessaloniki) “use of...Dr. pavlos konstantinidis (forest research institute of thessaloniki) “use of...
Dr. pavlos konstantinidis (forest research institute of thessaloniki) “use of...anest_trip
 
The economic value of ecosystem services is not spatially congruent with biod...
The economic value of ecosystem services is not spatially congruent with biod...The economic value of ecosystem services is not spatially congruent with biod...
The economic value of ecosystem services is not spatially congruent with biod...CIFOR-ICRAF
 
The performance of portable mid-infrared spectroscopy for the prediction of s...
The performance of portable mid-infrared spectroscopy for the prediction of s...The performance of portable mid-infrared spectroscopy for the prediction of s...
The performance of portable mid-infrared spectroscopy for the prediction of s...ExternalEvents
 
Spatial Analysis for the Environmental Mapping of the Šumava National Park
Spatial Analysis for the Environmental Mapping of the Šumava National ParkSpatial Analysis for the Environmental Mapping of the Šumava National Park
Spatial Analysis for the Environmental Mapping of the Šumava National ParkUniversität Salzburg
 
Appendix iii tosonkhulstai_monitoringpresentation
Appendix iii tosonkhulstai_monitoringpresentationAppendix iii tosonkhulstai_monitoringpresentation
Appendix iii tosonkhulstai_monitoringpresentationTuugii Tuguldur
 
NanoFASE exposure assessment: Low tier
NanoFASE exposure assessment: Low tierNanoFASE exposure assessment: Low tier
NanoFASE exposure assessment: Low tierAnna Sapundzhieva
 
Characterizing Forest Degradation and Carbon Biomass Assessment in Tropical ...
Characterizing Forest Degradation and Carbon Biomass Assessment  in Tropical ...Characterizing Forest Degradation and Carbon Biomass Assessment  in Tropical ...
Characterizing Forest Degradation and Carbon Biomass Assessment in Tropical ...CIFOR-ICRAF
 
Masters Thesis Defense Presentation
Masters Thesis Defense PresentationMasters Thesis Defense Presentation
Masters Thesis Defense Presentationnancyanne
 
Comparison of treatment methods for the assessment of environmental impacts o...
Comparison of treatment methods for the assessment of environmental impacts o...Comparison of treatment methods for the assessment of environmental impacts o...
Comparison of treatment methods for the assessment of environmental impacts o...Premier Publishers
 
Soil Organic Carbon Map of Mexico
Soil Organic Carbon Map of MexicoSoil Organic Carbon Map of Mexico
Soil Organic Carbon Map of MexicoExternalEvents
 
Handbook Of Soil Analysis
Handbook Of Soil AnalysisHandbook Of Soil Analysis
Handbook Of Soil AnalysisMarisaCape
 
Experimental Characterization of Municipal Solid Waste for Energy Production ...
Experimental Characterization of Municipal Solid Waste for Energy Production ...Experimental Characterization of Municipal Solid Waste for Energy Production ...
Experimental Characterization of Municipal Solid Waste for Energy Production ...theijes
 
Modeling the Chlorophyll-a from Sea Surface Reflectance in West Africa by Dee...
Modeling the Chlorophyll-a from Sea Surface Reflectance in West Africa by Dee...Modeling the Chlorophyll-a from Sea Surface Reflectance in West Africa by Dee...
Modeling the Chlorophyll-a from Sea Surface Reflectance in West Africa by Dee...gerogepatton
 
BC Protected Area Research Forum Presentation
BC Protected Area Research Forum PresentationBC Protected Area Research Forum Presentation
BC Protected Area Research Forum Presentationnancyanne
 
MODELING THE CHLOROPHYLL-A FROM SEA SURFACE REFLECTANCE IN WEST AFRICA BY DEE...
MODELING THE CHLOROPHYLL-A FROM SEA SURFACE REFLECTANCE IN WEST AFRICA BY DEE...MODELING THE CHLOROPHYLL-A FROM SEA SURFACE REFLECTANCE IN WEST AFRICA BY DEE...
MODELING THE CHLOROPHYLL-A FROM SEA SURFACE REFLECTANCE IN WEST AFRICA BY DEE...gerogepatton
 
MODELING THE CHLOROPHYLL-A FROM SEA SURFACE REFLECTANCE IN WEST AFRICA BY DEE...
MODELING THE CHLOROPHYLL-A FROM SEA SURFACE REFLECTANCE IN WEST AFRICA BY DEE...MODELING THE CHLOROPHYLL-A FROM SEA SURFACE REFLECTANCE IN WEST AFRICA BY DEE...
MODELING THE CHLOROPHYLL-A FROM SEA SURFACE REFLECTANCE IN WEST AFRICA BY DEE...ijaia
 

Similar to Interpretation of Landscape Values, Typology and Quality Using Methods of Spatial Metrics for Ecological Planning (20)

Landslide Risk Reduction Plan for Pashupati Monument Zone (Kathmandu Valley ...
Landslide Risk Reduction Plan for Pashupati Monument Zone  (Kathmandu Valley ...Landslide Risk Reduction Plan for Pashupati Monument Zone  (Kathmandu Valley ...
Landslide Risk Reduction Plan for Pashupati Monument Zone (Kathmandu Valley ...
 
Ecological Analysis & Visualisation using GIS to Inform Planning for Large In...
Ecological Analysis & Visualisation using GIS to Inform Planning for Large In...Ecological Analysis & Visualisation using GIS to Inform Planning for Large In...
Ecological Analysis & Visualisation using GIS to Inform Planning for Large In...
 
GIS and landscape Restoration
GIS and landscape RestorationGIS and landscape Restoration
GIS and landscape Restoration
 
Dr. pavlos konstantinidis (forest research institute of thessaloniki) “use of...
Dr. pavlos konstantinidis (forest research institute of thessaloniki) “use of...Dr. pavlos konstantinidis (forest research institute of thessaloniki) “use of...
Dr. pavlos konstantinidis (forest research institute of thessaloniki) “use of...
 
The economic value of ecosystem services is not spatially congruent with biod...
The economic value of ecosystem services is not spatially congruent with biod...The economic value of ecosystem services is not spatially congruent with biod...
The economic value of ecosystem services is not spatially congruent with biod...
 
The performance of portable mid-infrared spectroscopy for the prediction of s...
The performance of portable mid-infrared spectroscopy for the prediction of s...The performance of portable mid-infrared spectroscopy for the prediction of s...
The performance of portable mid-infrared spectroscopy for the prediction of s...
 
Spatial Analysis for the Environmental Mapping of the Šumava National Park
Spatial Analysis for the Environmental Mapping of the Šumava National ParkSpatial Analysis for the Environmental Mapping of the Šumava National Park
Spatial Analysis for the Environmental Mapping of the Šumava National Park
 
Appendix iii tosonkhulstai_monitoringpresentation
Appendix iii tosonkhulstai_monitoringpresentationAppendix iii tosonkhulstai_monitoringpresentation
Appendix iii tosonkhulstai_monitoringpresentation
 
It2616761684
It2616761684It2616761684
It2616761684
 
NanoFASE exposure assessment: Low tier
NanoFASE exposure assessment: Low tierNanoFASE exposure assessment: Low tier
NanoFASE exposure assessment: Low tier
 
Characterizing Forest Degradation and Carbon Biomass Assessment in Tropical ...
Characterizing Forest Degradation and Carbon Biomass Assessment  in Tropical ...Characterizing Forest Degradation and Carbon Biomass Assessment  in Tropical ...
Characterizing Forest Degradation and Carbon Biomass Assessment in Tropical ...
 
Masters Thesis Defense Presentation
Masters Thesis Defense PresentationMasters Thesis Defense Presentation
Masters Thesis Defense Presentation
 
Comparison of treatment methods for the assessment of environmental impacts o...
Comparison of treatment methods for the assessment of environmental impacts o...Comparison of treatment methods for the assessment of environmental impacts o...
Comparison of treatment methods for the assessment of environmental impacts o...
 
Soil Organic Carbon Map of Mexico
Soil Organic Carbon Map of MexicoSoil Organic Carbon Map of Mexico
Soil Organic Carbon Map of Mexico
 
Handbook Of Soil Analysis
Handbook Of Soil AnalysisHandbook Of Soil Analysis
Handbook Of Soil Analysis
 
Experimental Characterization of Municipal Solid Waste for Energy Production ...
Experimental Characterization of Municipal Solid Waste for Energy Production ...Experimental Characterization of Municipal Solid Waste for Energy Production ...
Experimental Characterization of Municipal Solid Waste for Energy Production ...
 
Modeling the Chlorophyll-a from Sea Surface Reflectance in West Africa by Dee...
Modeling the Chlorophyll-a from Sea Surface Reflectance in West Africa by Dee...Modeling the Chlorophyll-a from Sea Surface Reflectance in West Africa by Dee...
Modeling the Chlorophyll-a from Sea Surface Reflectance in West Africa by Dee...
 
BC Protected Area Research Forum Presentation
BC Protected Area Research Forum PresentationBC Protected Area Research Forum Presentation
BC Protected Area Research Forum Presentation
 
MODELING THE CHLOROPHYLL-A FROM SEA SURFACE REFLECTANCE IN WEST AFRICA BY DEE...
MODELING THE CHLOROPHYLL-A FROM SEA SURFACE REFLECTANCE IN WEST AFRICA BY DEE...MODELING THE CHLOROPHYLL-A FROM SEA SURFACE REFLECTANCE IN WEST AFRICA BY DEE...
MODELING THE CHLOROPHYLL-A FROM SEA SURFACE REFLECTANCE IN WEST AFRICA BY DEE...
 
MODELING THE CHLOROPHYLL-A FROM SEA SURFACE REFLECTANCE IN WEST AFRICA BY DEE...
MODELING THE CHLOROPHYLL-A FROM SEA SURFACE REFLECTANCE IN WEST AFRICA BY DEE...MODELING THE CHLOROPHYLL-A FROM SEA SURFACE REFLECTANCE IN WEST AFRICA BY DEE...
MODELING THE CHLOROPHYLL-A FROM SEA SURFACE REFLECTANCE IN WEST AFRICA BY DEE...
 

More from Universität Salzburg

Accurate and rapid big spatial data processing by scripting cartographic algo...
Accurate and rapid big spatial data processing by scripting cartographic algo...Accurate and rapid big spatial data processing by scripting cartographic algo...
Accurate and rapid big spatial data processing by scripting cartographic algo...Universität Salzburg
 
Risks of Cryogenic Landslide Hazards and Their Impact on Ecosystems in Cold E...
Risks of Cryogenic Landslide Hazards and Their Impact on Ecosystems in Cold E...Risks of Cryogenic Landslide Hazards and Their Impact on Ecosystems in Cold E...
Risks of Cryogenic Landslide Hazards and Their Impact on Ecosystems in Cold E...Universität Salzburg
 
Bringing Geospatial Analysis to the Social Studies: an Assessment of the City...
Bringing Geospatial Analysis to the Social Studies: an Assessment of the City...Bringing Geospatial Analysis to the Social Studies: an Assessment of the City...
Bringing Geospatial Analysis to the Social Studies: an Assessment of the City...Universität Salzburg
 
Detection of Vegetation Coverage in Urban Agglomeration of Brussels by NDVI I...
Detection of Vegetation Coverage in Urban Agglomeration of Brussels by NDVI I...Detection of Vegetation Coverage in Urban Agglomeration of Brussels by NDVI I...
Detection of Vegetation Coverage in Urban Agglomeration of Brussels by NDVI I...Universität Salzburg
 
Investigation of the Lake Victoria Region (Africa: Tanzania, Kenya and Uganda)
Investigation of the Lake Victoria Region (Africa: Tanzania, Kenya and Uganda)Investigation of the Lake Victoria Region (Africa: Tanzania, Kenya and Uganda)
Investigation of the Lake Victoria Region (Africa: Tanzania, Kenya and Uganda)Universität Salzburg
 
Mapping Land Cover Changes Using Landsat TM: a Case Study of Yamal Ecosystems...
Mapping Land Cover Changes Using Landsat TM: a Case Study of Yamal Ecosystems...Mapping Land Cover Changes Using Landsat TM: a Case Study of Yamal Ecosystems...
Mapping Land Cover Changes Using Landsat TM: a Case Study of Yamal Ecosystems...Universität Salzburg
 
Economic assessment of landslide risk for the Waidhofen a.d. Ybbs region, Alp...
Economic assessment of landslide risk for the Waidhofen a.d. Ybbs region, Alp...Economic assessment of landslide risk for the Waidhofen a.d. Ybbs region, Alp...
Economic assessment of landslide risk for the Waidhofen a.d. Ybbs region, Alp...Universität Salzburg
 
Quality assessment of data from CHRIS/PROBA
Quality assessment of data from CHRIS/PROBAQuality assessment of data from CHRIS/PROBA
Quality assessment of data from CHRIS/PROBAUniversität Salzburg
 
Conservation Area Designation in the Andes
Conservation Area Designation in the AndesConservation Area Designation in the Andes
Conservation Area Designation in the AndesUniversität Salzburg
 
Seagrass mapping and monitoring along the coast of Crete, Greece
Seagrass mapping and monitoring along the coast of Crete, GreeceSeagrass mapping and monitoring along the coast of Crete, Greece
Seagrass mapping and monitoring along the coast of Crete, GreeceUniversität Salzburg
 
Why Should We Stand for Geothermal Energy ? Example of the Negative Impacts o...
Why Should We Stand for Geothermal Energy ? Example of the Negative Impacts o...Why Should We Stand for Geothermal Energy ? Example of the Negative Impacts o...
Why Should We Stand for Geothermal Energy ? Example of the Negative Impacts o...Universität Salzburg
 
Using ArcGIS in Teaching Geosciences
Using ArcGIS in Teaching GeosciencesUsing ArcGIS in Teaching Geosciences
Using ArcGIS in Teaching GeosciencesUniversität Salzburg
 
How could obligation chain be structured along cross-border gas supply for...
   How could obligation chain be structured along cross-border gas supply for...   How could obligation chain be structured along cross-border gas supply for...
How could obligation chain be structured along cross-border gas supply for...Universität Salzburg
 
Using K-means algorithm classifier for urban landscapes classification in Tai...
Using K-means algorithm classifier for urban landscapes classification in Tai...Using K-means algorithm classifier for urban landscapes classification in Tai...
Using K-means algorithm classifier for urban landscapes classification in Tai...Universität Salzburg
 
Rural Sustainability and Management of Natural Resources in Tian Shan Region,...
Rural Sustainability and Management of Natural Resources in Tian Shan Region,...Rural Sustainability and Management of Natural Resources in Tian Shan Region,...
Rural Sustainability and Management of Natural Resources in Tian Shan Region,...Universität Salzburg
 
Mapping Agricultural Lands by Means of GIS for Monitoring Use of Natural Reso...
Mapping Agricultural Lands by Means of GIS for Monitoring Use of Natural Reso...Mapping Agricultural Lands by Means of GIS for Monitoring Use of Natural Reso...
Mapping Agricultural Lands by Means of GIS for Monitoring Use of Natural Reso...Universität Salzburg
 
Seagrass Mapping and Monitoring Along the Coasts of Crete, Greece
Seagrass Mapping and Monitoring Along the Coasts of Crete, GreeceSeagrass Mapping and Monitoring Along the Coasts of Crete, Greece
Seagrass Mapping and Monitoring Along the Coasts of Crete, GreeceUniversität Salzburg
 
Data Sharing, Distribution and Updating Using Social Coding Community Github ...
Data Sharing, Distribution and Updating Using Social Coding Community Github ...Data Sharing, Distribution and Updating Using Social Coding Community Github ...
Data Sharing, Distribution and Updating Using Social Coding Community Github ...Universität Salzburg
 

More from Universität Salzburg (20)

Accurate and rapid big spatial data processing by scripting cartographic algo...
Accurate and rapid big spatial data processing by scripting cartographic algo...Accurate and rapid big spatial data processing by scripting cartographic algo...
Accurate and rapid big spatial data processing by scripting cartographic algo...
 
Presentation lemenkova
Presentation lemenkovaPresentation lemenkova
Presentation lemenkova
 
Risks of Cryogenic Landslide Hazards and Their Impact on Ecosystems in Cold E...
Risks of Cryogenic Landslide Hazards and Their Impact on Ecosystems in Cold E...Risks of Cryogenic Landslide Hazards and Their Impact on Ecosystems in Cold E...
Risks of Cryogenic Landslide Hazards and Their Impact on Ecosystems in Cold E...
 
Bringing Geospatial Analysis to the Social Studies: an Assessment of the City...
Bringing Geospatial Analysis to the Social Studies: an Assessment of the City...Bringing Geospatial Analysis to the Social Studies: an Assessment of the City...
Bringing Geospatial Analysis to the Social Studies: an Assessment of the City...
 
Detection of Vegetation Coverage in Urban Agglomeration of Brussels by NDVI I...
Detection of Vegetation Coverage in Urban Agglomeration of Brussels by NDVI I...Detection of Vegetation Coverage in Urban Agglomeration of Brussels by NDVI I...
Detection of Vegetation Coverage in Urban Agglomeration of Brussels by NDVI I...
 
Investigation of the Lake Victoria Region (Africa: Tanzania, Kenya and Uganda)
Investigation of the Lake Victoria Region (Africa: Tanzania, Kenya and Uganda)Investigation of the Lake Victoria Region (Africa: Tanzania, Kenya and Uganda)
Investigation of the Lake Victoria Region (Africa: Tanzania, Kenya and Uganda)
 
Mapping Land Cover Changes Using Landsat TM: a Case Study of Yamal Ecosystems...
Mapping Land Cover Changes Using Landsat TM: a Case Study of Yamal Ecosystems...Mapping Land Cover Changes Using Landsat TM: a Case Study of Yamal Ecosystems...
Mapping Land Cover Changes Using Landsat TM: a Case Study of Yamal Ecosystems...
 
Economic assessment of landslide risk for the Waidhofen a.d. Ybbs region, Alp...
Economic assessment of landslide risk for the Waidhofen a.d. Ybbs region, Alp...Economic assessment of landslide risk for the Waidhofen a.d. Ybbs region, Alp...
Economic assessment of landslide risk for the Waidhofen a.d. Ybbs region, Alp...
 
Quality assessment of data from CHRIS/PROBA
Quality assessment of data from CHRIS/PROBAQuality assessment of data from CHRIS/PROBA
Quality assessment of data from CHRIS/PROBA
 
Conservation Area Designation in the Andes
Conservation Area Designation in the AndesConservation Area Designation in the Andes
Conservation Area Designation in the Andes
 
Seagrass mapping and monitoring along the coast of Crete, Greece
Seagrass mapping and monitoring along the coast of Crete, GreeceSeagrass mapping and monitoring along the coast of Crete, Greece
Seagrass mapping and monitoring along the coast of Crete, Greece
 
Why Should We Stand for Geothermal Energy ? Example of the Negative Impacts o...
Why Should We Stand for Geothermal Energy ? Example of the Negative Impacts o...Why Should We Stand for Geothermal Energy ? Example of the Negative Impacts o...
Why Should We Stand for Geothermal Energy ? Example of the Negative Impacts o...
 
Using ArcGIS in Teaching Geosciences
Using ArcGIS in Teaching GeosciencesUsing ArcGIS in Teaching Geosciences
Using ArcGIS in Teaching Geosciences
 
How could obligation chain be structured along cross-border gas supply for...
   How could obligation chain be structured along cross-border gas supply for...   How could obligation chain be structured along cross-border gas supply for...
How could obligation chain be structured along cross-border gas supply for...
 
Urban Sprawl in Estonia
Urban Sprawl in EstoniaUrban Sprawl in Estonia
Urban Sprawl in Estonia
 
Using K-means algorithm classifier for urban landscapes classification in Tai...
Using K-means algorithm classifier for urban landscapes classification in Tai...Using K-means algorithm classifier for urban landscapes classification in Tai...
Using K-means algorithm classifier for urban landscapes classification in Tai...
 
Rural Sustainability and Management of Natural Resources in Tian Shan Region,...
Rural Sustainability and Management of Natural Resources in Tian Shan Region,...Rural Sustainability and Management of Natural Resources in Tian Shan Region,...
Rural Sustainability and Management of Natural Resources in Tian Shan Region,...
 
Mapping Agricultural Lands by Means of GIS for Monitoring Use of Natural Reso...
Mapping Agricultural Lands by Means of GIS for Monitoring Use of Natural Reso...Mapping Agricultural Lands by Means of GIS for Monitoring Use of Natural Reso...
Mapping Agricultural Lands by Means of GIS for Monitoring Use of Natural Reso...
 
Seagrass Mapping and Monitoring Along the Coasts of Crete, Greece
Seagrass Mapping and Monitoring Along the Coasts of Crete, GreeceSeagrass Mapping and Monitoring Along the Coasts of Crete, Greece
Seagrass Mapping and Monitoring Along the Coasts of Crete, Greece
 
Data Sharing, Distribution and Updating Using Social Coding Community Github ...
Data Sharing, Distribution and Updating Using Social Coding Community Github ...Data Sharing, Distribution and Updating Using Social Coding Community Github ...
Data Sharing, Distribution and Updating Using Social Coding Community Github ...
 

Recently uploaded

STERILITY TESTING OF PHARMACEUTICALS ppt by DR.C.P.PRINCE
STERILITY TESTING OF PHARMACEUTICALS ppt by DR.C.P.PRINCESTERILITY TESTING OF PHARMACEUTICALS ppt by DR.C.P.PRINCE
STERILITY TESTING OF PHARMACEUTICALS ppt by DR.C.P.PRINCEPRINCE C P
 
SOLUBLE PATTERN RECOGNITION RECEPTORS.pptx
SOLUBLE PATTERN RECOGNITION RECEPTORS.pptxSOLUBLE PATTERN RECOGNITION RECEPTORS.pptx
SOLUBLE PATTERN RECOGNITION RECEPTORS.pptxkessiyaTpeter
 
Raman spectroscopy.pptx M Pharm, M Sc, Advanced Spectral Analysis
Raman spectroscopy.pptx M Pharm, M Sc, Advanced Spectral AnalysisRaman spectroscopy.pptx M Pharm, M Sc, Advanced Spectral Analysis
Raman spectroscopy.pptx M Pharm, M Sc, Advanced Spectral AnalysisDiwakar Mishra
 
Presentation Vikram Lander by Vedansh Gupta.pptx
Presentation Vikram Lander by Vedansh Gupta.pptxPresentation Vikram Lander by Vedansh Gupta.pptx
Presentation Vikram Lander by Vedansh Gupta.pptxgindu3009
 
Nanoparticles synthesis and characterization​ ​
Nanoparticles synthesis and characterization​  ​Nanoparticles synthesis and characterization​  ​
Nanoparticles synthesis and characterization​ ​kaibalyasahoo82800
 
TEST BANK For Radiologic Science for Technologists, 12th Edition by Stewart C...
TEST BANK For Radiologic Science for Technologists, 12th Edition by Stewart C...TEST BANK For Radiologic Science for Technologists, 12th Edition by Stewart C...
TEST BANK For Radiologic Science for Technologists, 12th Edition by Stewart C...ssifa0344
 
Botany 4th semester series (krishna).pdf
Botany 4th semester series (krishna).pdfBotany 4th semester series (krishna).pdf
Botany 4th semester series (krishna).pdfSumit Kumar yadav
 
Hubble Asteroid Hunter III. Physical properties of newly found asteroids
Hubble Asteroid Hunter III. Physical properties of newly found asteroidsHubble Asteroid Hunter III. Physical properties of newly found asteroids
Hubble Asteroid Hunter III. Physical properties of newly found asteroidsSérgio Sacani
 
GBSN - Microbiology (Unit 2)
GBSN - Microbiology (Unit 2)GBSN - Microbiology (Unit 2)
GBSN - Microbiology (Unit 2)Areesha Ahmad
 
GFP in rDNA Technology (Biotechnology).pptx
GFP in rDNA Technology (Biotechnology).pptxGFP in rDNA Technology (Biotechnology).pptx
GFP in rDNA Technology (Biotechnology).pptxAleenaTreesaSaji
 
Chromatin Structure | EUCHROMATIN | HETEROCHROMATIN
Chromatin Structure | EUCHROMATIN | HETEROCHROMATINChromatin Structure | EUCHROMATIN | HETEROCHROMATIN
Chromatin Structure | EUCHROMATIN | HETEROCHROMATINsankalpkumarsahoo174
 
Formation of low mass protostars and their circumstellar disks
Formation of low mass protostars and their circumstellar disksFormation of low mass protostars and their circumstellar disks
Formation of low mass protostars and their circumstellar disksSérgio Sacani
 
GBSN - Biochemistry (Unit 1)
GBSN - Biochemistry (Unit 1)GBSN - Biochemistry (Unit 1)
GBSN - Biochemistry (Unit 1)Areesha Ahmad
 
Pests of cotton_Borer_Pests_Binomics_Dr.UPR.pdf
Pests of cotton_Borer_Pests_Binomics_Dr.UPR.pdfPests of cotton_Borer_Pests_Binomics_Dr.UPR.pdf
Pests of cotton_Borer_Pests_Binomics_Dr.UPR.pdfPirithiRaju
 
Botany krishna series 2nd semester Only Mcq type questions
Botany krishna series 2nd semester Only Mcq type questionsBotany krishna series 2nd semester Only Mcq type questions
Botany krishna series 2nd semester Only Mcq type questionsSumit Kumar yadav
 
Broad bean, Lima Bean, Jack bean, Ullucus.pptx
Broad bean, Lima Bean, Jack bean, Ullucus.pptxBroad bean, Lima Bean, Jack bean, Ullucus.pptx
Broad bean, Lima Bean, Jack bean, Ullucus.pptxjana861314
 
Nightside clouds and disequilibrium chemistry on the hot Jupiter WASP-43b
Nightside clouds and disequilibrium chemistry on the hot Jupiter WASP-43bNightside clouds and disequilibrium chemistry on the hot Jupiter WASP-43b
Nightside clouds and disequilibrium chemistry on the hot Jupiter WASP-43bSérgio Sacani
 
Biological Classification BioHack (3).pdf
Biological Classification BioHack (3).pdfBiological Classification BioHack (3).pdf
Biological Classification BioHack (3).pdfmuntazimhurra
 
Orientation, design and principles of polyhouse
Orientation, design and principles of polyhouseOrientation, design and principles of polyhouse
Orientation, design and principles of polyhousejana861314
 

Recently uploaded (20)

STERILITY TESTING OF PHARMACEUTICALS ppt by DR.C.P.PRINCE
STERILITY TESTING OF PHARMACEUTICALS ppt by DR.C.P.PRINCESTERILITY TESTING OF PHARMACEUTICALS ppt by DR.C.P.PRINCE
STERILITY TESTING OF PHARMACEUTICALS ppt by DR.C.P.PRINCE
 
SOLUBLE PATTERN RECOGNITION RECEPTORS.pptx
SOLUBLE PATTERN RECOGNITION RECEPTORS.pptxSOLUBLE PATTERN RECOGNITION RECEPTORS.pptx
SOLUBLE PATTERN RECOGNITION RECEPTORS.pptx
 
Raman spectroscopy.pptx M Pharm, M Sc, Advanced Spectral Analysis
Raman spectroscopy.pptx M Pharm, M Sc, Advanced Spectral AnalysisRaman spectroscopy.pptx M Pharm, M Sc, Advanced Spectral Analysis
Raman spectroscopy.pptx M Pharm, M Sc, Advanced Spectral Analysis
 
Presentation Vikram Lander by Vedansh Gupta.pptx
Presentation Vikram Lander by Vedansh Gupta.pptxPresentation Vikram Lander by Vedansh Gupta.pptx
Presentation Vikram Lander by Vedansh Gupta.pptx
 
Nanoparticles synthesis and characterization​ ​
Nanoparticles synthesis and characterization​  ​Nanoparticles synthesis and characterization​  ​
Nanoparticles synthesis and characterization​ ​
 
CELL -Structural and Functional unit of life.pdf
CELL -Structural and Functional unit of life.pdfCELL -Structural and Functional unit of life.pdf
CELL -Structural and Functional unit of life.pdf
 
TEST BANK For Radiologic Science for Technologists, 12th Edition by Stewart C...
TEST BANK For Radiologic Science for Technologists, 12th Edition by Stewart C...TEST BANK For Radiologic Science for Technologists, 12th Edition by Stewart C...
TEST BANK For Radiologic Science for Technologists, 12th Edition by Stewart C...
 
Botany 4th semester series (krishna).pdf
Botany 4th semester series (krishna).pdfBotany 4th semester series (krishna).pdf
Botany 4th semester series (krishna).pdf
 
Hubble Asteroid Hunter III. Physical properties of newly found asteroids
Hubble Asteroid Hunter III. Physical properties of newly found asteroidsHubble Asteroid Hunter III. Physical properties of newly found asteroids
Hubble Asteroid Hunter III. Physical properties of newly found asteroids
 
GBSN - Microbiology (Unit 2)
GBSN - Microbiology (Unit 2)GBSN - Microbiology (Unit 2)
GBSN - Microbiology (Unit 2)
 
GFP in rDNA Technology (Biotechnology).pptx
GFP in rDNA Technology (Biotechnology).pptxGFP in rDNA Technology (Biotechnology).pptx
GFP in rDNA Technology (Biotechnology).pptx
 
Chromatin Structure | EUCHROMATIN | HETEROCHROMATIN
Chromatin Structure | EUCHROMATIN | HETEROCHROMATINChromatin Structure | EUCHROMATIN | HETEROCHROMATIN
Chromatin Structure | EUCHROMATIN | HETEROCHROMATIN
 
Formation of low mass protostars and their circumstellar disks
Formation of low mass protostars and their circumstellar disksFormation of low mass protostars and their circumstellar disks
Formation of low mass protostars and their circumstellar disks
 
GBSN - Biochemistry (Unit 1)
GBSN - Biochemistry (Unit 1)GBSN - Biochemistry (Unit 1)
GBSN - Biochemistry (Unit 1)
 
Pests of cotton_Borer_Pests_Binomics_Dr.UPR.pdf
Pests of cotton_Borer_Pests_Binomics_Dr.UPR.pdfPests of cotton_Borer_Pests_Binomics_Dr.UPR.pdf
Pests of cotton_Borer_Pests_Binomics_Dr.UPR.pdf
 
Botany krishna series 2nd semester Only Mcq type questions
Botany krishna series 2nd semester Only Mcq type questionsBotany krishna series 2nd semester Only Mcq type questions
Botany krishna series 2nd semester Only Mcq type questions
 
Broad bean, Lima Bean, Jack bean, Ullucus.pptx
Broad bean, Lima Bean, Jack bean, Ullucus.pptxBroad bean, Lima Bean, Jack bean, Ullucus.pptx
Broad bean, Lima Bean, Jack bean, Ullucus.pptx
 
Nightside clouds and disequilibrium chemistry on the hot Jupiter WASP-43b
Nightside clouds and disequilibrium chemistry on the hot Jupiter WASP-43bNightside clouds and disequilibrium chemistry on the hot Jupiter WASP-43b
Nightside clouds and disequilibrium chemistry on the hot Jupiter WASP-43b
 
Biological Classification BioHack (3).pdf
Biological Classification BioHack (3).pdfBiological Classification BioHack (3).pdf
Biological Classification BioHack (3).pdf
 
Orientation, design and principles of polyhouse
Orientation, design and principles of polyhouseOrientation, design and principles of polyhouse
Orientation, design and principles of polyhouse
 

Interpretation of Landscape Values, Typology and Quality Using Methods of Spatial Metrics for Ecological Planning

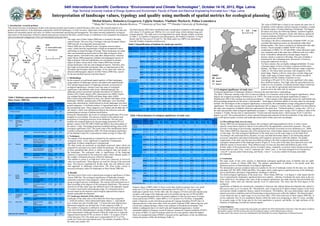
  • 1. Interpretation of landscape values, typology and quality using methods of spatial metrics for ecological planning Michal Klaučo; Bohuslava Gregorová, Uglješa Stankov, Vladimir Marković, Polina Lemenkova * Matej Bel University in Banská Bystrica, ** University of Novi Sad, *** Dresden University of Technology 6. Conclusion The main result of this work consists in determined ecological significant areas of habitats that are under protection´s system of Natura 2000 Sites. The patches quantification of habitats is the partial result that influences process of determination of ecological significance. The interpretative process examines land cover patches by the set of landscape metrics for the area, size, density and shape (NP, PD, MPS, PSSD and MSI). The output values could express a spatial processes in the landscape, such as perforation, dissection, fragmentation, shrinkage or attrition. The final ecological significance of the study area – Sitno Natura 2000 site - is at degree 3, what means that the area is represented by moderately significant land cover patches – habitats. It indicates the same value as the one at the initial level. According to the value of the ecological significance, the study area has been diversified into three zones, where each one indicates specific level of conservation. The zones and the final degree of the ecological significance of habitats are retroactively compared to historical and cultural human development that started in this area as early as in 1st century BC. Theoretically, such a long period of intense human impacts on the local environment should completely destroy natural environment. Nevertheless, this area demonstrates rather good natural ecosystems conditions and well functioning ecological processes within the habitats. The human impact is now observed only in small range of size not more than 1,50% from total area of Sitno Natura 2000 Site. It can be explained, first, by low population density within the study area comparing to other EU areas, secondly, by accurate usage of the living area by the local population in general, and thirdly, by high resilience of the elements of landscapes towards any human impacts. 1. Introduction: research problem This research focuses on landscapes studies with selected research area located in central Slovakia, Sitno area. The research purpose is to perform spatial analysis of the landscapes and patches within the landscapes, in order to assess, which parts of the selected study area have the highest environmental quality and value, for further environmental monitoring and management. This paper presents quantitative ecological assessment of the landscapes within the natural protected area located in Slovakia, central Europe. It contributes to the sustainable development and environmental management of the environmentally protected zones. 2. Methodology In this research we performed spatial analysis of Sitno landscapes using methods of landscapes metrics calculation and quantification. This include measurements of landscape elements, assessment of ecological significance, zoning of area into areas of ecological significance with different value levels. Methodologically, the landscape metrics assessment included calculations of Number of Patches (NP), Patch's density (PD), Mean patch size (MPS), Patch's size standard deviation (PSSD) and Mean shape index (MSI). 3. Techniques The output of this interpretation is defined by the stepwise levels of ecological values: 1)very significant 2) significant 3) moderately significant 4) almost insignificant 5) insignificant. The final results are presented as calculated numerical values which are assigned for each land cover patch within the landscape. The interpretation of these quantified data allows to define ecological value and quality of the landscapes. The ecological value, or significance, of the landscape elements is represented by the numerical values which indicate quality of the complex ecological processes within the landscape. This enables to assess it as high-level value (very precious) or low-level value (not significant). These degrees are used for zoning of the protected areas. This process quantitatively divides study area into different zones with approach to landscape conservation. The final results consist in assessed ecological values for landscapes in Sitno Natura 2000 Site. LCC Code Annex Code NP1 NP2 PD1 PD2 MPS1 MPS2 PSSD1 PSSD2 MSI1 MSI2 Artificial surfaces X 11 10,48 1,18 10,48 2,21 2,49 2,09 1,97 10,2 25,62 1.1.2. X(1.1.2) 4 3,81 0,43 3,81 0,47 0,53 0,29 0,27 1,34 3,37 1.2.2. X(1.2.2) 7 6,67 0,75 6,67 1,73 1,96 1,80 1,70 8,86 22,25 Agricultural areas X 33 31,43 3,53 31,43 9,05 10,27 5,16 4,87 11,71 29,45 65,10 15 14,29 1,60 14,29 2,05 2,33 1,89 1,79 1,70 4,27 X(2.3.1) 1 0,95 0,11 0,95 0,34 0,39 0,00 0,00 2,15 5,40 6410 5 4,76 0,53 4,76 0,51 0,58 0,45 0,42 1,40 3,51 6110* 3 2,86 0,32 2,86 0,51 0,58 0,31 0,29 1,46 3,68 6210 4 3,81 0,43 3,81 0,69 0,78 0,67 0,63 1,41 3,55 6240* 4 3,81 0,43 3,81 3,47 3,94 1,84 1,74 1,96 4,93 6230* 1 0,95 0,11 0,95 1,48 1,67 0,00 0,00 1,63 4,11 Forests & semi- natural areas X 61 58,08 6,52 58,11 76,85 87,22 98,48 93,15 17,88 44,91 3.1.1 X(3.1.1) 2 1,90 0,21 1,91 1,22 1,38 0,91 0,86 1,77 4,44 91G0* 18 17,14 1,92 17,15 12,85 14,58 30,96 29,28 1,88 4,72 91H0* 5 4,76 0,53 4,76 2,13 2,42 2,67 2,53 1,33 3,33 91M0 4 3,81 0,43 3,81 5,64 6,40 3,24 3,07 1,61 4,06 9180* 7 6,67 0,75 6,67 13,21 15,00 21,15 20,01 1,78 4,47 3.1.3 9130 14 13,33 1,50 13,34 35,17 39,92 37,07 35,06 1,90 4,77 3.2.4 40A0* 4 3,81 0,43 3,81 1,42 1,61 0,52 0,49 1,58 3,96 X(3.2.4) 5 4,76 0,53 4,76 1,37 1,55 1,96 1,86 1,91 4,81 3.3.2 8150 1 0,95 0,11 0,95 0,29 0,33 0,00 0,00 1,60 4,03 8220 1 0,95 0,11 0,95 3,55 4,03 0,00 0,00 2,52 6,32 Total landscape value 105, 00 100,00 11,22 100,0 0 88,11 100,0 0 105,72 100,00 39,80 100,00 Table 2 Quantification of habitats by landscape metrics CORINE Land Cover Annex EUNIS Class Area Code Description Code Description ha % 1. Artificial surfaces 13,9 8 1,49 1.1.2. Discontinuo us urban fabric X (1.1.2) x x 1,86 0.20 1.2.2. Road and rail networks and associated land X (1.2.2) x x 12,1 2 1,29 2. Agricultural area 53,3 2 5,69 2.3.1 Pastures 6510 Lowland hay meadows E2.22 30,7 9 3,29 X (2.3.1) Large Carex beds C3.26 (D5.21) 0,34 0,04 6410 Molinia meadows on calcareous, peaty or clayey-slitladen soils E3.51 2,54 0,27 6110* Middle European pioneerswards E1.11 (E1.29) 1,54 0,16 6210 Arid subcontinental steppic grassland E1.22 (E1.23) E1.28) 2,74 0,29 6240* Sub-Pannonic steppic grasslands E1.2 (E1.29) 13,8 9 1,48 6230* Mat-grass swards E1.71 (E4.31) 1,48 0,16 3. Forests and seminatural areas 868, 25 92,81 3.1.1 Broad- leaved forests X (3.1.1) Oak-hornbeam forests G1.A16 2,44 0,26 91G0* Pannonic woods with Quercus. petraea & Carpinus betululus A1.A16 231, 29 24,72 91H0* Pannonian woods with Quercus pubescens 41.7374 10,6 7 1,14 91M0 Pannonian-Balkanic turkey oaksessile oak forests G1.76 22,5 5 2,41 9180* Tilio-Acerion forest of slopes, screes and ravines G1.B5 92,4 9 9,89 3.1.3. Mixed forests 9130 Asperulo-Fagetum beech forests G1.63 492, 44 52,64 3.2.4 Transitional woodland shrub 40A0* Continental deciduous thickets F3.24 5,69 0,61 X (3.2.4) Temperate thickets and scrub F3.1 6,84 0,73 3.3.2 Bare rocks 8150 Medio-European upland siliceous screes H2.32 (H2.5) 0,29 0,03 8220 Siliceous rocky slopes witch chasmophytic vegetation H3.11 3,55 0,38 Total area (TA) / hectares (ha) 935, 56 100 % The study area of Sitno Natura 2000 Sites is located in Slovakia, central Europe. This area (Fig.1) belongs to the pan-European Natura 2000 network of ecologically protected areas. Natura 2000 sites are defined as pan- European reserved nature zones, which meet the requirements of high environmental criteria and belong to natural heritage of Europe. These landscapes are under strict environmental protection due to their high ecological value, unique species, rich biodiversity and other characteristics. Selected under Natura 2000 programme, habitats and endangered species of high ecological value and significance are considered as primary targets of nature conservation. Sitno Natura 2000 Sites include unique landscapes with rare and endangered species. Therefore, they have high environmental and natural value, as important part of the Slovakian and European natural heritage. At the same time, there are detected anthropogenic impacts on Sitno Natura 2000 Sites, caused by the uncontrolled tourism and other factors. Table 1 Habitats representation and the area of Sitno Nature 2000 Site Table 3 Determination of ecological significance of study area LCC Code Annex Code Sa NP PD MPS PSSD MSI Sc P(%) Sb P(%) Sb P(%) Sb P(%) Sb P(%) Sb Artificial surfaces X 5 5 5 5 5 5 5 1.1.2 X(1.1.2) 5 3,81 5 3,81 5 0,53 5 0,27 5 3,37 5 5 1.2.2 X(1.2.2) 5 6,67 5 6,67 5 1,96 5 1,70 5 22,21 5 5 Agricultural area x 2 2 2 2 2 2 2 6510 2 14,2 2 14,2 2 2,33 2 1,79 2 4,27 2 2 2.3.1 X(2.3.1) 3 0,95 3 0,95 3 0,39 3 0,00 3 5,40 3 3 6410 2 4,76 2 4,76 2 0,58 2 0,42 2 3,51 2 2 6110* 1 2,86 1 2,86 1 0,58 1 1,29 1 3,68 1 1 6210 2 3,81 2 3,81 2 0,78 2 0,63 2 3,55 2 2 6240* 1 3,81 1 3,81 1 3,94 1 1,74 1 4,93 1 1 6230 1 0.95 1 0,95 1 1,67 1 0,00 1 4,11 1 1 Forests & semi- natural areas X 2 2 2 2 2 2 2 3.1.1 X(3.1.1) 2 1,90 2 1,91 2 1,38 2 0,86 2 4,44 2 2 91G0* 1 17,1 1 17,15 1 14,58 1 29,28 2 4,72 1 2 91H0* 1 4,76 1 4,76 1 2,42 1 2,53 1 3,33 1 1 91M0 1 3,81 1 3,81 1 6,40 1 3,07 1 4,06 1 1 9180* 1 6,67 1 6,67 1 15,00 1 20,01 2 4,47 1 2 3.1.3 9130 2 13,3 2 13,3 2 39,92 3 35,06 4 4,77 2 4 3.2.4 40A0* 1 3,81 1 3,81 1 1,61 1 0,49 1 3,96 1 1 X(3.2.4) 3 4,76 3 4,76 3 1,55 3 1,86 3 4,81 3 3 3.3.2 8150 2 0,95 2 0,95 2 0,33 2 0,00 2 4,03 2 2 8220 2 0,95 2 0,95 2 4,03 2 0,00 2 6,32 2 2 Total landscape value 3 3 3 3 3 3 3 7. Acknowledgment The financial support of this research has been partly provided by the SAIA Scholarship Committee of the Slovakian Academic Information Agency and Slovak Research and Development Agency within bilateral grant schemes. The data used in the current work were distributed by the Matej Bel University, Department of Natural Sciences 4. Results The main result of this work is determined ecological significance of Sitno Natura 2000 Site. The ecological significance of landscape elements represents numerical values (degrees), which interpret quality of the on- going ecological process in landscape. The zoning of the protected area is done according to the degrees of the ecological significance. This process objectively divides study area into different zones with separately regime for nature conservation and landscape usage. It is characterized as a process based on the objective and ecological approach that respects human sustainable development. 4.3 Diversifying study area on zones Natura 2000 sites are designed according to the ecological and biogeographical criteria, in order to meet specific conservation objectives that are to be achieved by the appropriate conservation measures. They also provide a wide range of provisioning, regulating and sociocultural ecosystem services (Kettunen et al., 2009). Sitno Natura 2000 Site represents type of the protected area, where human impacts are detected, though not in a wide range. The final ecological significance of the study area is in the same range as at the initial level. According to the mentioned above situation, we may conclude that human impact is not destructing natural processes, naturalness and natural functioning (self-regulatory processes) within the habitats. The spatial organization of the study area has been described according to the final ecological significance and partial ecological interpretation of the landscape metrics (Figure 2). Every part of the study area represents zone with different regime of conservation. Three different types of zones are described and defined as parts of the holistic nature of the protected area, diverse in natural values, originality, ecosystem extent, human actions and human land use types. First, “zone A” represents the “silent” zone, i.e. the most stringent level of protection, “zone B” is an area under limited using, and finally, “zone C” is an area suitable for human sustainable development. 4.2 Ecological significance of study area Ecological significance of landscape elements is based on the described above methodology. The Table 3 illustrates starting value (SA) of each one habitat. It is a baseline value of the ecological significance, where degrees are assigned according to Hrnčiarová et al. (1997). The study area has ecological significance at degree 3. Modification (SB) of this starting was realized according to: - Value outputs of the landscape metrics for each habitat and their percentage proportion to the metric´s total number. - Scale degree which has stabile or moving values by increasing method. The final degree of the ecological significance is assessed by the mathematical average using partial ecological significance. The study area has final ecological significance (SC) at degree 3, but this value is needed to be diversified to the main class categories of habitats which are represented in the study area. "Artificial surfaces" occupy only 1,49 % of the total area and have final ecological significance at degree 5. "Agricultural areas" occupy 5,69 % and have value of SC at degree 2. Finally, the last class is represented by "Forests and semi-natural areas", which occupy 92,81 % and have degree 2 as well. The mentioned above values represent background materials for the diversification of the study area on zones with special regime of nature and landscape conservation within each zone accordingly. This is done using information on area, size, density and shapes of the landscapes. Patches, separate parts of the landscapes, were classified using code classification, which allowed to divide landscapes into three ground categories: 1) Artificial surfaces 2) Agricultural areas 3). Forests and seminatural areas. These categories were further sub-divided into 19 sub-clusters, which were defined according to the reference scale and methodological concept of habitat classification. During the interpretation, the levels of ecological significance (SA) were assigned to every habitat. This process is based on the analysis and assessment of ecological processes in the landscape. The next step modifies the assigned degrees by the percentage proportion (P%) of habitat´s metrics (NP, PD, MPS, PSSD and MSI) to the total number of the metric´s value. Percentage proportion modified starting value of the ecological significance (SA). The result value of the modification factor is partial ecological significance (SB). The final ecological significance for the habitats (value SC) is presented as match average of values SB. Outputs values of MPS (Table 2) focus on fact that Artificial surfaces have very small mean size (2,21 ha) within mutual relationship with NP and CA / TA occupy total landscape in partial form. On the other side, the category of Forest and semi-natural areas occupies wide range of the landscape and is diversified into big sum of NP and MPS. The most significant patch value is located in habitat of Tilio-Acerion forest of slopes, screes and ravines (9180*), where MPS is 13,21 ha and CA is 92,49 ha. Comparable patch is Pannonic woods with Quercus petraea & Carpinus betululus (91G0*) but CA represent almost 3 time more value. Each one patch of habitat 9180* indices big size, and it looks like compact biotope, which is not common in Slovakian environment. This habitat is endangered due to its small scale and fragmented appearance. Another remarkable habitat is Pannonic woods & Quercus. petraea & Carpinus betululus (91G0*). Its values of MPS, CA and NP indicate small size for some patches within the habitat. Patch size standard deviation (PSSD) is focused on the significance of the size difference among the patches within the landscape (Table 2). The value of PSSD that is closer to zero means the same size of all patches which indicates uniform structure of patches, created by human impact or human planning of landscape. The biggest deviation sizes have the following habitats: Asperulo-Fagetum beech forests (9130), Pannonic woods with Quercus. petraea & Carpinus betululus (91G0*) and Tilio-Acerion forest of slopes, screes and ravines (9180*). According to the above interpretation of habitat 9180*, we can conclude that natural processes are dominating within these habitat patches. This value is needed to be interpreted with other metrics. Visual example is habitat 91G0* with value combination of MPS, CA, NP and PSSD, which illustrates small size of patches and, at the same time, different scale size within them. It should be interpreted as human impact based on forestry which is common in Slovakia. This type of habitat is threatened by the mismanagement, dimensions of intensive using and expansions of acacia. For these reasons, they are highly endangered habitats. No type of human impact in form of tourism is detected within these habitats. The Mean size index (MSI) indicates shape of patches (Table 2). The Value index increases with irregularity of the patch shape. Patches with low values have circular shape and imply small range of human impact. This metrics should be interpreted with the Number of patches or area. According to NP and CA/TA, the most significant value range have artificial surfaces. Very high value has agricultural area in relation to size of patches. It indicates human impact within this area, on one side by agricultural and historical settlement genesis and on the other side, by tourism. 4.1 Landscape elements of the study area Landscape of the study area is diversified into three base categories: 1. Artificial surfaces, where abstracted human impact; 2. Agricultural area, without any part of arable land; 3. Forests and semi-natural areas. Mentioned categories are divided into 19 sub-categories (Table 1). The number of categories is defined in accordance with used referenced scale and with the methodological concept of habitat classification. The most representative landscape element within the study area is Asperulo- Fagetum beech forests (9130), as shown in Table 1. It occupies 52,64 % of the total area (TA). The study area is represented (91,81 % of TA) mostly by Forests and semi-natural areas. The number of patches (NP) in the study area reaches 105. The Patch density (PD) shows distribution and concentration of patches in the landscape, with values 11,22 patches per 1000 ha. It is very small value, which indicates large and compact patches. The study area is not fragmented too much, though, notably, as shown in Table 2: A) Number of categories and subcategories, B) Number of patches, C) Patch density and D) Class area (CA) and TA. The Mean patch size (MPS) was determined from the Number of patches and their area. Riga Technical University Institute of Energy Systems and Environment. Faculty of Power and Electrical Engineering Kronvalda bulv.1 Riga, Latvia. 54th International Scientific Conference “Environmental and Climate Technologies”, October 14-16, 2013, Riga. Latvia.