Downloaded 156 times


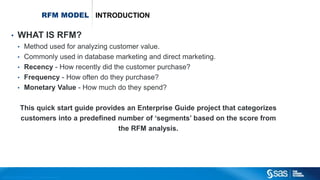
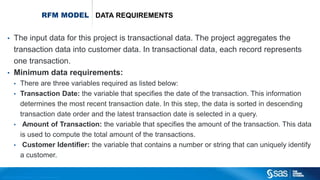
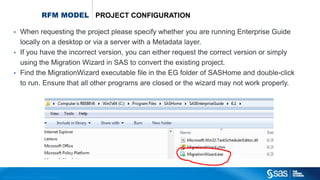
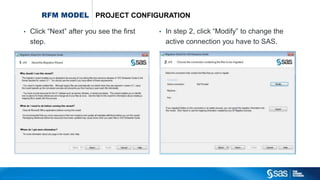
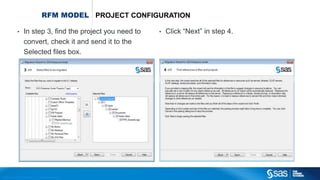
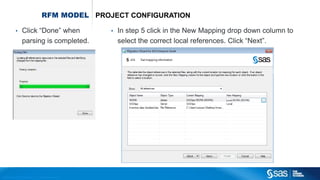
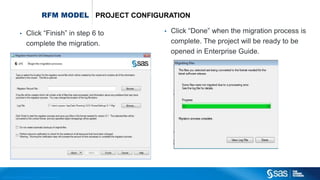
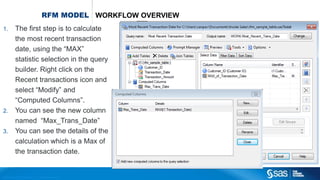
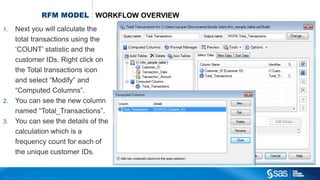
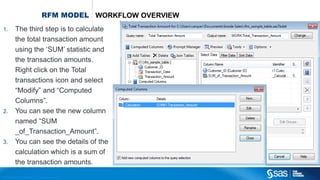
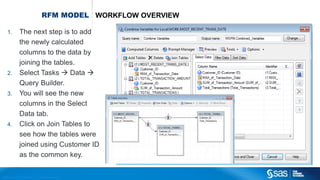
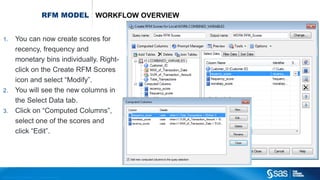
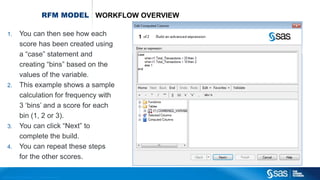
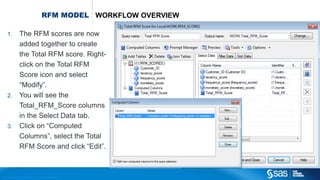
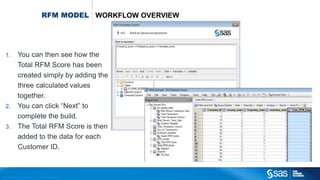
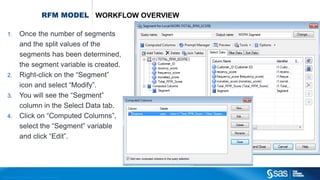
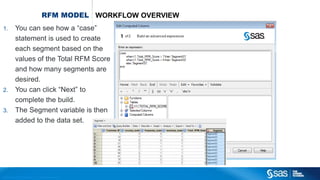
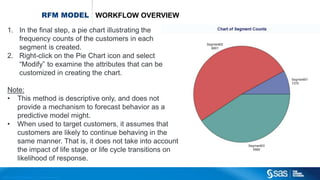


The document is a quick start guide for the RFM (Recency, Frequency, Monetary) model used to analyze customer value in marketing. It outlines the project configuration, data requirements, and the workflow to categorize customers into segments based on their RFM scores. Additionally, it details the calculations for RFM scores and the creation of customer segments, ultimately providing insights for targeting marketing efforts.


![Cdac -Project Presentation [Autosaved].pptx](https://cdn.slidesharecdn.com/ss_thumbnails/cdac-projectpresentationautosaved-231029063336-13e0f780-thumbnail.jpg?width=640&height=640&fit=bounds)