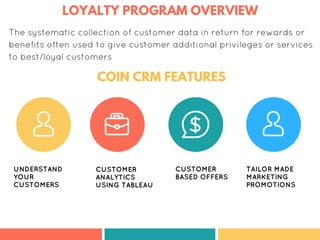
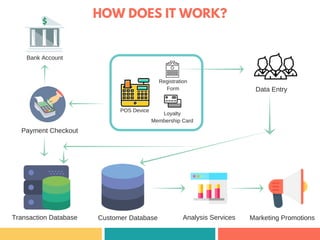
COIN
LOYALTY CRM
W W W . S Y S G S O F T . C O M
OUR STORY
SysG soft is a project management &
application development company
headquartered in Ireland with offices
in India as well.
SysG Soft was founded in 2008 and is
emerging as a global leader in project
management & technology consulting.
We provide end-to-end services and
solutions in application development
and big data. Equipped with a team of
consultants, UI/UX designers,
software architects, software
developers and testers, we offer a
wide range of services across
different verticals.
LOYALTY PROGRAM OVERVIEW
COIN CRM FEATURES
UNDERSTAND
YOUR
CUSTOMERS
TAILOR MADE
MARKETING
PROMOTIONS
CUSTOMER
BASED OFFERS
CUSTOMER
ANALYTICS
USING TABLEAU
The systematic collection of customer data in return for rewards or
benefits often used to give customer additional privileges or services
to best/loyal customers
COIN LOYALTY CRM OVERVIEW
We redefined the customer management pattern by including most effective
technics and excluding irrelevant data. A New path for a business that makes
sense and sensibility. Highly predictive and designed to be productive.
Loyalty Manager is an approach towards Customer Relationship
Management with most advanced features. Loyalty manager is built to
observe & deliver accurate business information to the users.
"Loyalty Manager is an
approach towards
Customer Relationship
Management"
HOW DOES IT WORK?
Registration
Form
Loyalty
Membership Card
POS Device
Payment Checkout
Transaction Database Customer Database Analysis Services Marketing Promotions
Bank Account
Data Entry
CUSTOMER ANALYTICS
Our system will analyze the structured and unstructured customer and
sales data to provide insights which will help you discover new
customer relationships, spot emerging trends, and patterns, and
maximize ROI.
We will analyze the data to understand the demographic, behavior and
intent of shifting customers and use it to get more conversion, reach,
social engagement, & ROI.
Based on the generated insights, we will run promotional marketing
campaigns through social media channels, content marketing, and
other digital marketing activities.
With expertise in R programming & Tableau development, we have a
developed some insights for some of our clients and is mentioned
below:
In this bubble chart, each bubble indicates a
branch under the supermarket. Colour of the
bubble indicates the municipality of each branch.
The size of the bubble indicates the net
profit/purchase amount of each branch. By clicking
on Profit/Sales Button we can view either profit
status or purchase amount status of body text.
Here we categorize the clients in accordance with:
1.Recency
2.Frequency
3.Monetary
of each client.
A client who made a purchase recently is having a good recency score where the maximum score is 5. If the
recency of a client goes down it lowered from 5 to 1.
In the same manner, we categorize the clients in accordance with the number of transactions made. If the
number of transactions is higher then the frequency score is 5 and it becomes 1, if the frequency is low.
Later we calculate the net amount of purchase by each client and divide it with the frequency of that client.
Thus we got the monetary value of a client. If the monetary is high, the value will be 5 and will becomes 1 if it
lowered.
Thus by combining R, F and M scores we made a total score for each client in the order R, F and M
respectively.
For example if R score = 4, F score = 5, M score = 2, then Total score = 452.
Thus by analyzing the total scores of each client, we can again categorize the clients into
1.Luxury active clients
2.Active Clients
3.Sleeping Clients
4.Luxury Sleeping clients
Later we work on the above categories and it helps in the growth of business and profit.
In the above graph, we have taken 500 customers and made RFM Analysis on them. We consider the
complete purchases of each customer and analyze his latest purchase date, the number of times he made
purchases and total amount he purchased. Later using RMF analysis we calculate the total score for each
customer
Customers having the score 555,554 comes under luxury active clients
155,255,355 comes under luxury sleeping clients
Clients having R score 4,5 are active whereas clients having R score 1,2,3 are inactive clients
RFM Analysis
Here we consider the products purchased by each customer.
Using market basket analysis we calculate the product affinity i.e., after analysis
some product has an affinity to another product. Therefore we can suggest a
customer for that product if he/she purchase the another one. In simple terms
CROSS SELLING
Here we analyze the impact of gender based on RFM analysis.
The ratio of male: female in RFM categories is shown in the table.
Here we analyze the type of customers who made the purchase from the
supermarket.
In the above pie diagram, the colour indicates the job type and the size indicate
the number of customers having that particular job.
job analysis have a great impact in marketing the product so that customers
under a particular job category have an affinity to certain products which is
required for their job purposes.
Product sales growth explain us about the growth of a particular product
compared to other products. here we can analyze month wise growth of 3
selected products. We can also analyze the growth of products in different
years.
Total Customer Analytics Using Tableau
BUSINESS ADVANTAGES
TARGET
RIGHT CUSTOMERS
E-COMMERCE
PRESENCE
CUSTOMER
ANALYTICS
INDUSTRY
FRIENDLY
BRAND
EXTENSION
CUSTOMER
RETENTION
CUSTOMER ADVANTAGES
POINTS REDEEM
LIVE DISCOUNT
NOTIFICATION
CASH REBATES
SPECIAL OFFERS SPECIAL
PRIVILAGE
FASTER
CHECKOUT
REDEEM POINTS
1. Bonus Points
2. Discounts for members
3. Rebate Redeem
4. Birthday Privileges
5. Instant Privileges
MARKETING STRATEGIES
1. Commercials & Advertisements.
2. Content Marketing
- Flyers
-Posters
-Email campaigns
-Infographics
-Blogs
3. Social Media Marketing.
-Social Media ads & page management.
4. Search Engine Marketing.
-Adwords, paid social media, etc
5. Video Marketing.
6. Omnichannel Marketing.
7. Community Marketing
CRITERIA SETTINGS
Add criteria for promotion to target consumers based on Age, Gender,
demographics and more...
CRITERIA DRAG & DROP
Set criteria using drag & drop feature.
MARKETING STRATEGIES
EXAMPLES_SOCIAL MEDIA MARKETING
MARKETING STRATEGIES
EXAMPLES_FLYERS & POSTERS
MARKETING STRATEGIES
EXAMPLES_VIDEO MARKETING
MARKETING STRATEGIES
EXAMPLES_INFOGRAPHICS

Coin Loyalty CRM

  • 1.
    COIN LOYALTY CRM W WW . S Y S G S O F T . C O M
  • 2.
    OUR STORY SysG softis a project management & application development company headquartered in Ireland with offices in India as well. SysG Soft was founded in 2008 and is emerging as a global leader in project management & technology consulting. We provide end-to-end services and solutions in application development and big data. Equipped with a team of consultants, UI/UX designers, software architects, software developers and testers, we offer a wide range of services across different verticals.
  • 3.
    LOYALTY PROGRAM OVERVIEW COINCRM FEATURES UNDERSTAND YOUR CUSTOMERS TAILOR MADE MARKETING PROMOTIONS CUSTOMER BASED OFFERS CUSTOMER ANALYTICS USING TABLEAU The systematic collection of customer data in return for rewards or benefits often used to give customer additional privileges or services to best/loyal customers
  • 4.
    COIN LOYALTY CRMOVERVIEW We redefined the customer management pattern by including most effective technics and excluding irrelevant data. A New path for a business that makes sense and sensibility. Highly predictive and designed to be productive. Loyalty Manager is an approach towards Customer Relationship Management with most advanced features. Loyalty manager is built to observe & deliver accurate business information to the users. "Loyalty Manager is an approach towards Customer Relationship Management"
  • 5.
    HOW DOES ITWORK? Registration Form Loyalty Membership Card POS Device Payment Checkout Transaction Database Customer Database Analysis Services Marketing Promotions Bank Account Data Entry
  • 6.
    CUSTOMER ANALYTICS Our systemwill analyze the structured and unstructured customer and sales data to provide insights which will help you discover new customer relationships, spot emerging trends, and patterns, and maximize ROI. We will analyze the data to understand the demographic, behavior and intent of shifting customers and use it to get more conversion, reach, social engagement, & ROI. Based on the generated insights, we will run promotional marketing campaigns through social media channels, content marketing, and other digital marketing activities. With expertise in R programming & Tableau development, we have a developed some insights for some of our clients and is mentioned below:
  • 8.
    In this bubblechart, each bubble indicates a branch under the supermarket. Colour of the bubble indicates the municipality of each branch. The size of the bubble indicates the net profit/purchase amount of each branch. By clicking on Profit/Sales Button we can view either profit status or purchase amount status of body text.
  • 11.
    Here we categorizethe clients in accordance with: 1.Recency 2.Frequency 3.Monetary of each client. A client who made a purchase recently is having a good recency score where the maximum score is 5. If the recency of a client goes down it lowered from 5 to 1. In the same manner, we categorize the clients in accordance with the number of transactions made. If the number of transactions is higher then the frequency score is 5 and it becomes 1, if the frequency is low. Later we calculate the net amount of purchase by each client and divide it with the frequency of that client. Thus we got the monetary value of a client. If the monetary is high, the value will be 5 and will becomes 1 if it lowered. Thus by combining R, F and M scores we made a total score for each client in the order R, F and M respectively. For example if R score = 4, F score = 5, M score = 2, then Total score = 452.
  • 12.
    Thus by analyzingthe total scores of each client, we can again categorize the clients into 1.Luxury active clients 2.Active Clients 3.Sleeping Clients 4.Luxury Sleeping clients Later we work on the above categories and it helps in the growth of business and profit. In the above graph, we have taken 500 customers and made RFM Analysis on them. We consider the complete purchases of each customer and analyze his latest purchase date, the number of times he made purchases and total amount he purchased. Later using RMF analysis we calculate the total score for each customer Customers having the score 555,554 comes under luxury active clients 155,255,355 comes under luxury sleeping clients Clients having R score 4,5 are active whereas clients having R score 1,2,3 are inactive clients RFM Analysis
  • 13.
    Here we considerthe products purchased by each customer. Using market basket analysis we calculate the product affinity i.e., after analysis some product has an affinity to another product. Therefore we can suggest a customer for that product if he/she purchase the another one. In simple terms CROSS SELLING
  • 14.
    Here we analyzethe impact of gender based on RFM analysis. The ratio of male: female in RFM categories is shown in the table.
  • 15.
    Here we analyzethe type of customers who made the purchase from the supermarket. In the above pie diagram, the colour indicates the job type and the size indicate the number of customers having that particular job. job analysis have a great impact in marketing the product so that customers under a particular job category have an affinity to certain products which is required for their job purposes.
  • 16.
    Product sales growthexplain us about the growth of a particular product compared to other products. here we can analyze month wise growth of 3 selected products. We can also analyze the growth of products in different years.
  • 17.
  • 18.
  • 19.
    CUSTOMER ADVANTAGES POINTS REDEEM LIVEDISCOUNT NOTIFICATION CASH REBATES SPECIAL OFFERS SPECIAL PRIVILAGE FASTER CHECKOUT
  • 20.
    REDEEM POINTS 1. BonusPoints 2. Discounts for members 3. Rebate Redeem 4. Birthday Privileges 5. Instant Privileges
  • 21.
    MARKETING STRATEGIES 1. Commercials& Advertisements. 2. Content Marketing - Flyers -Posters -Email campaigns -Infographics -Blogs 3. Social Media Marketing. -Social Media ads & page management. 4. Search Engine Marketing. -Adwords, paid social media, etc 5. Video Marketing. 6. Omnichannel Marketing. 7. Community Marketing
  • 22.
    CRITERIA SETTINGS Add criteriafor promotion to target consumers based on Age, Gender, demographics and more...
  • 23.
    CRITERIA DRAG &DROP Set criteria using drag & drop feature.
  • 24.
  • 25.
  • 26.
  • 27.