Download as PDF, PPTX
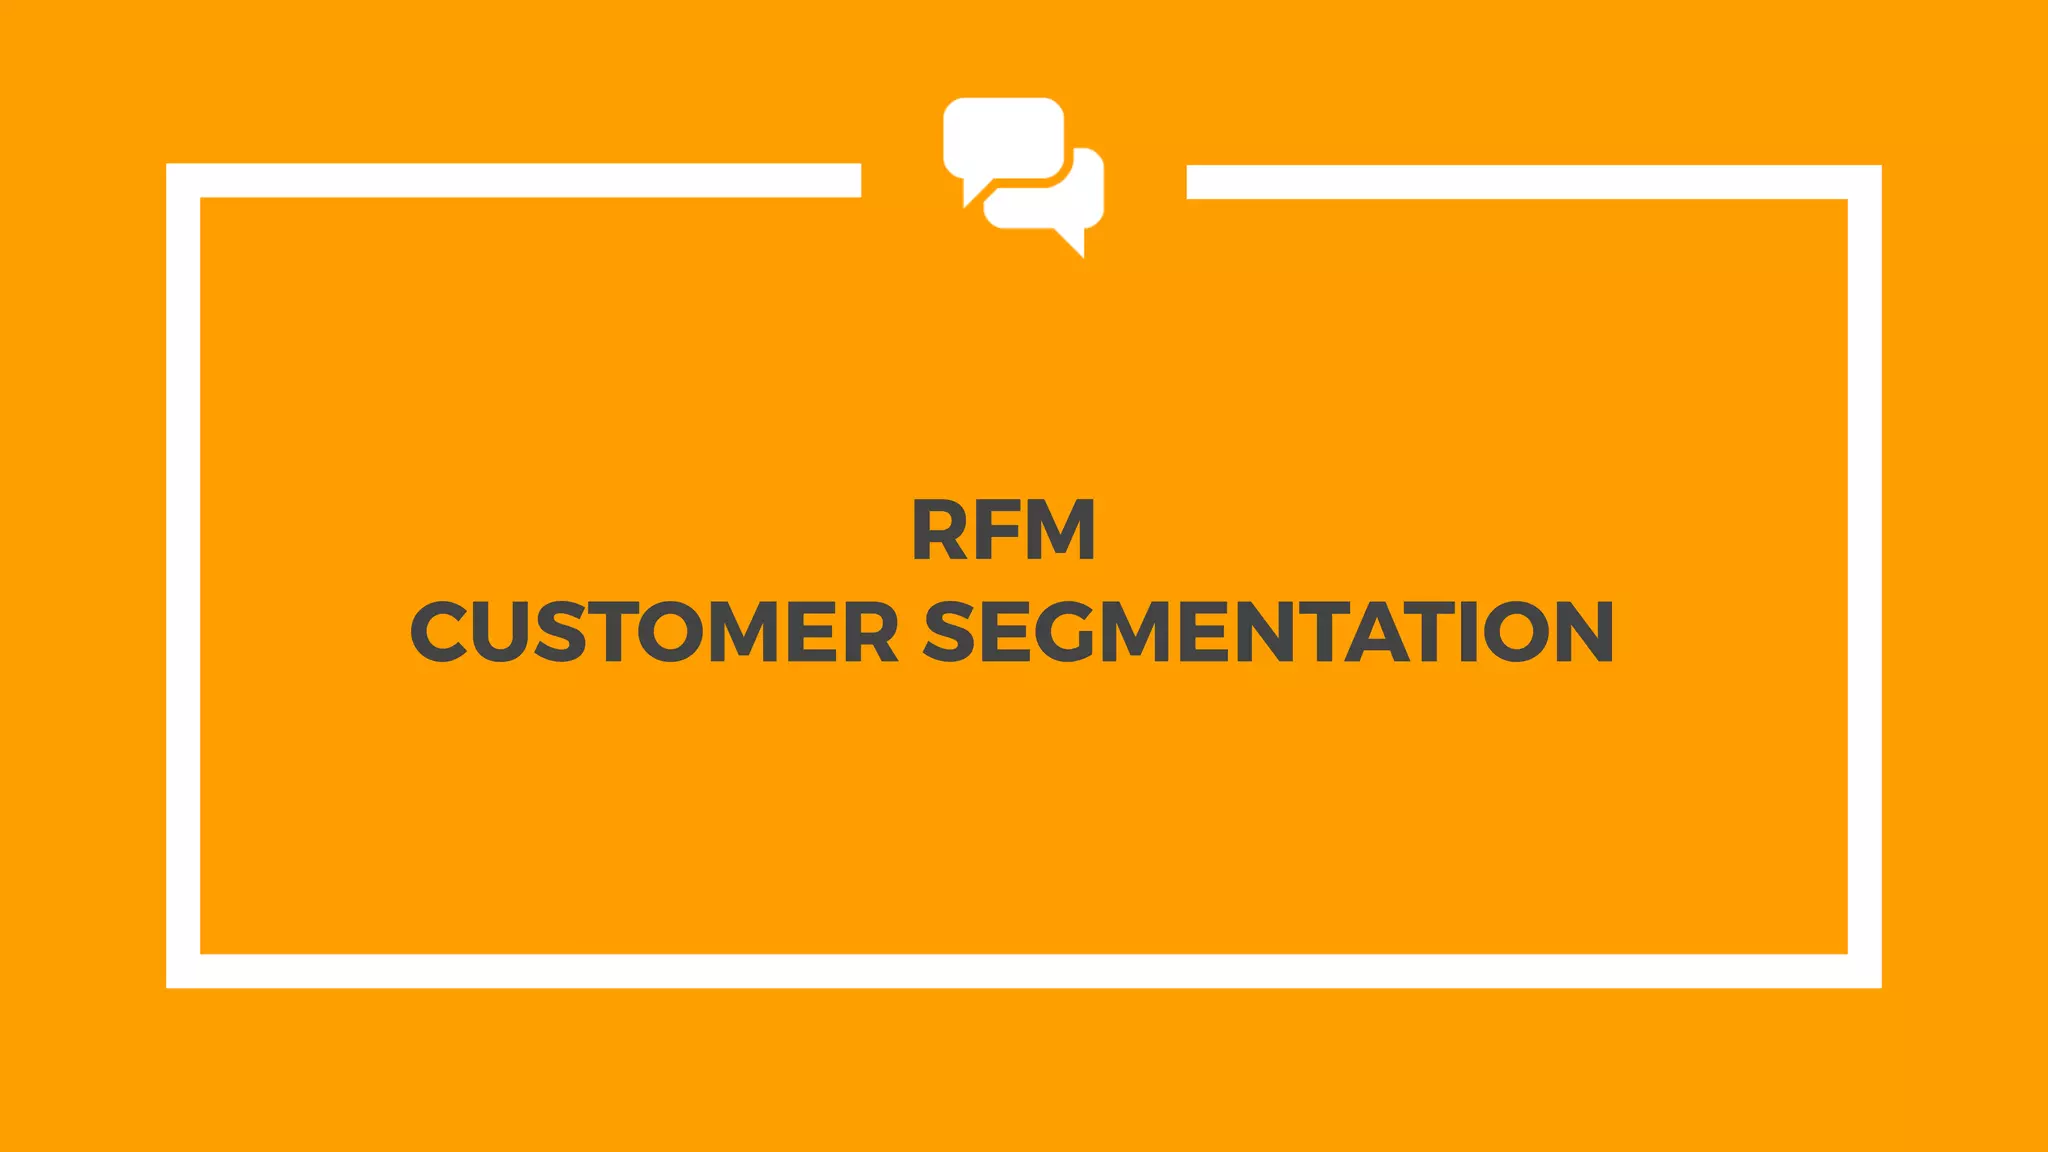

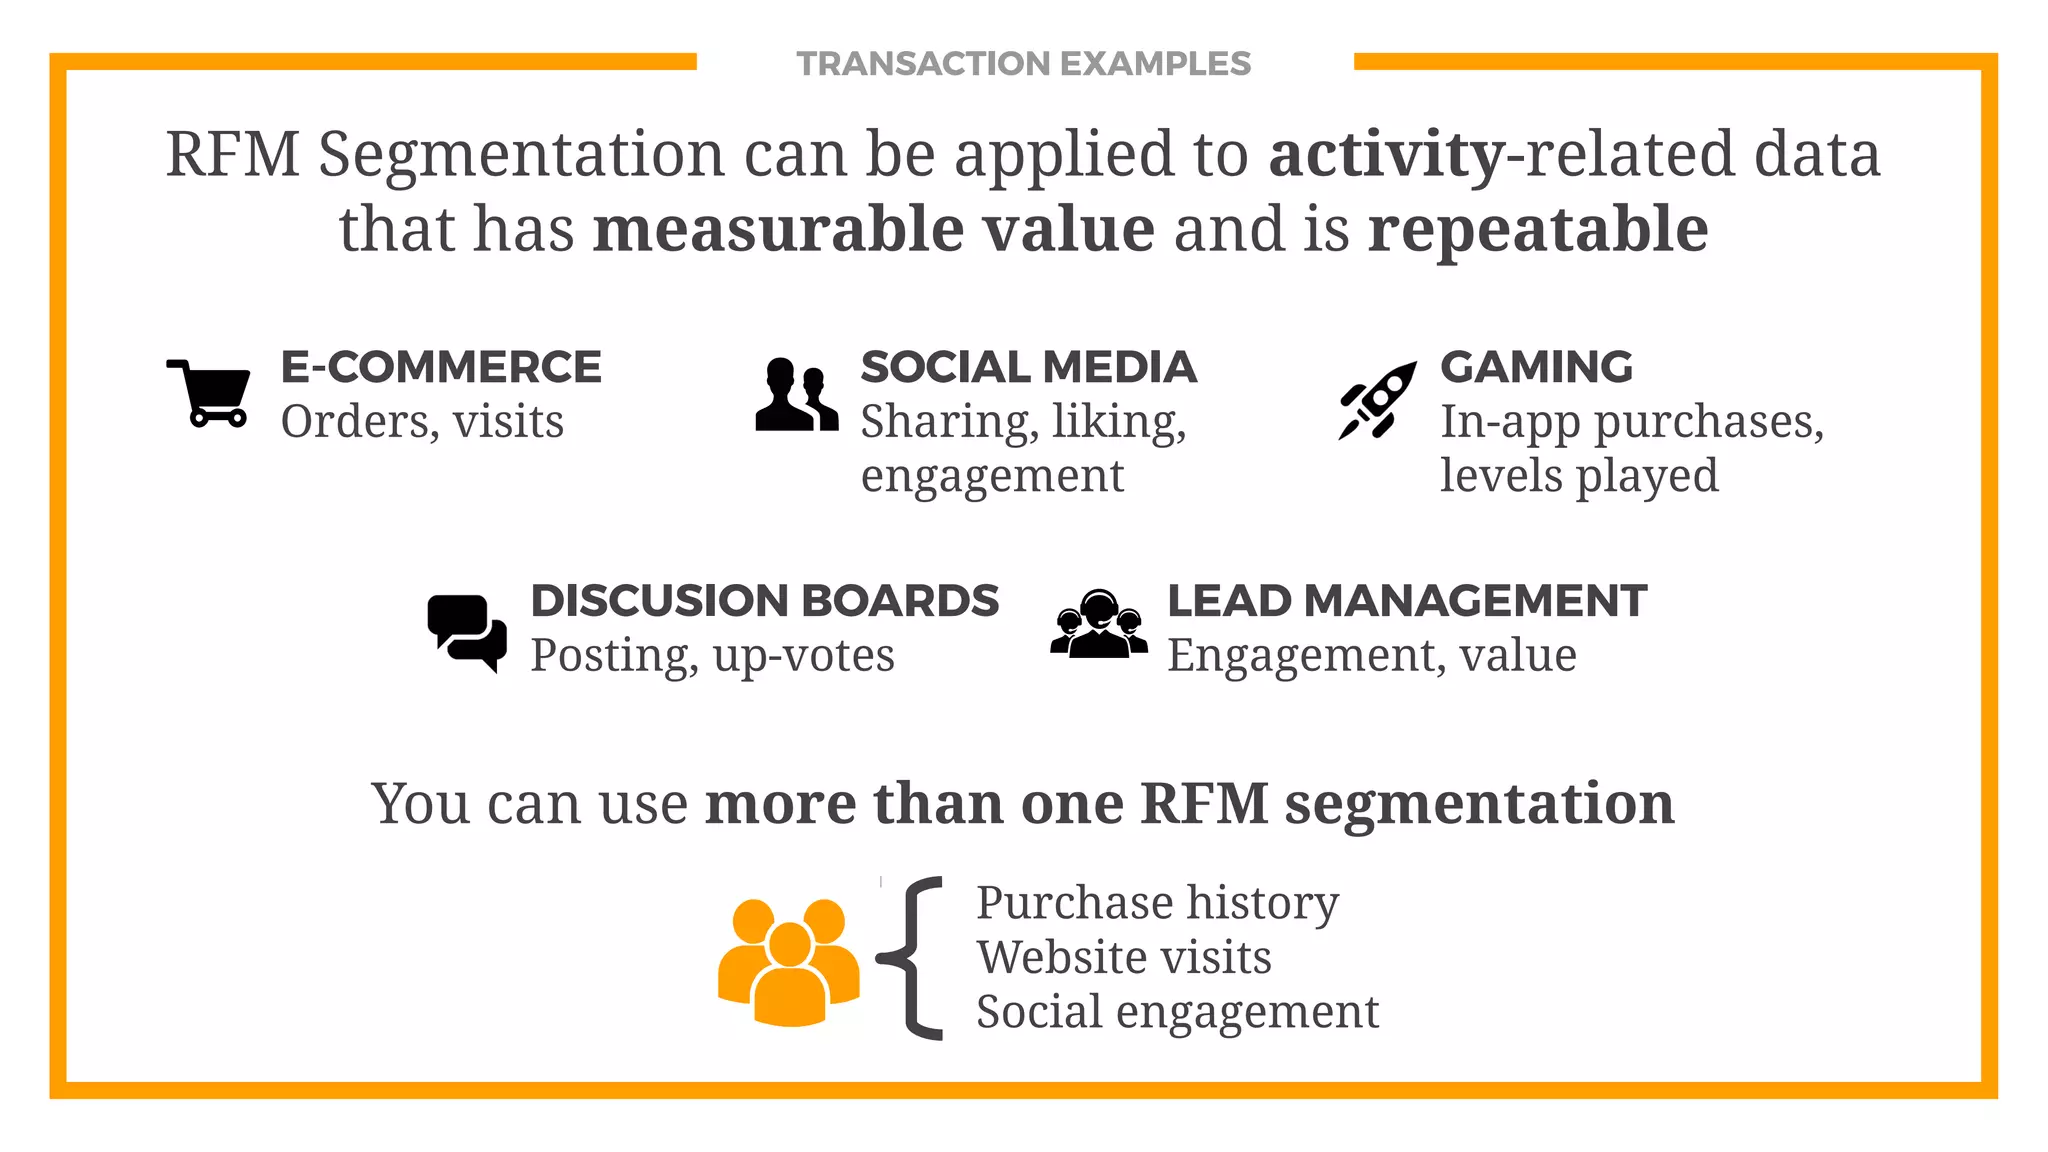
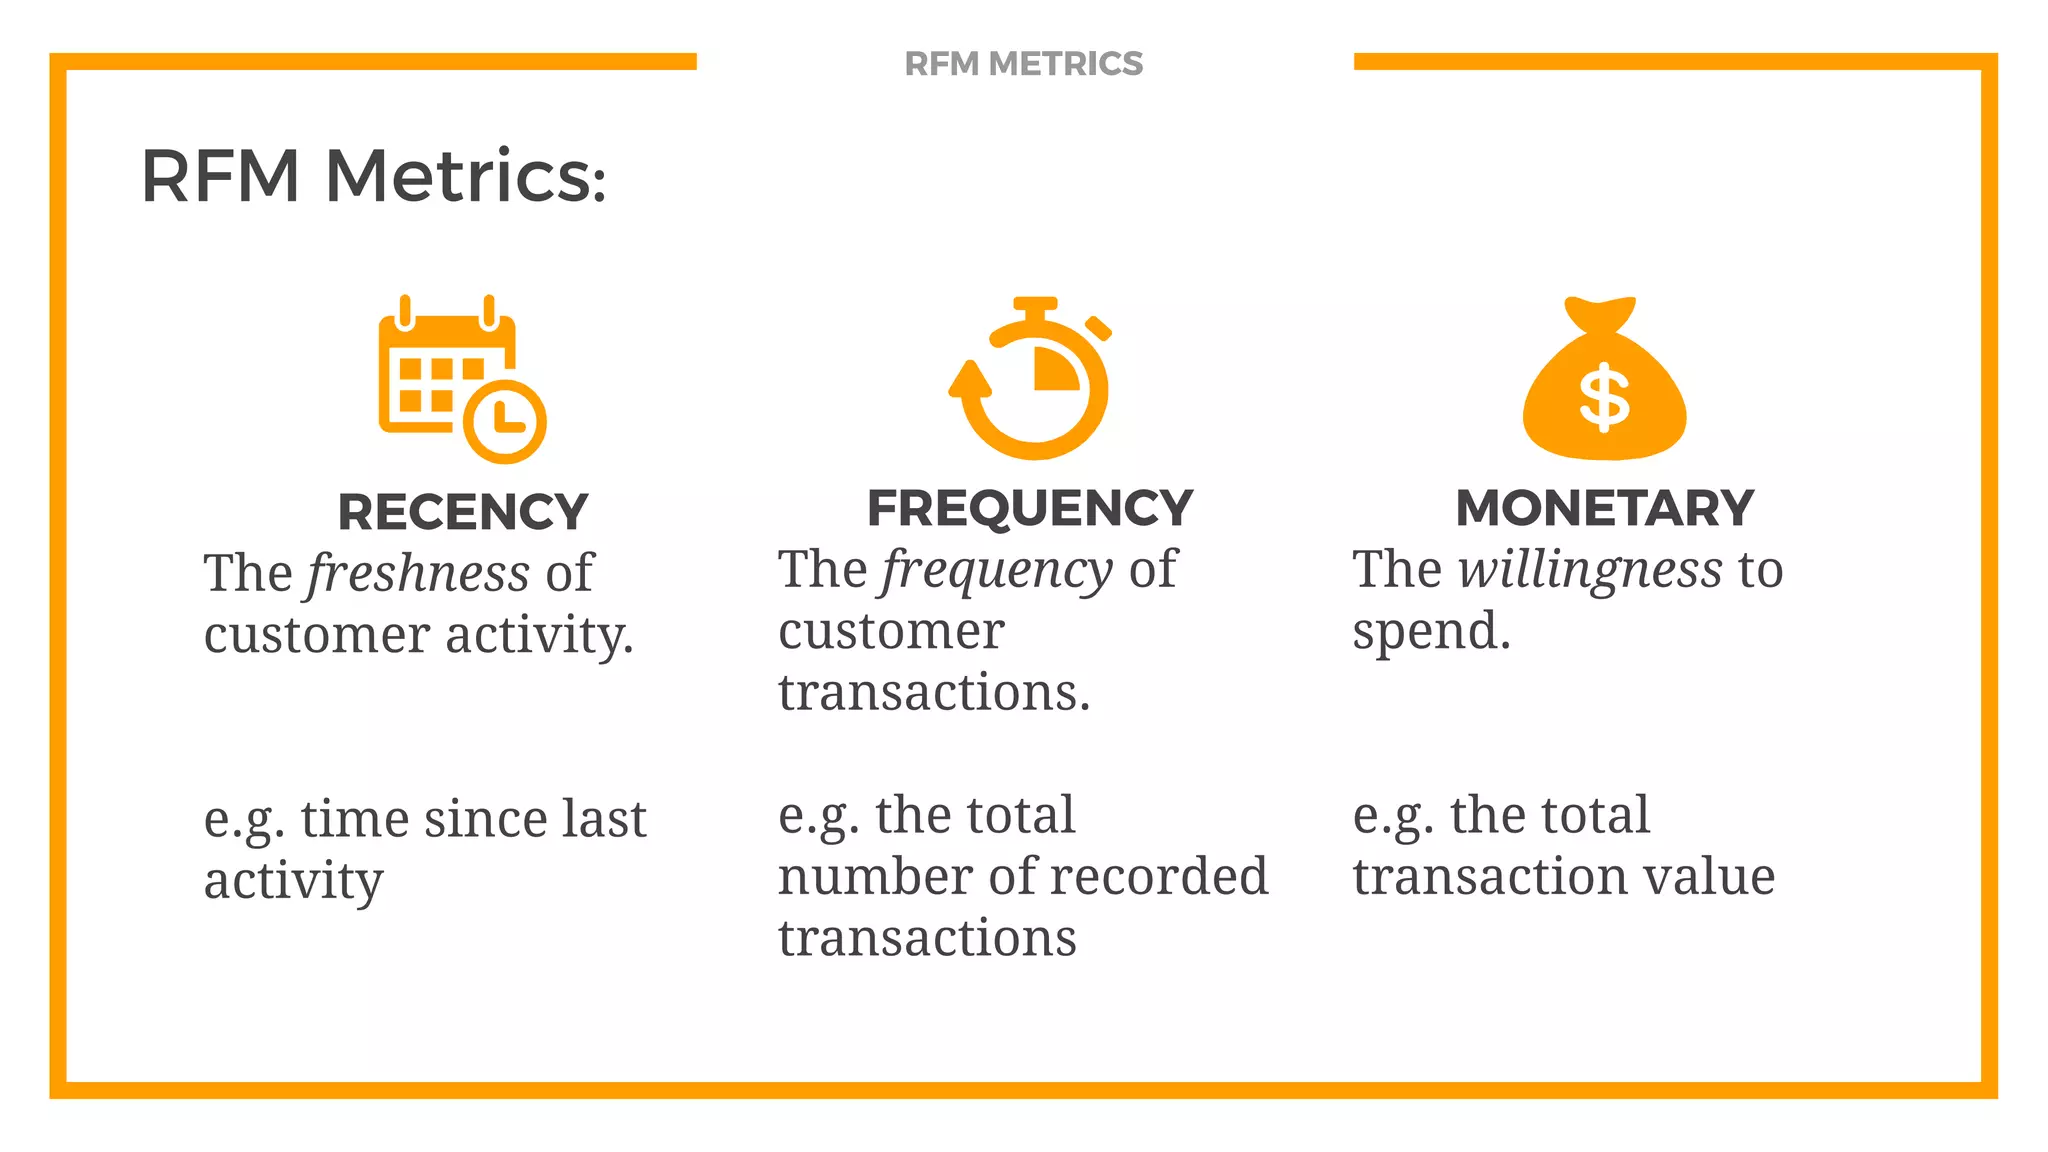
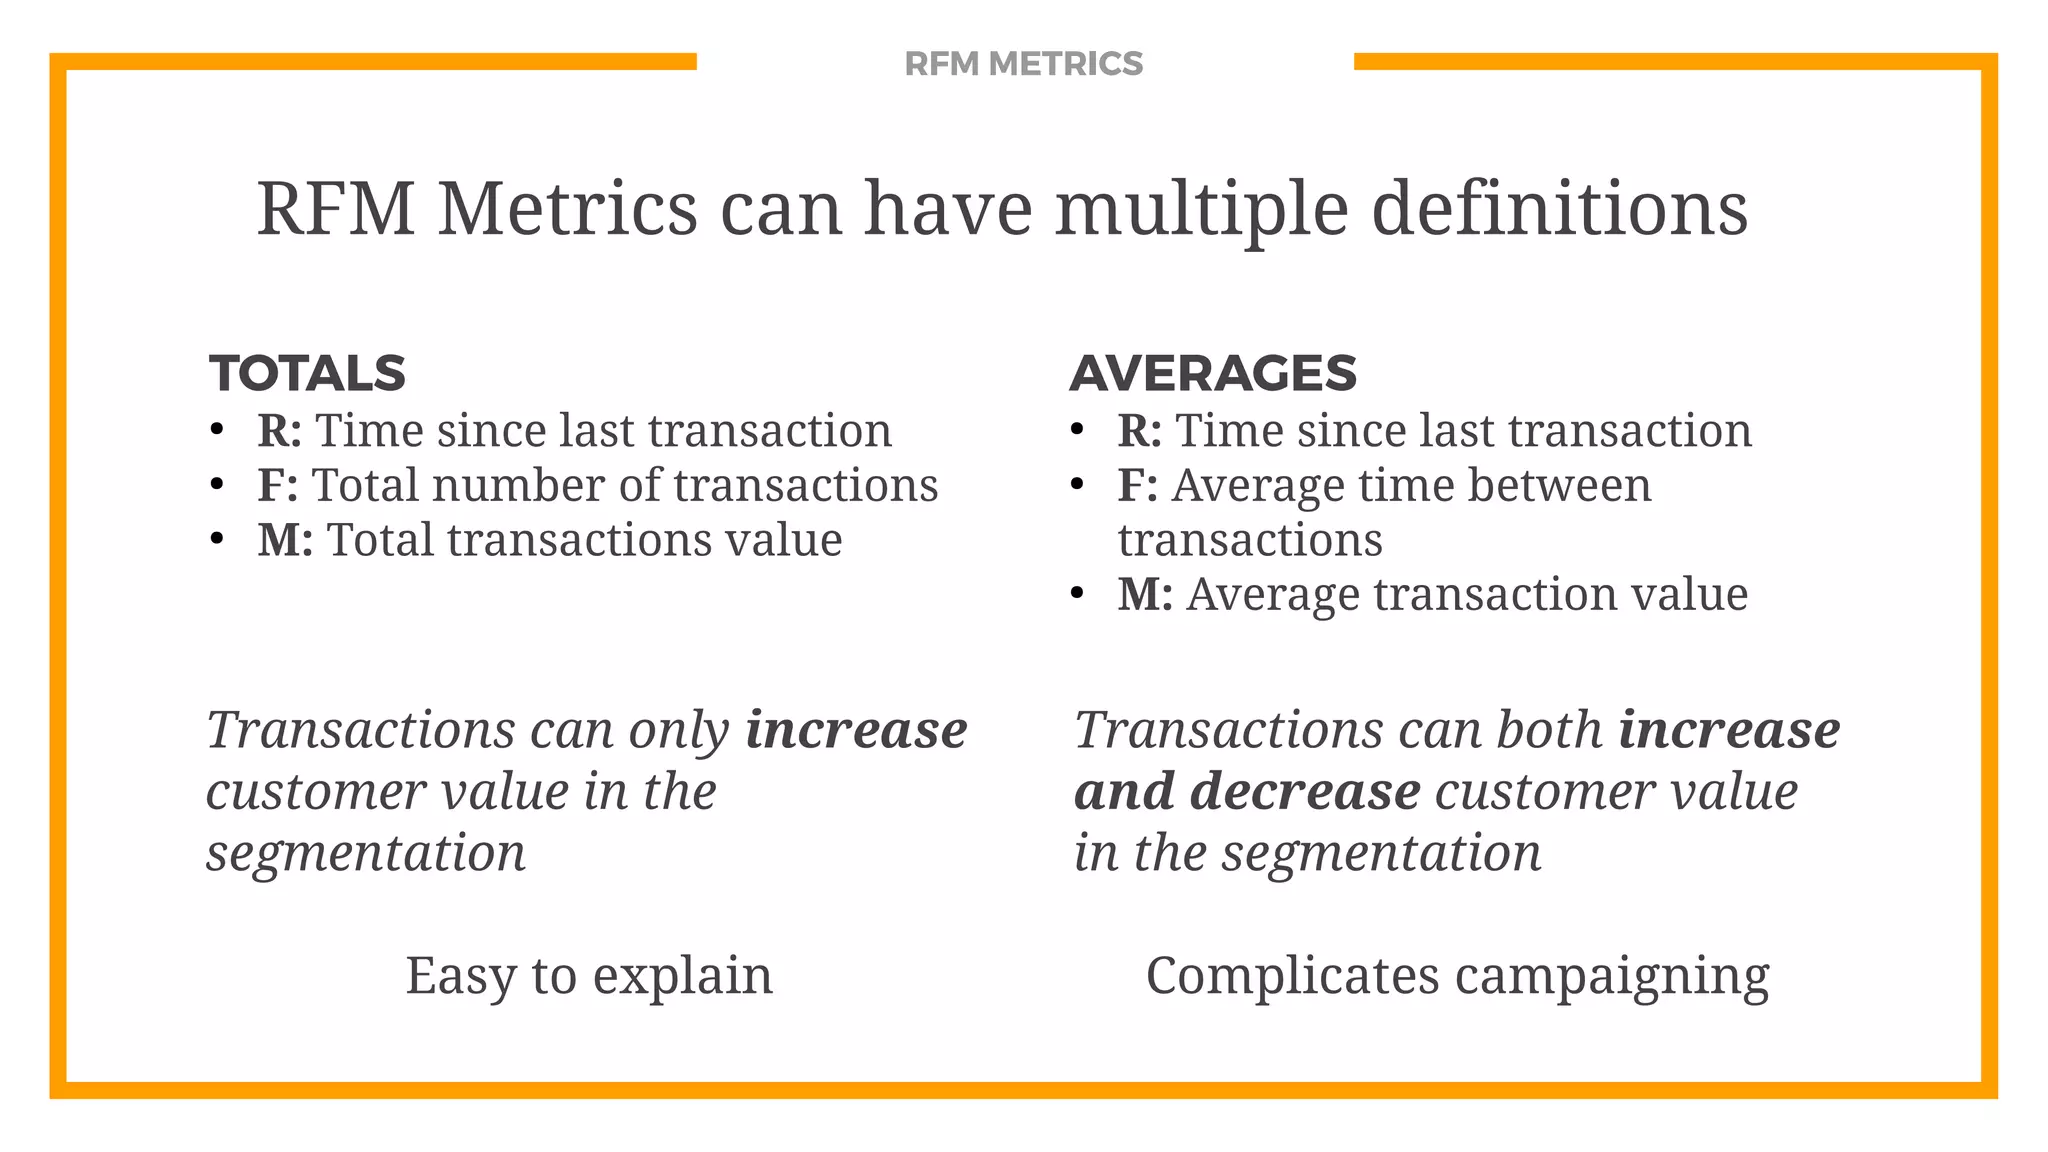
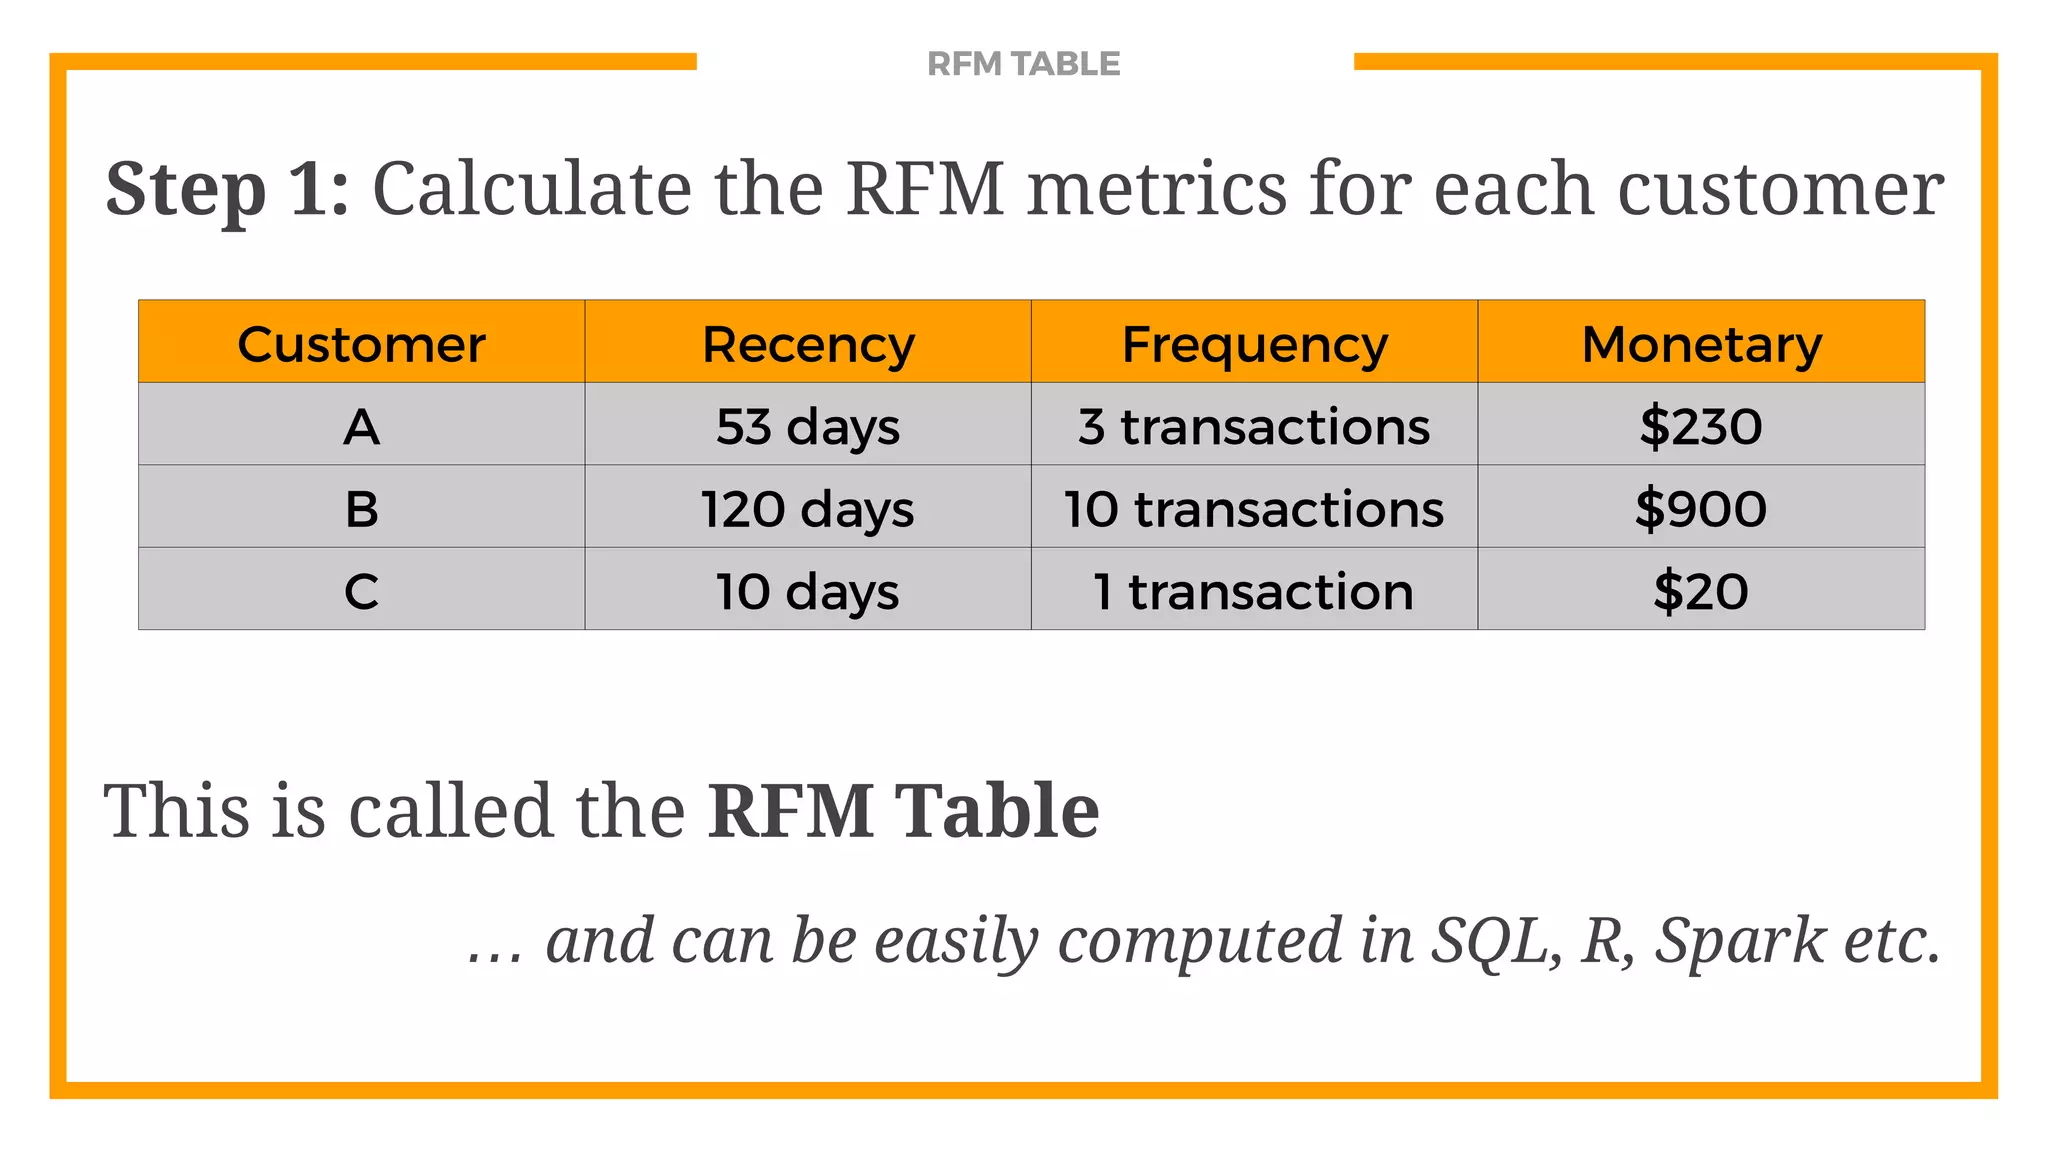
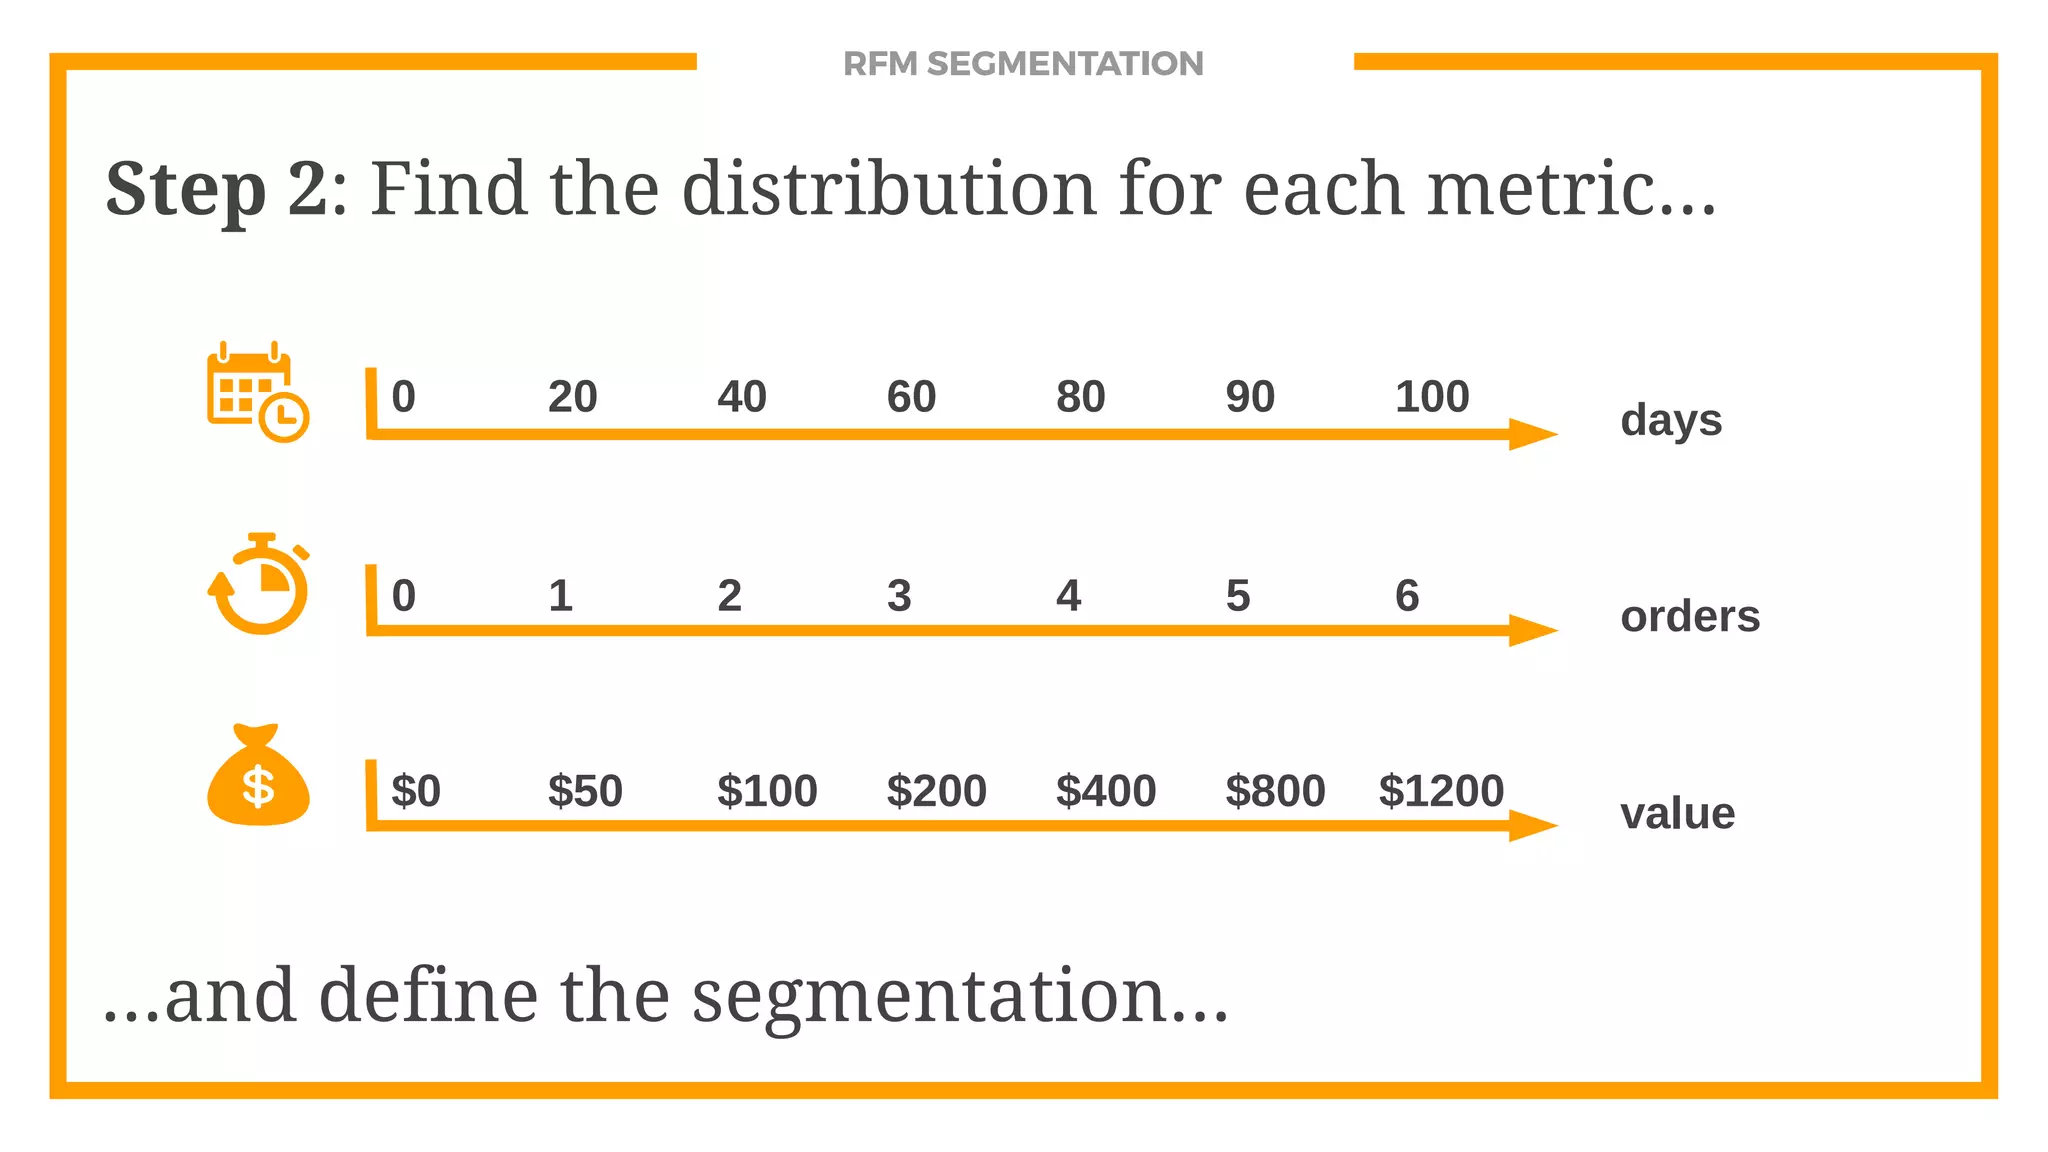
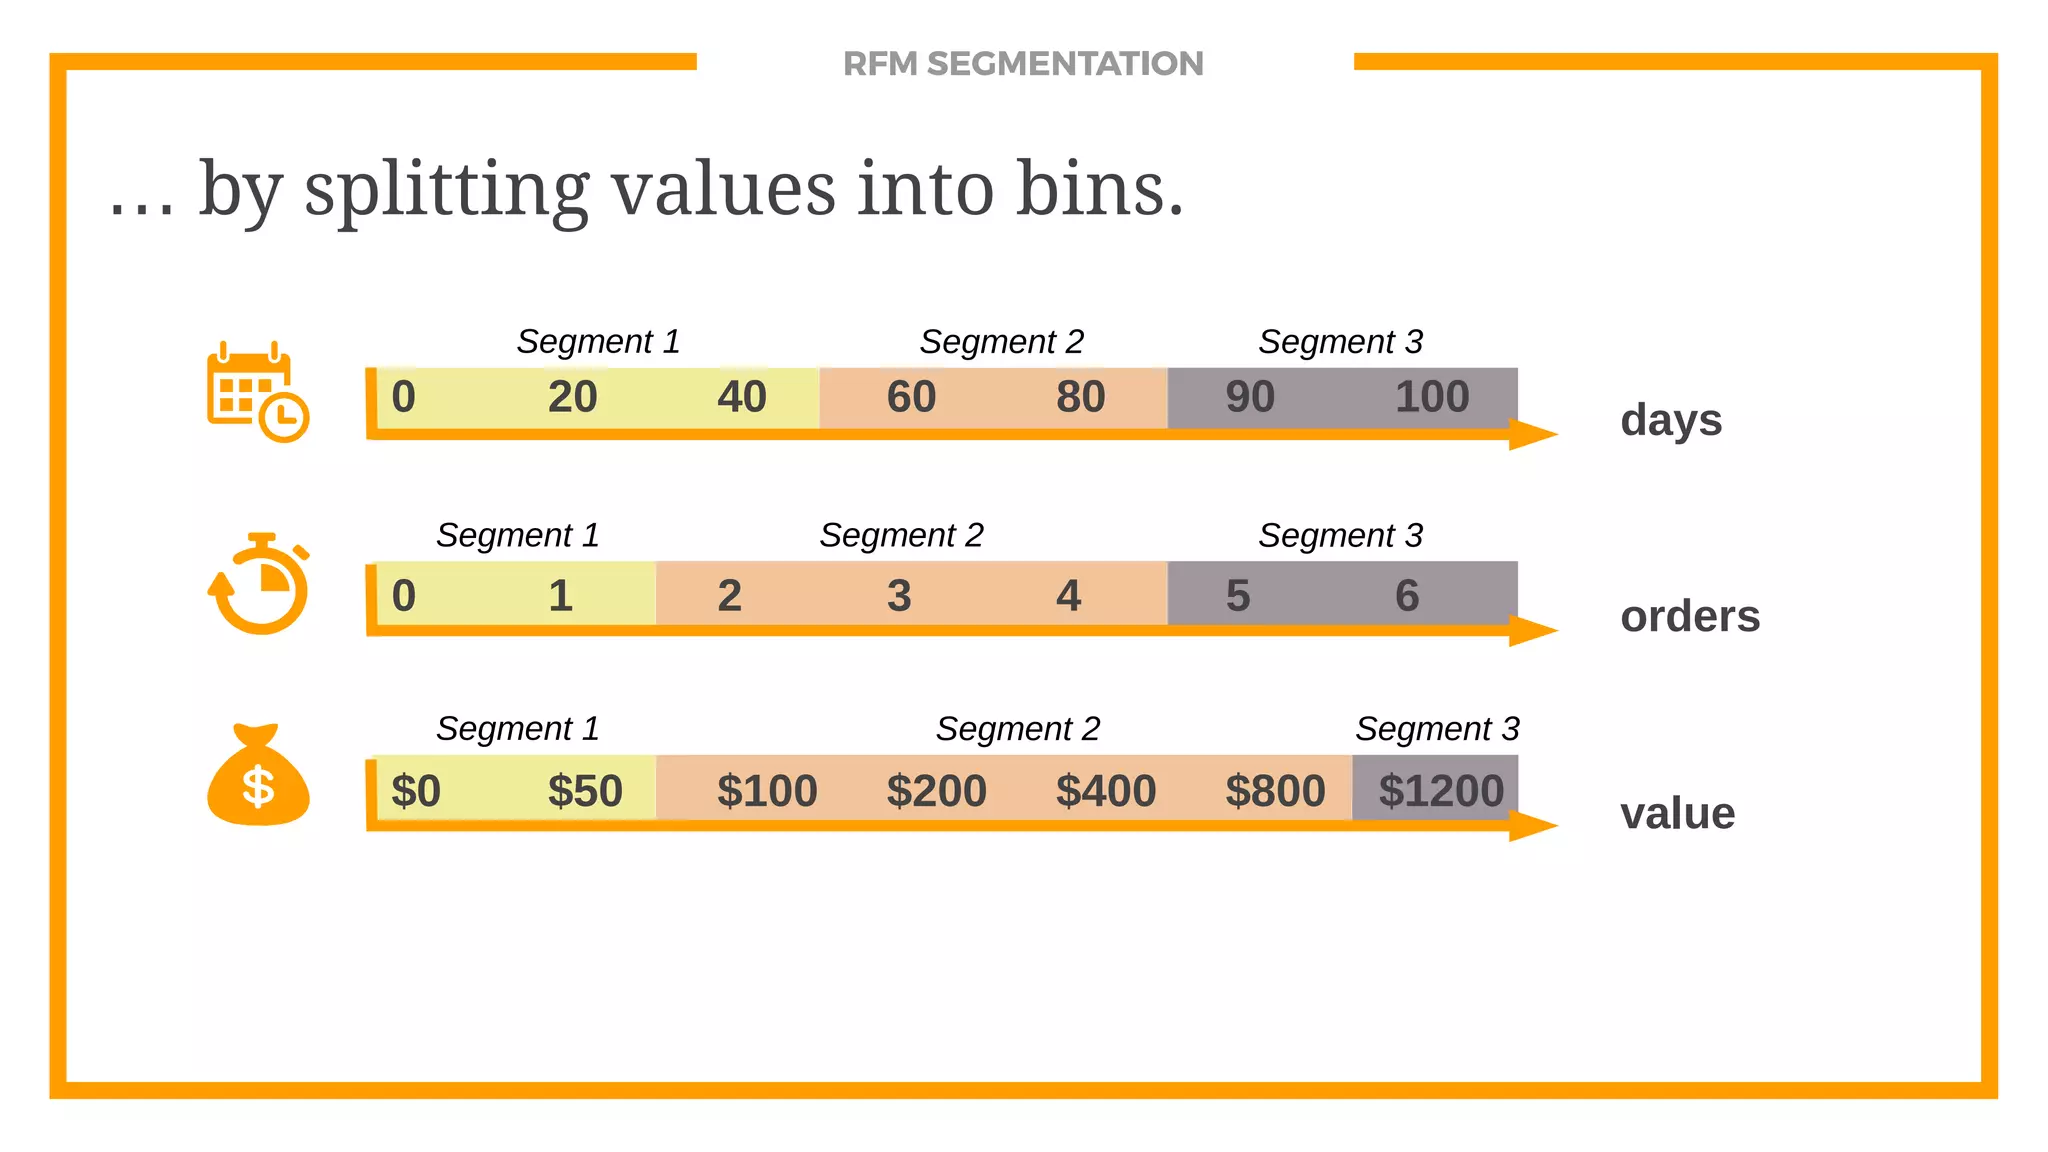
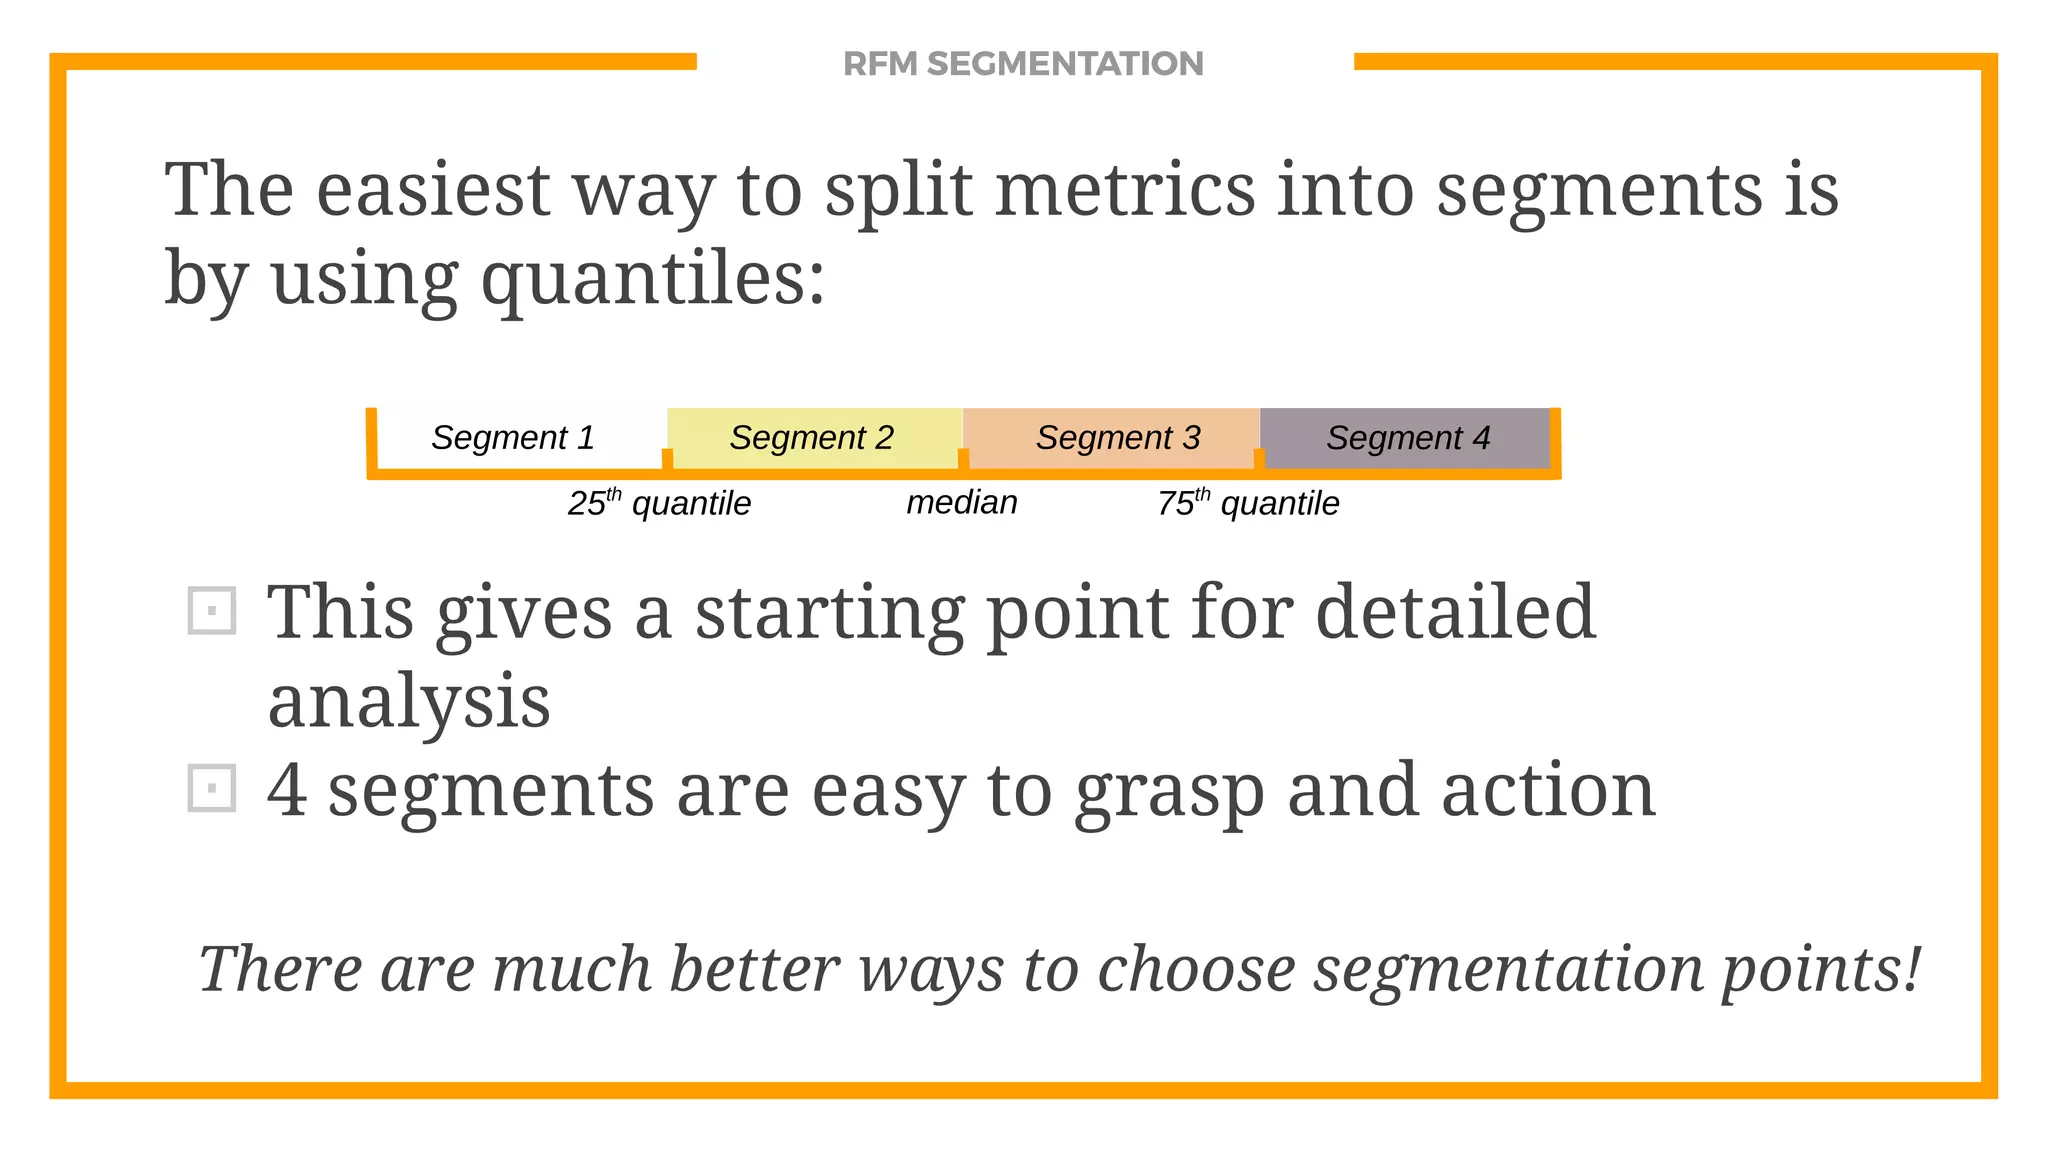
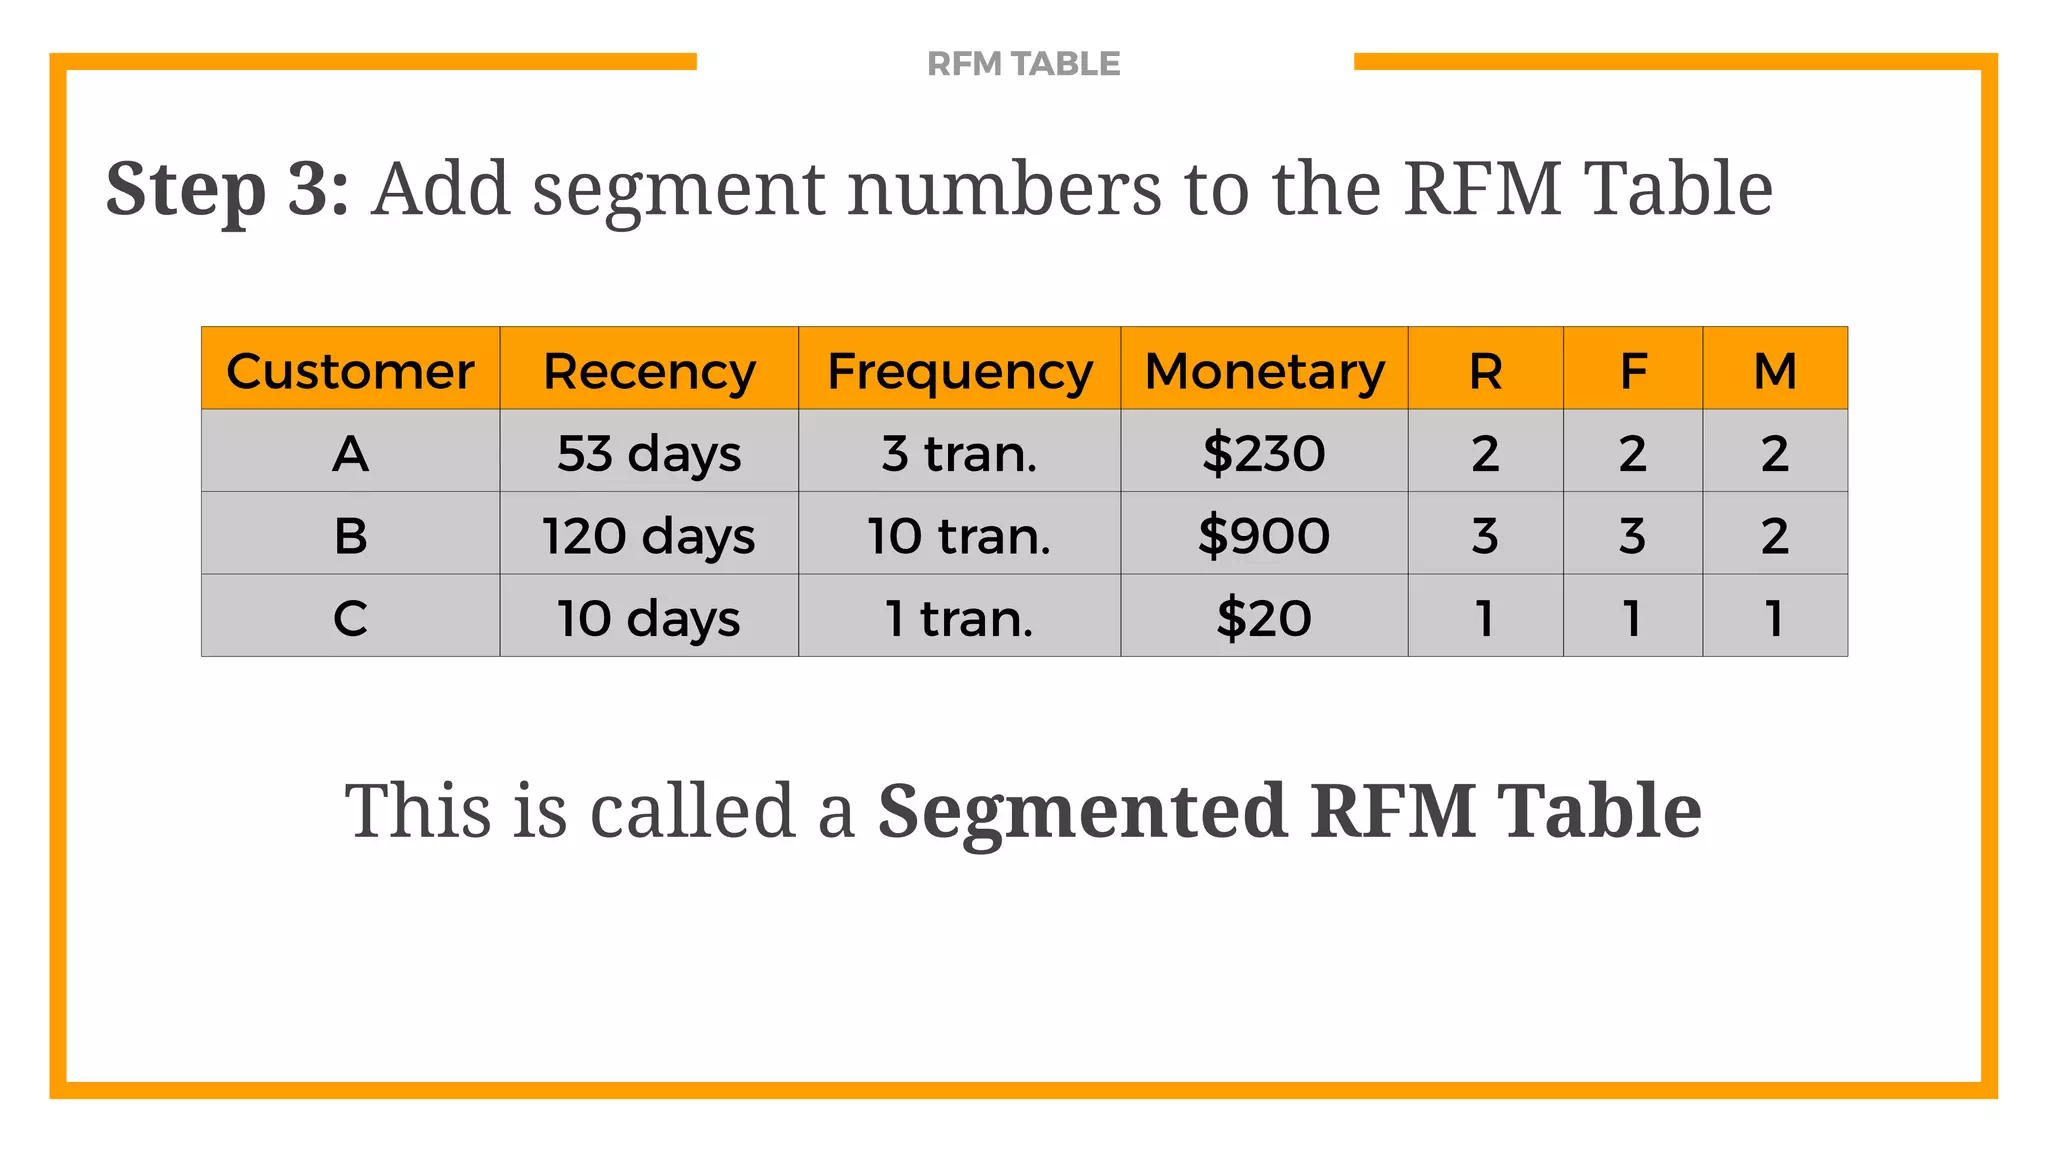
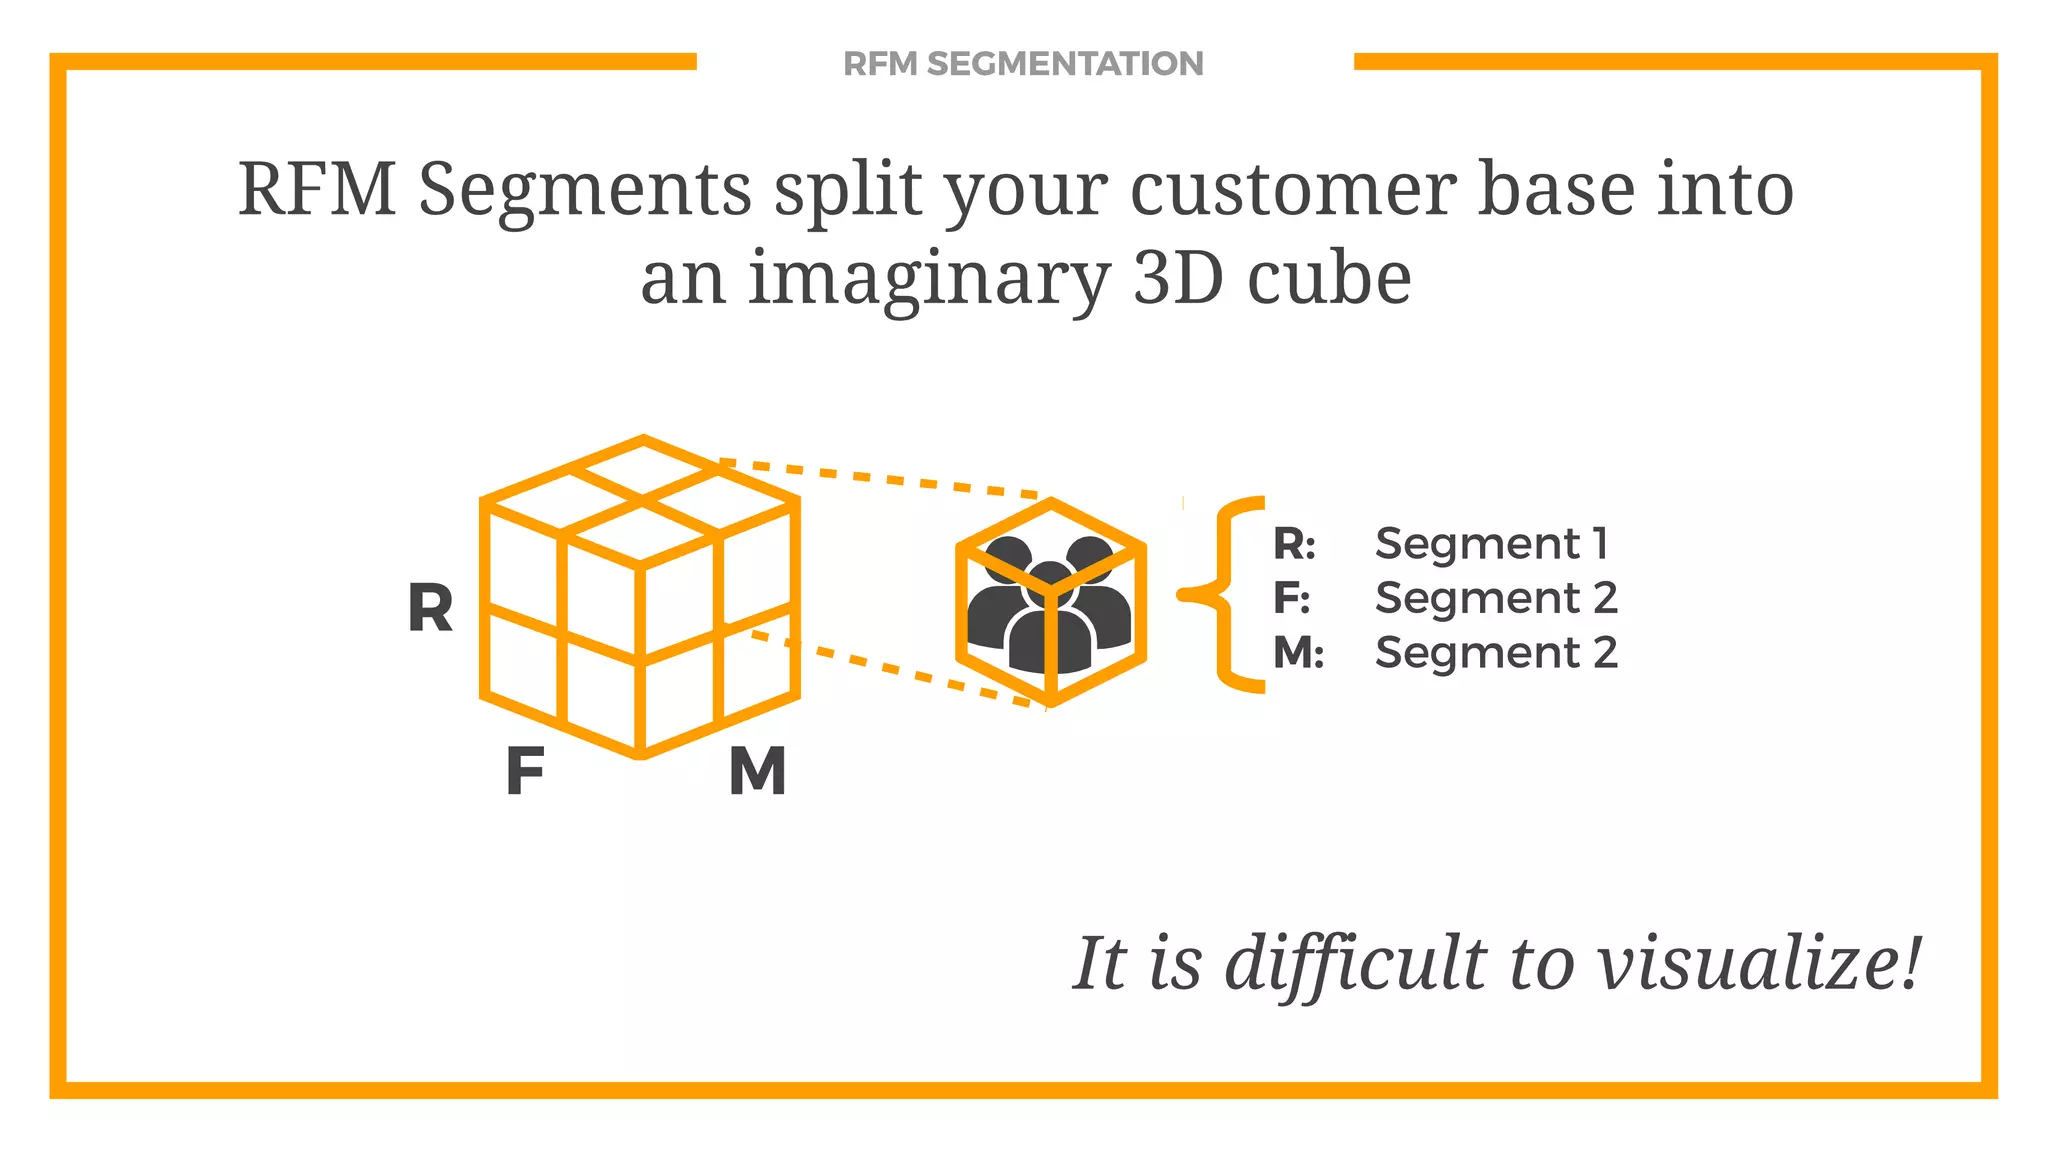
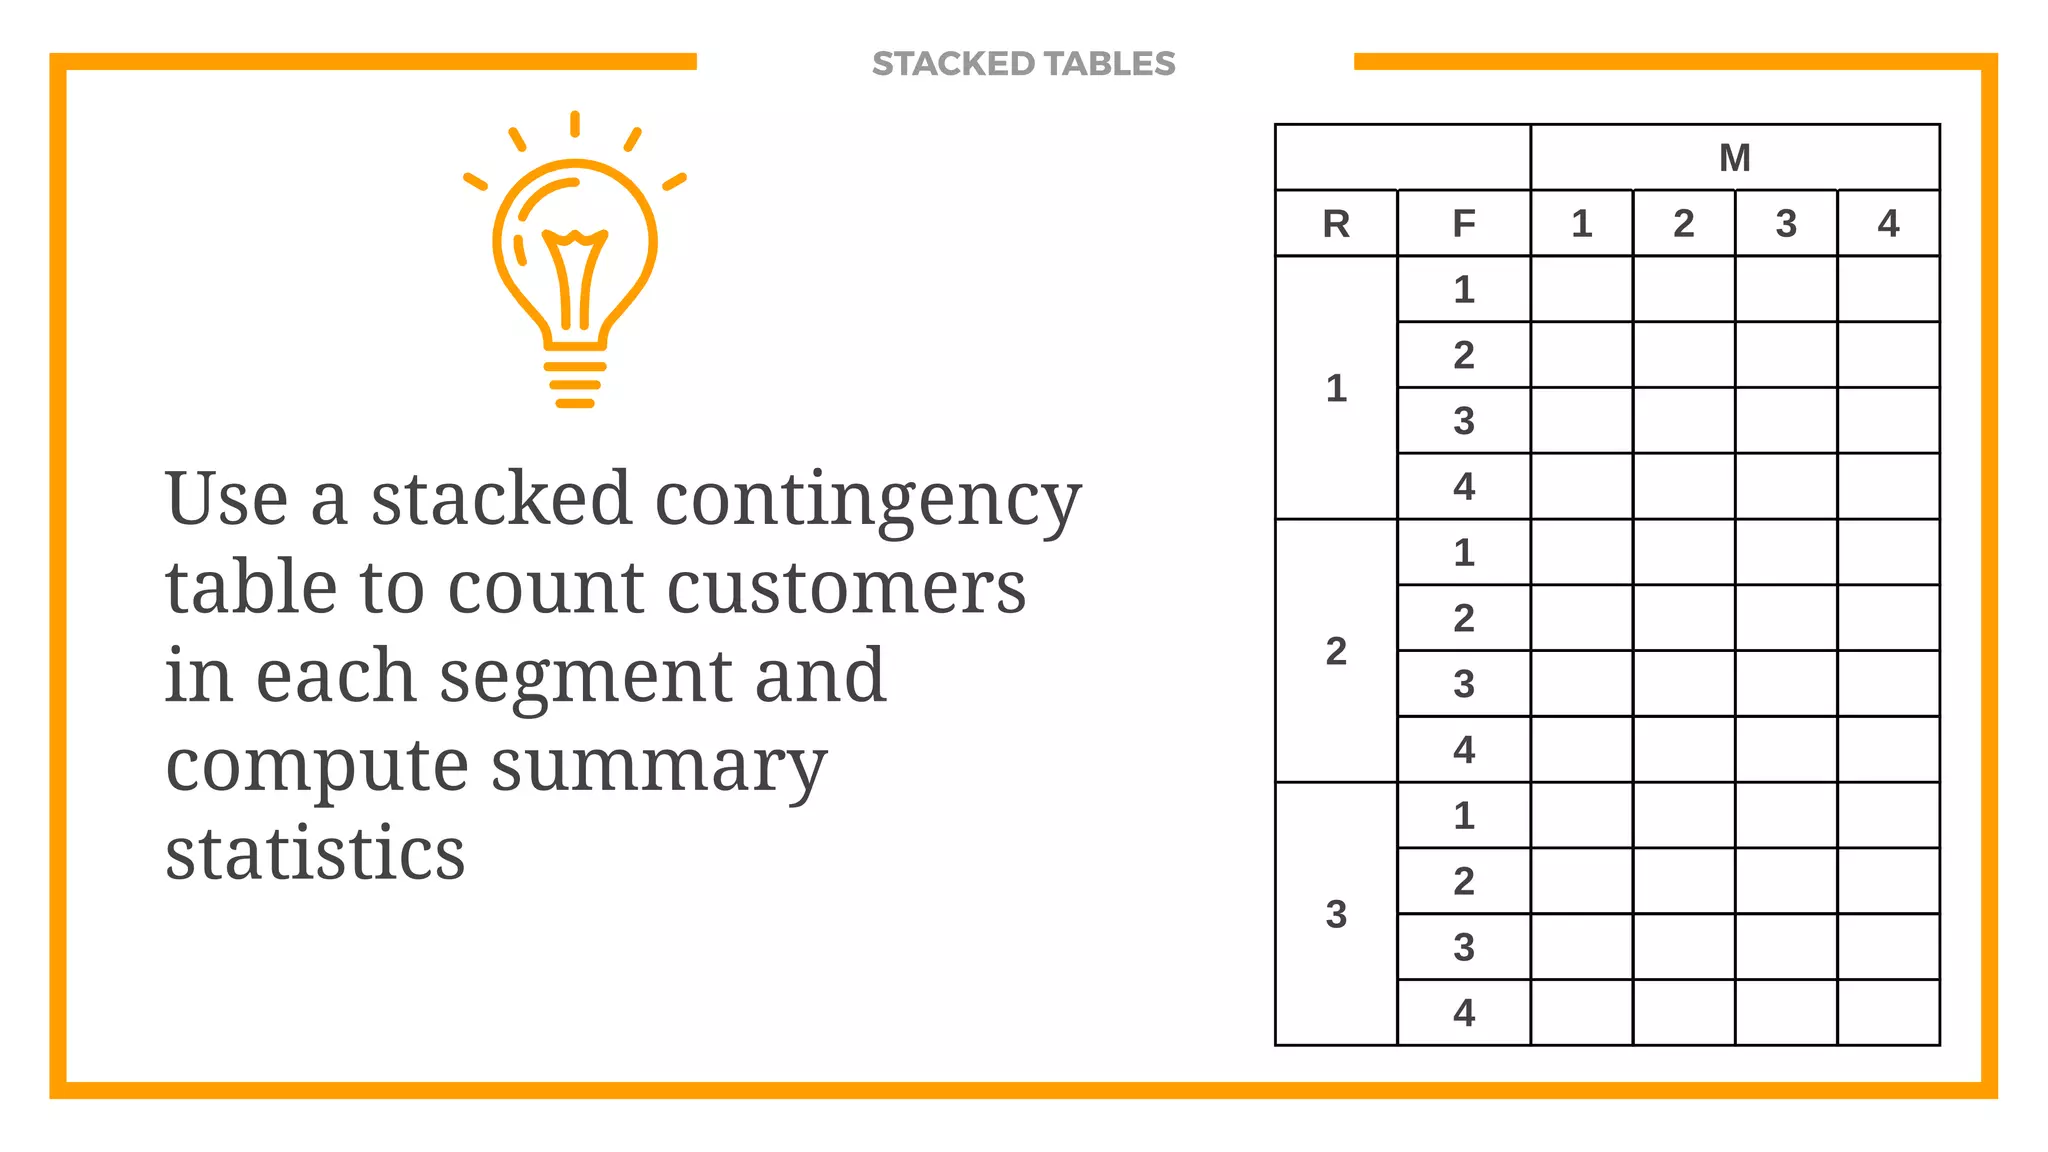
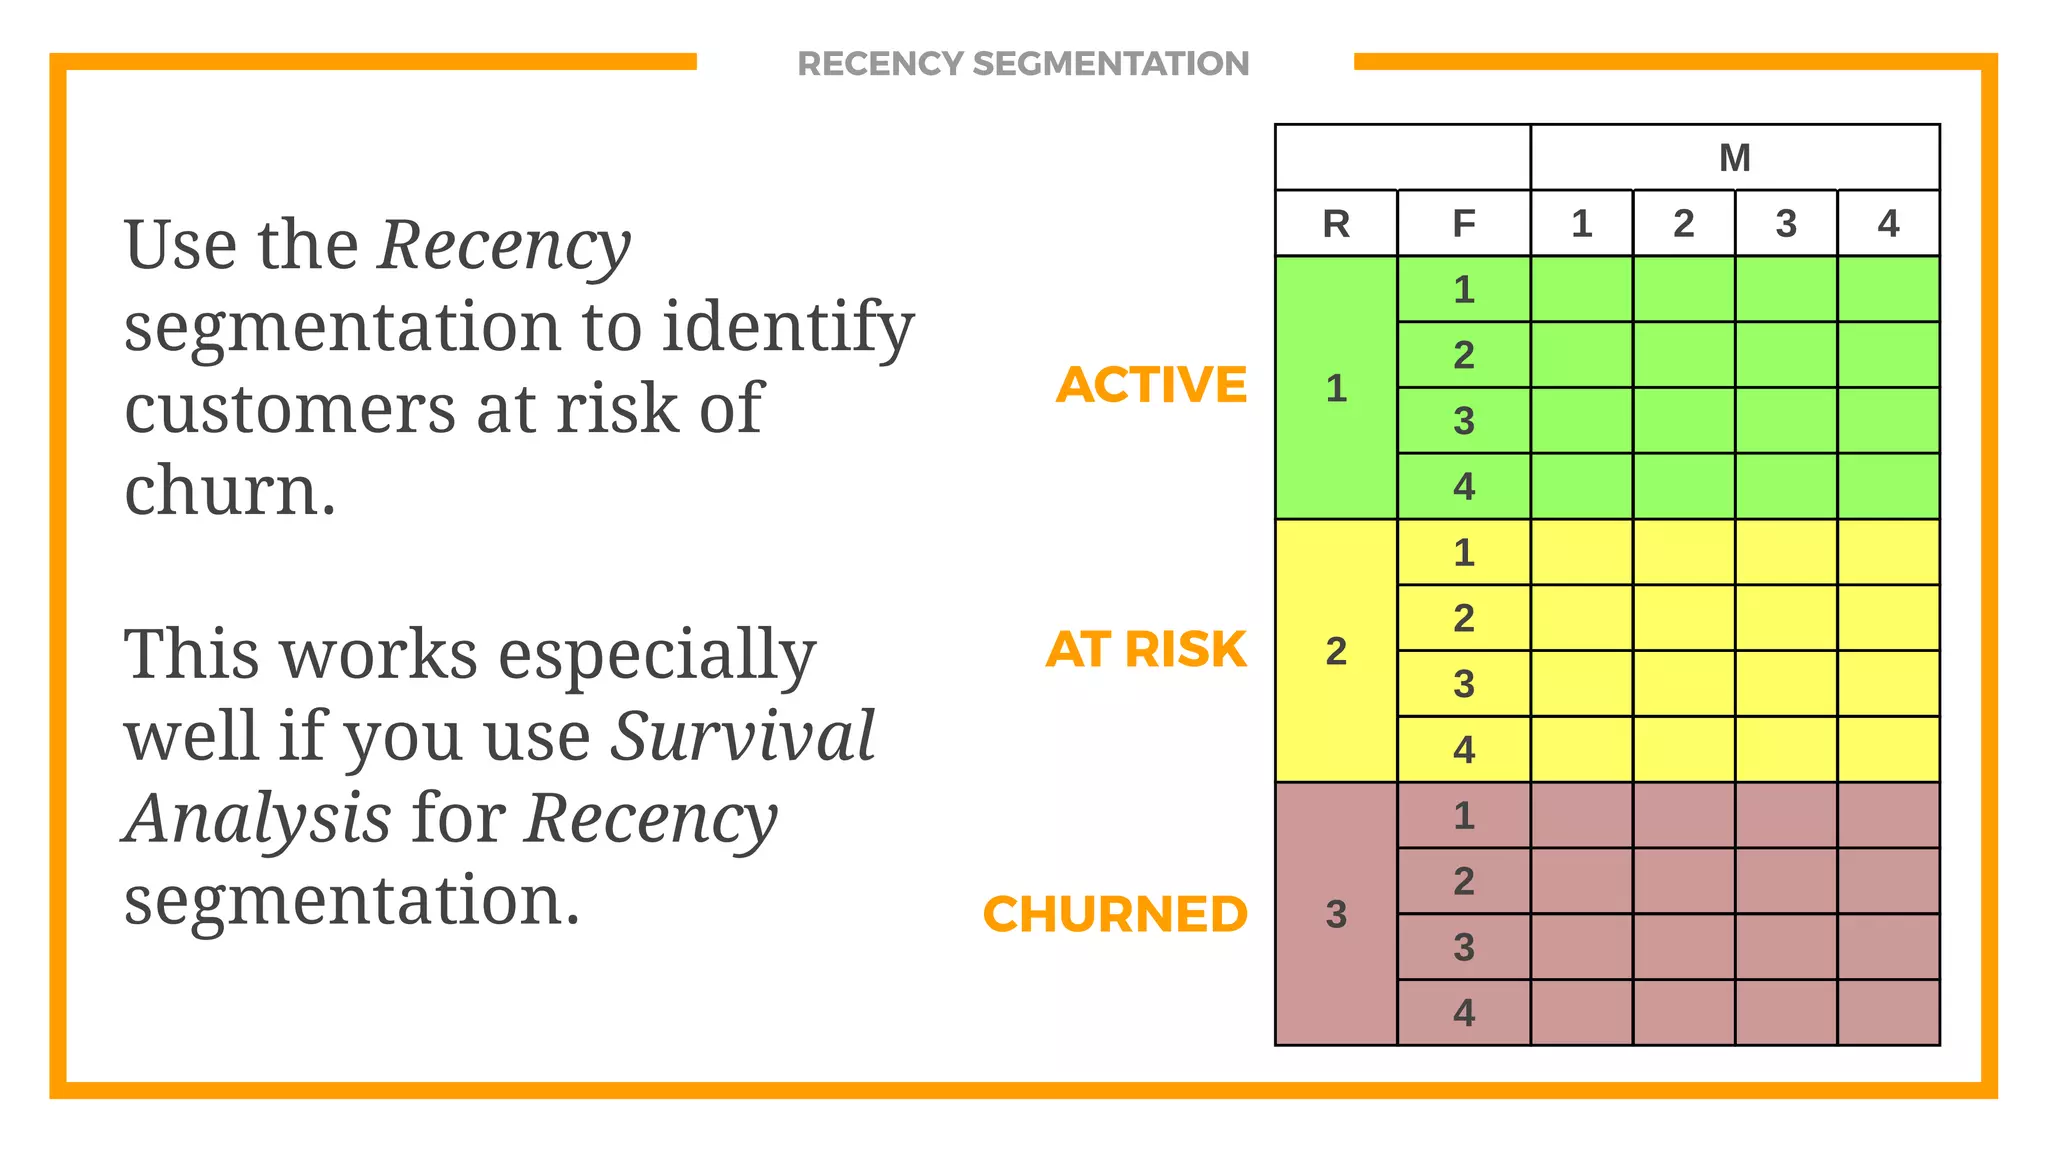
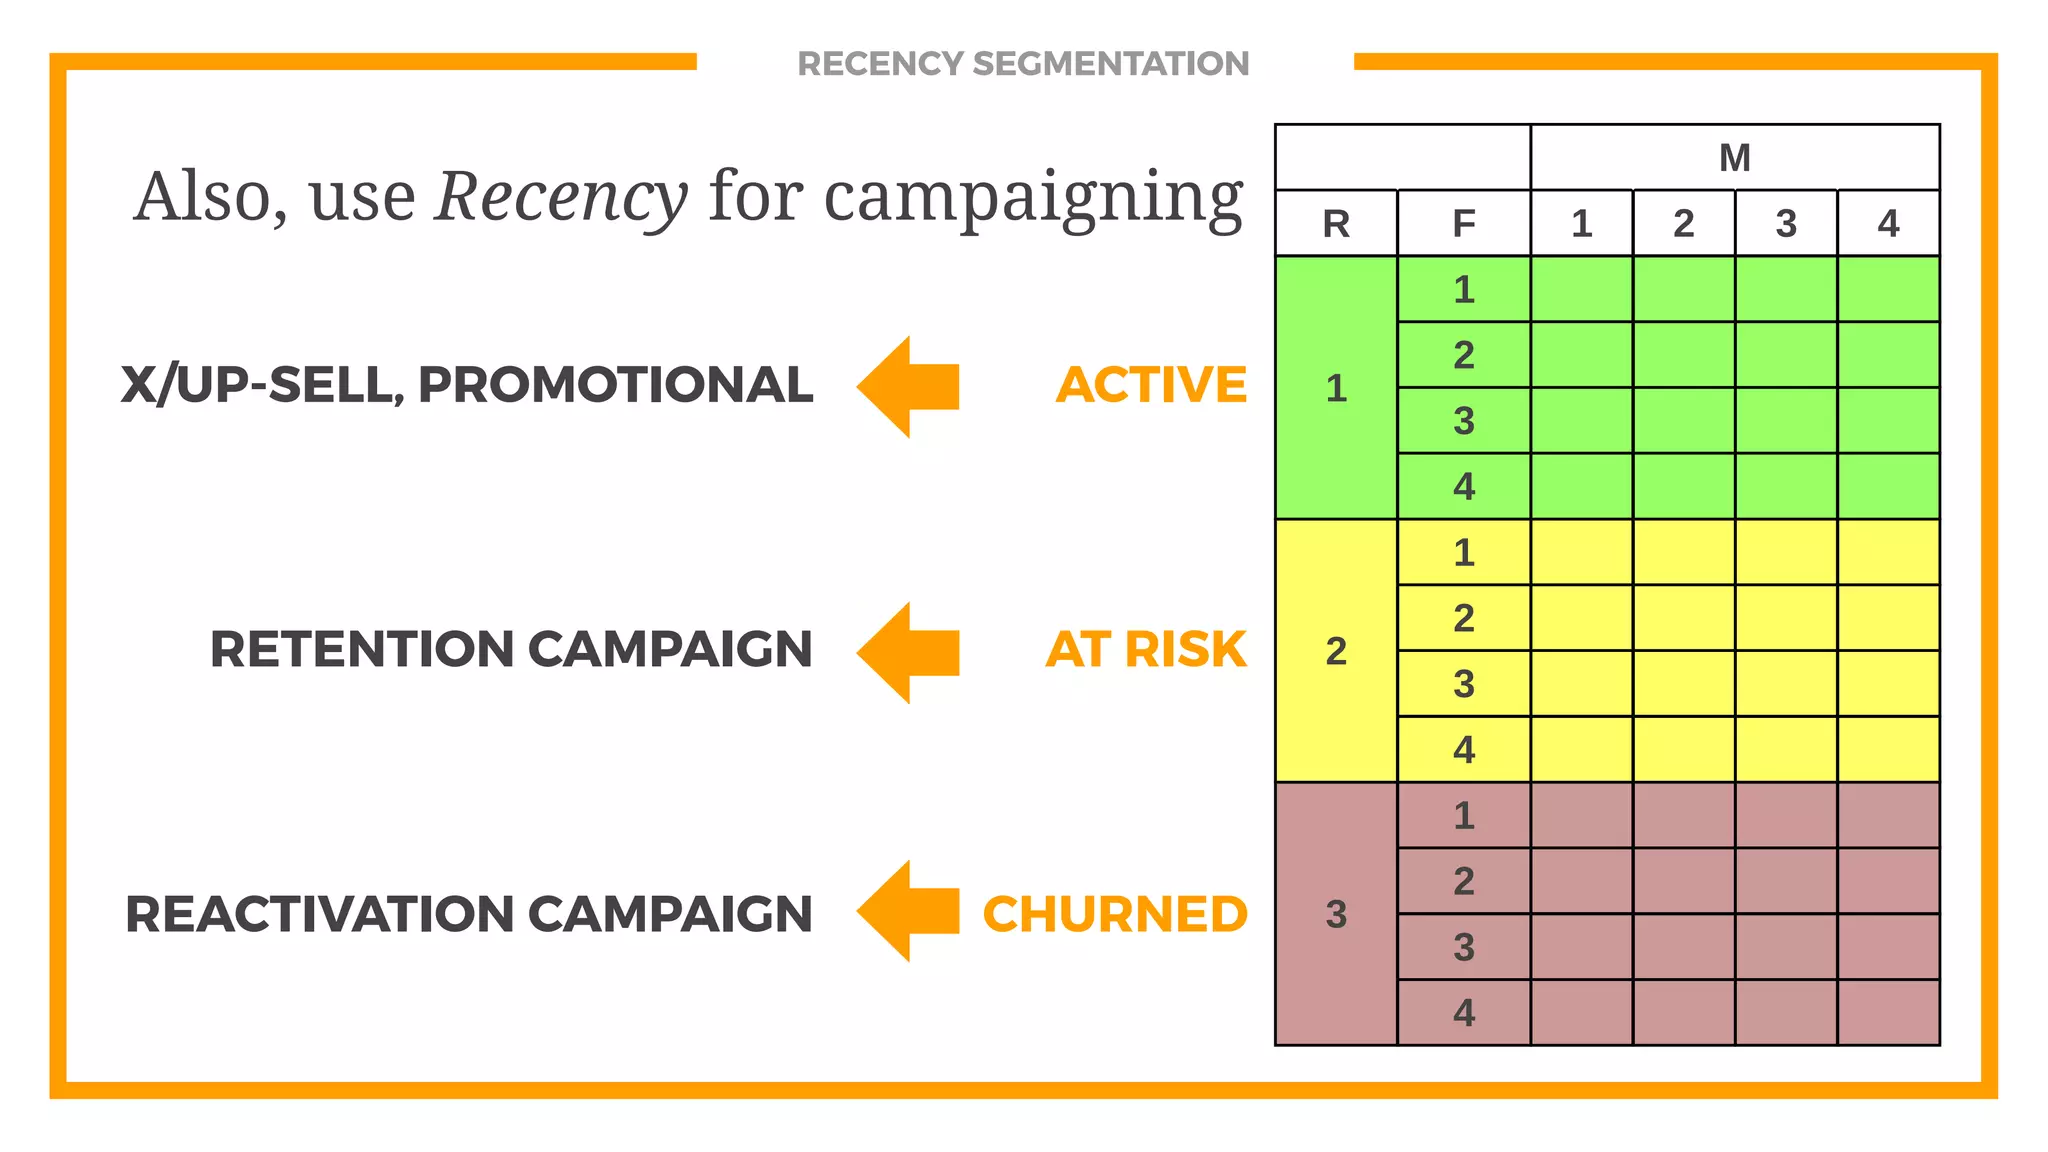
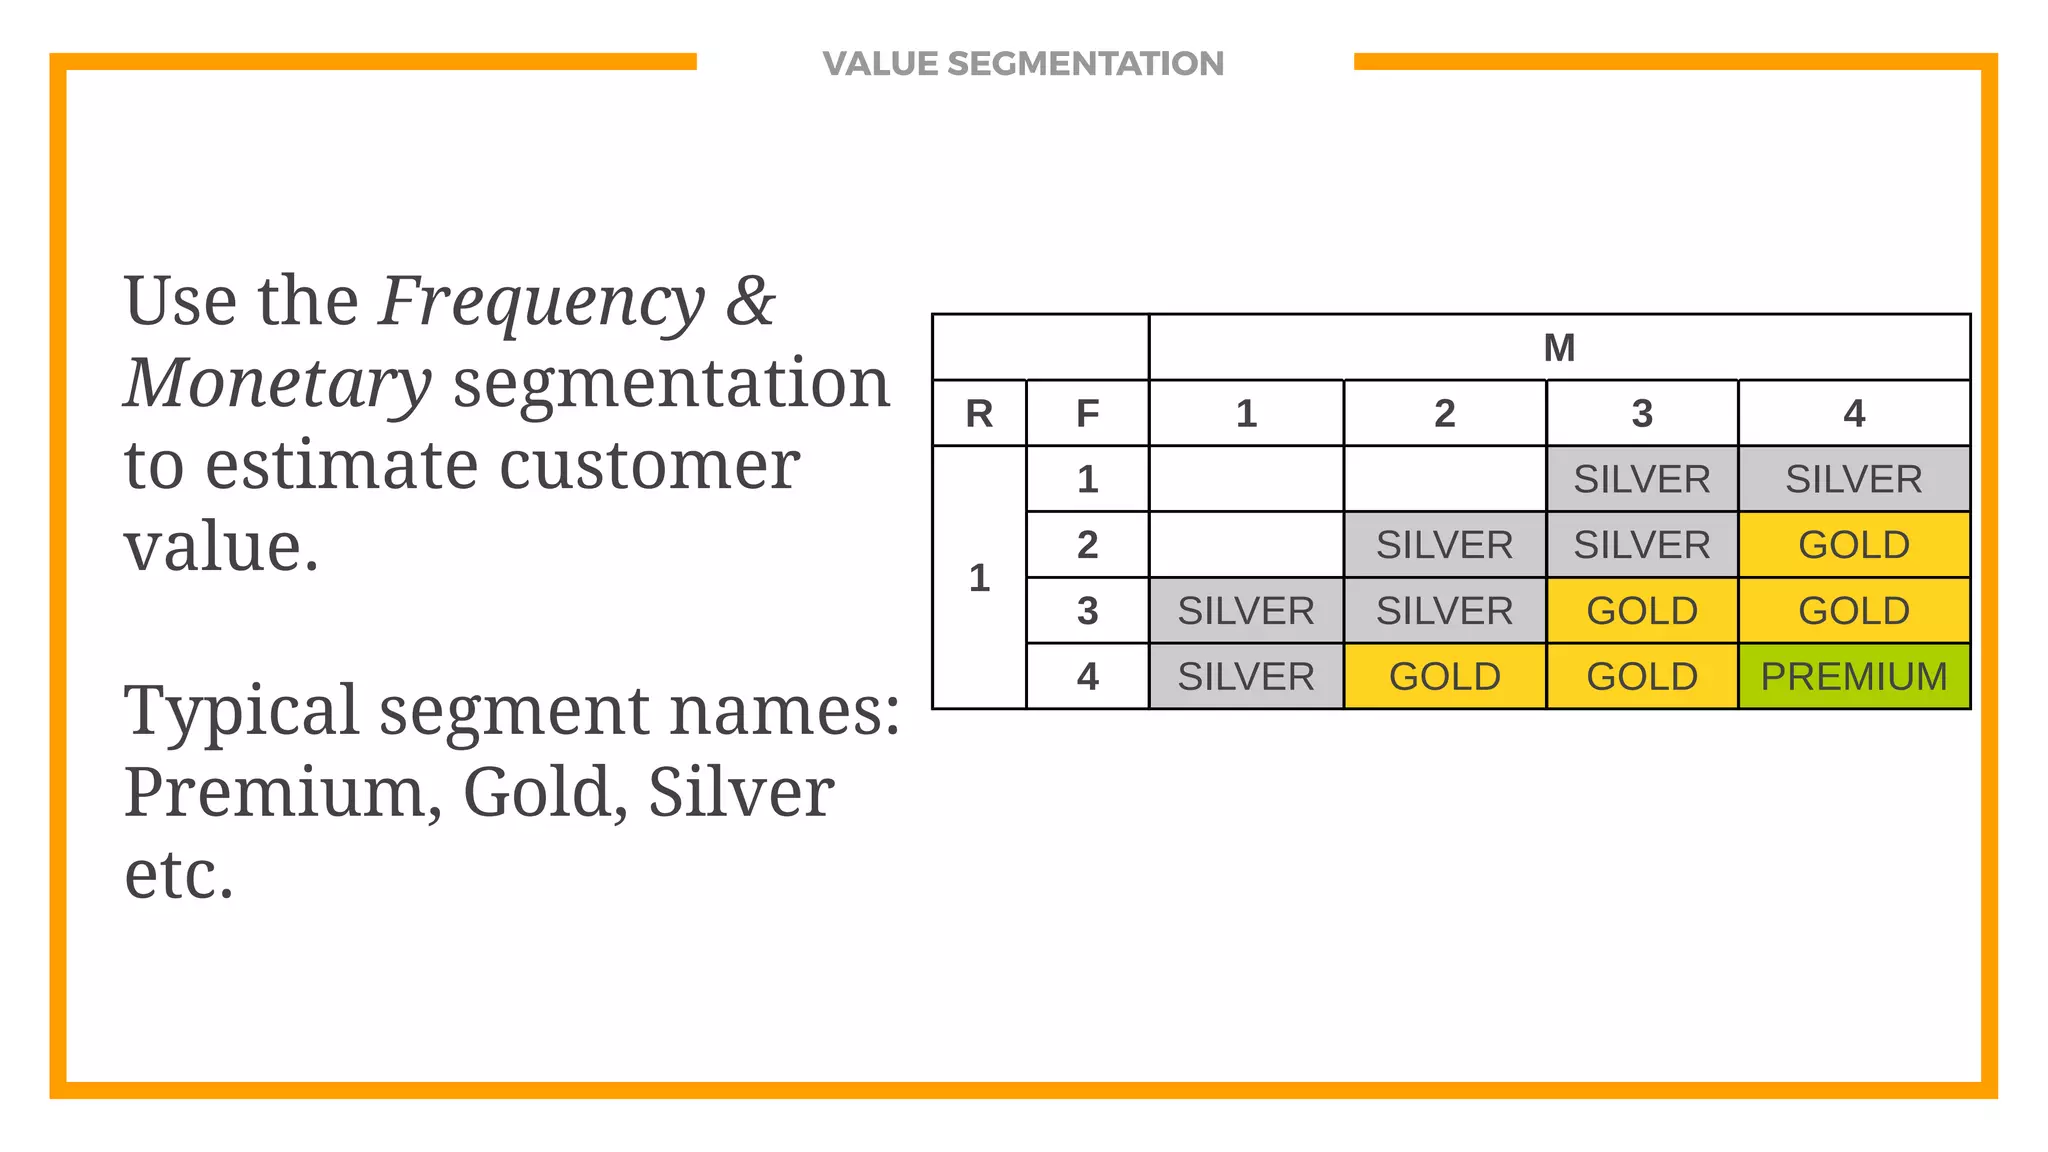
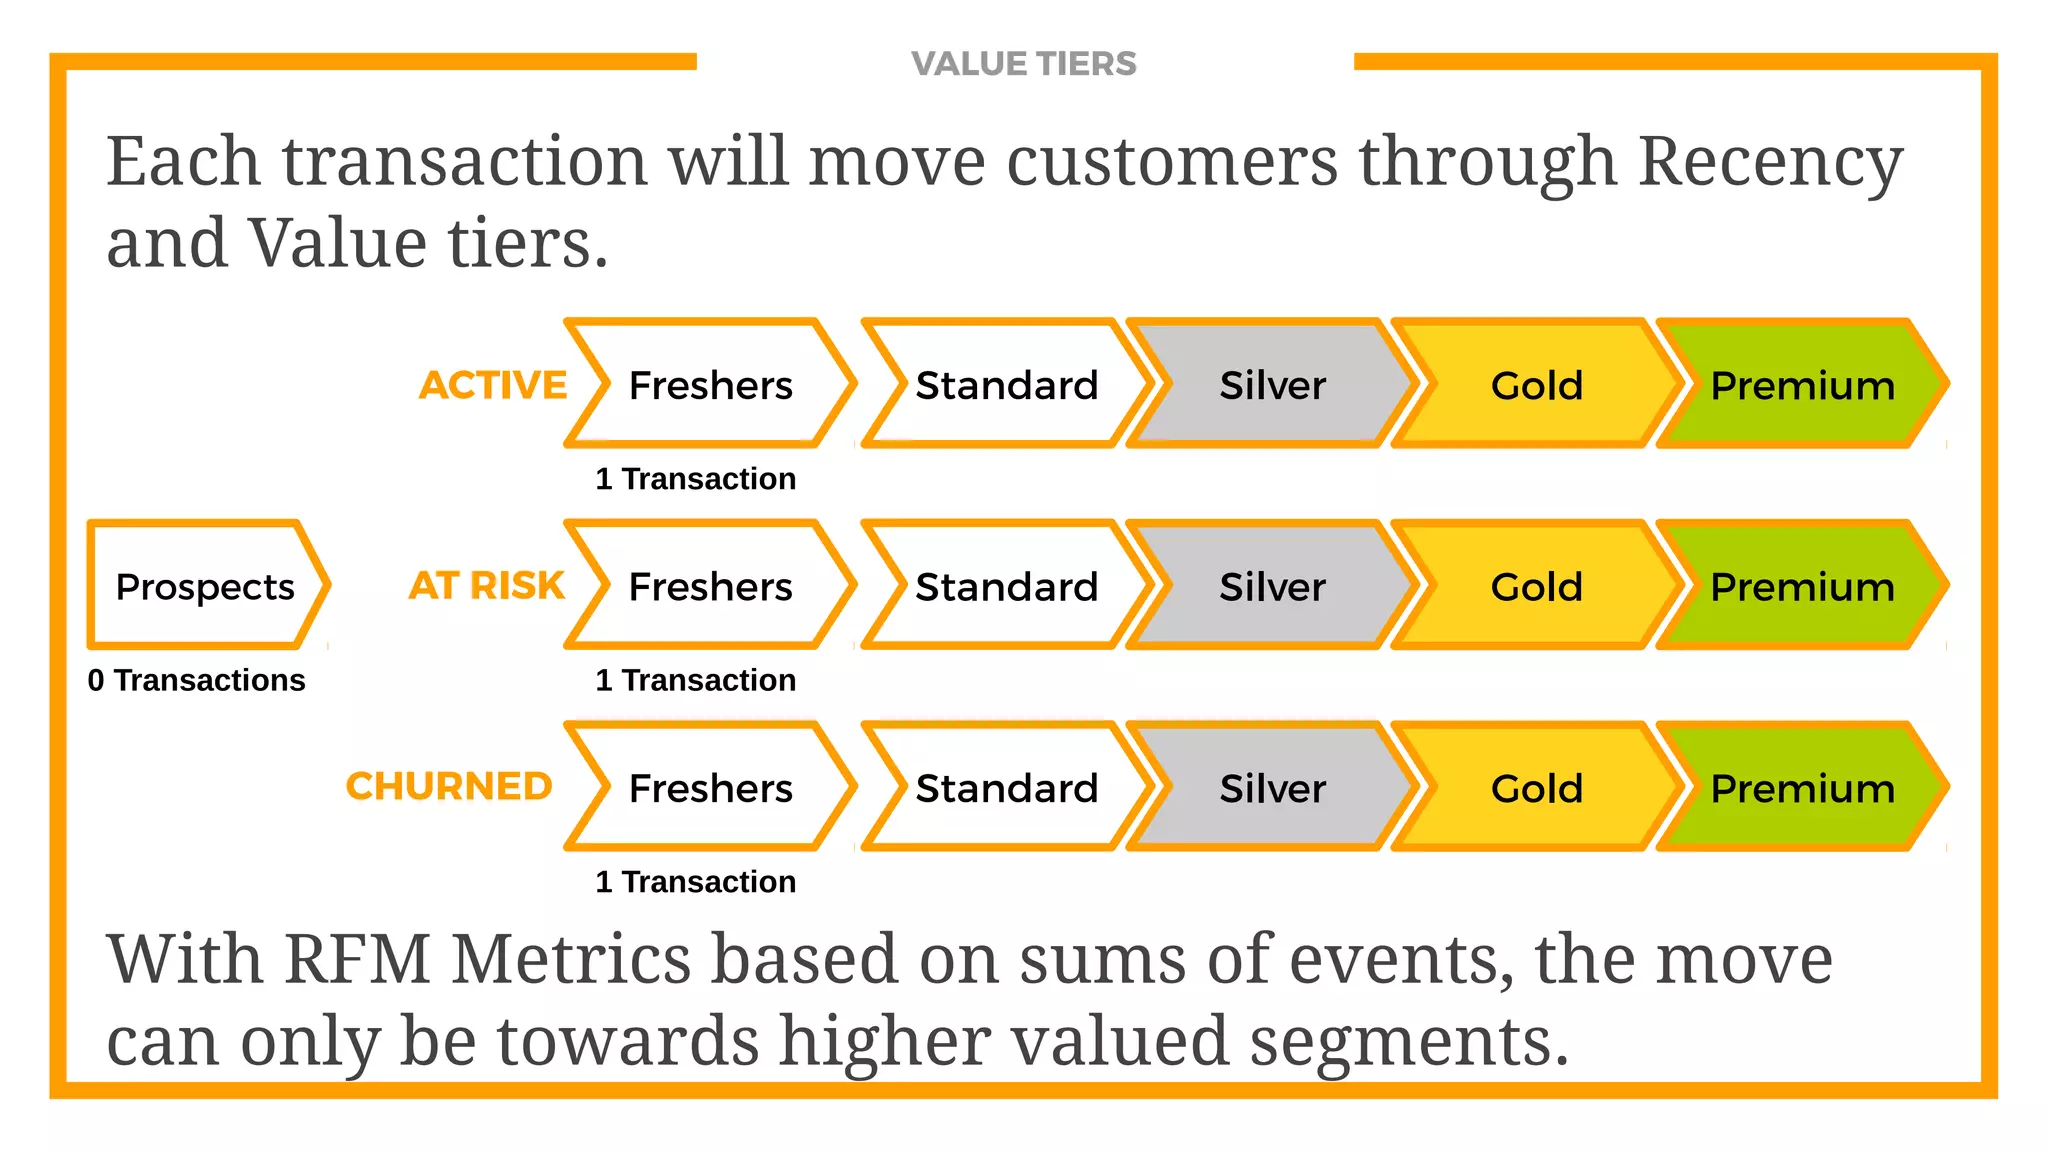
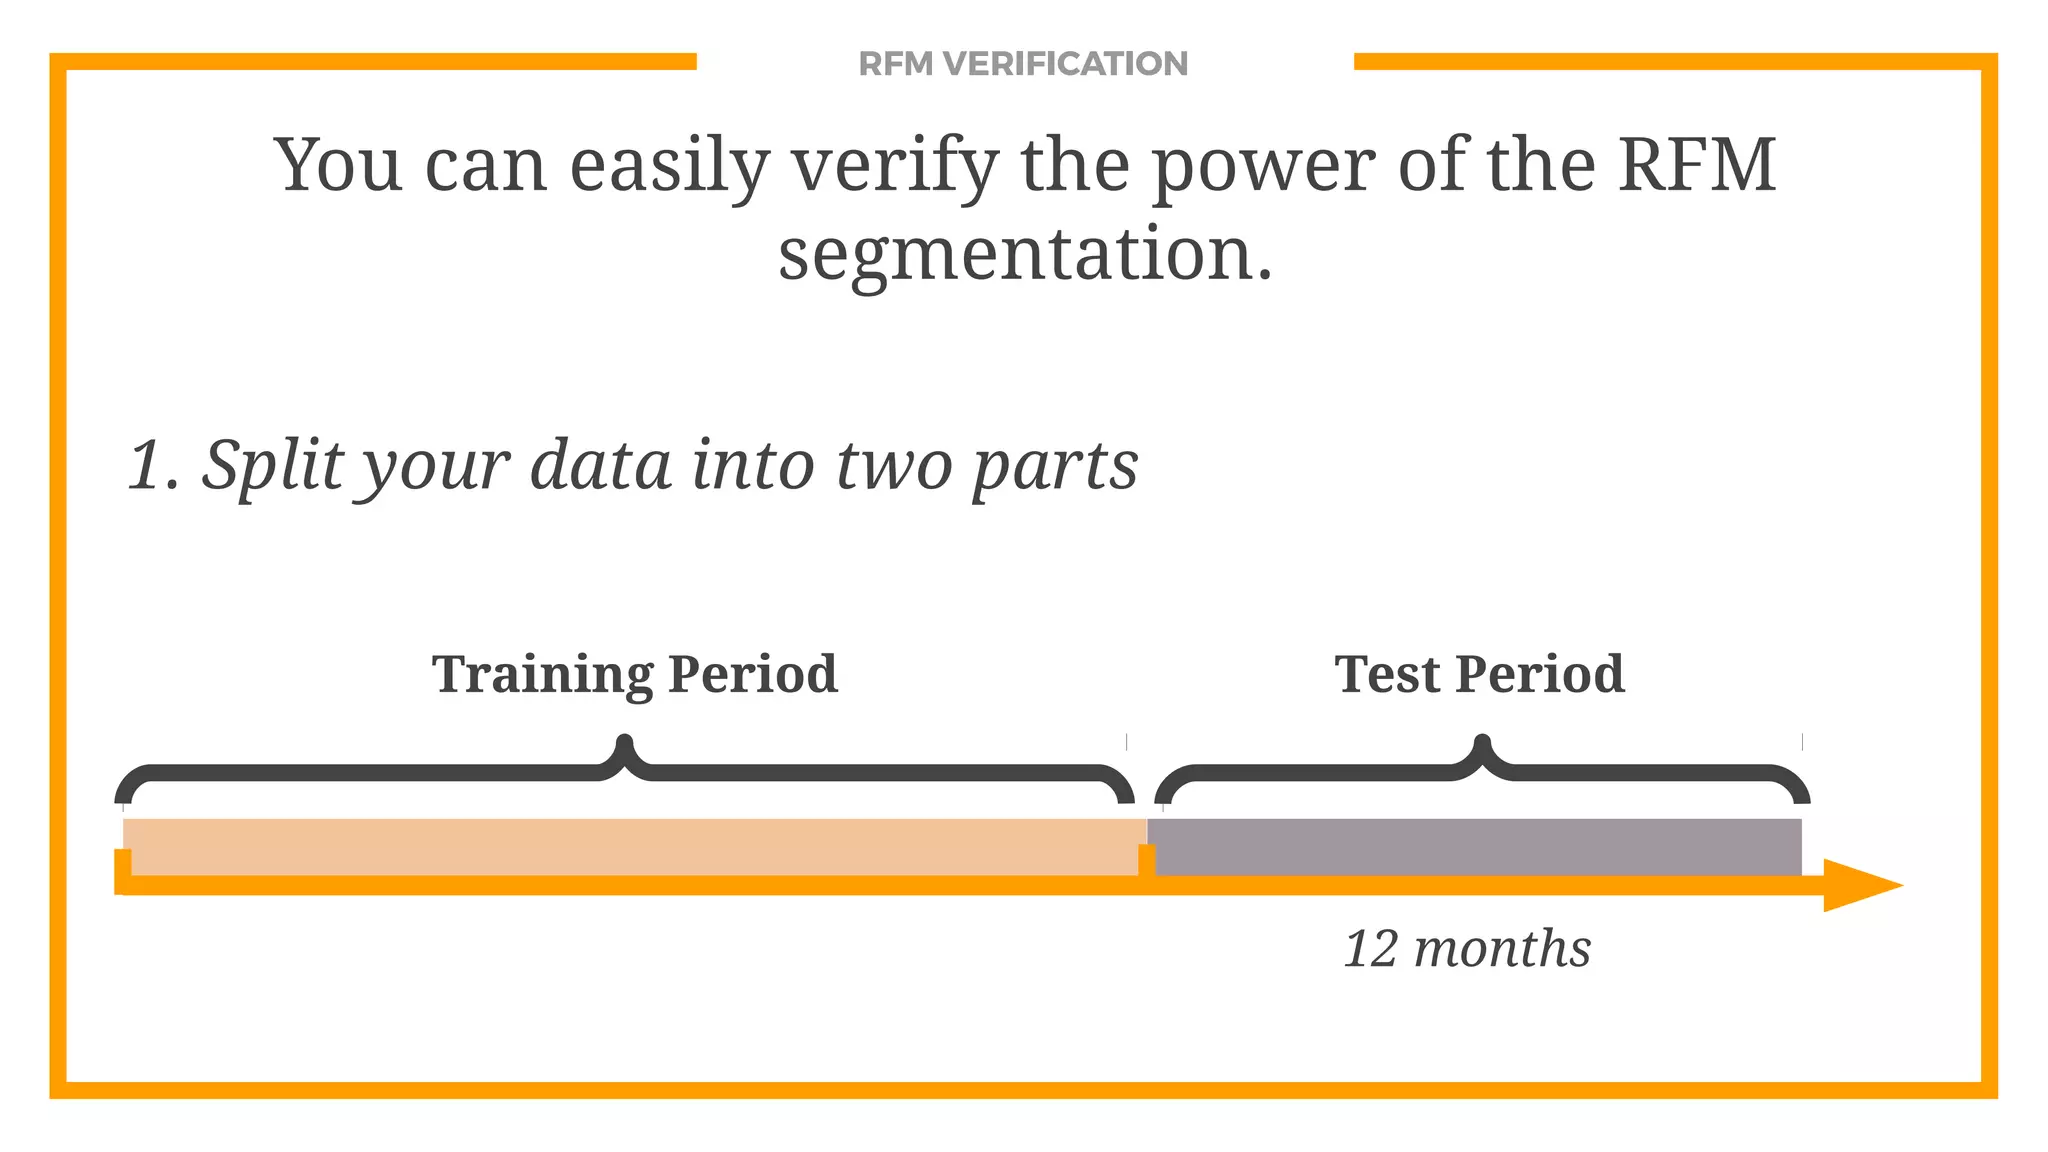
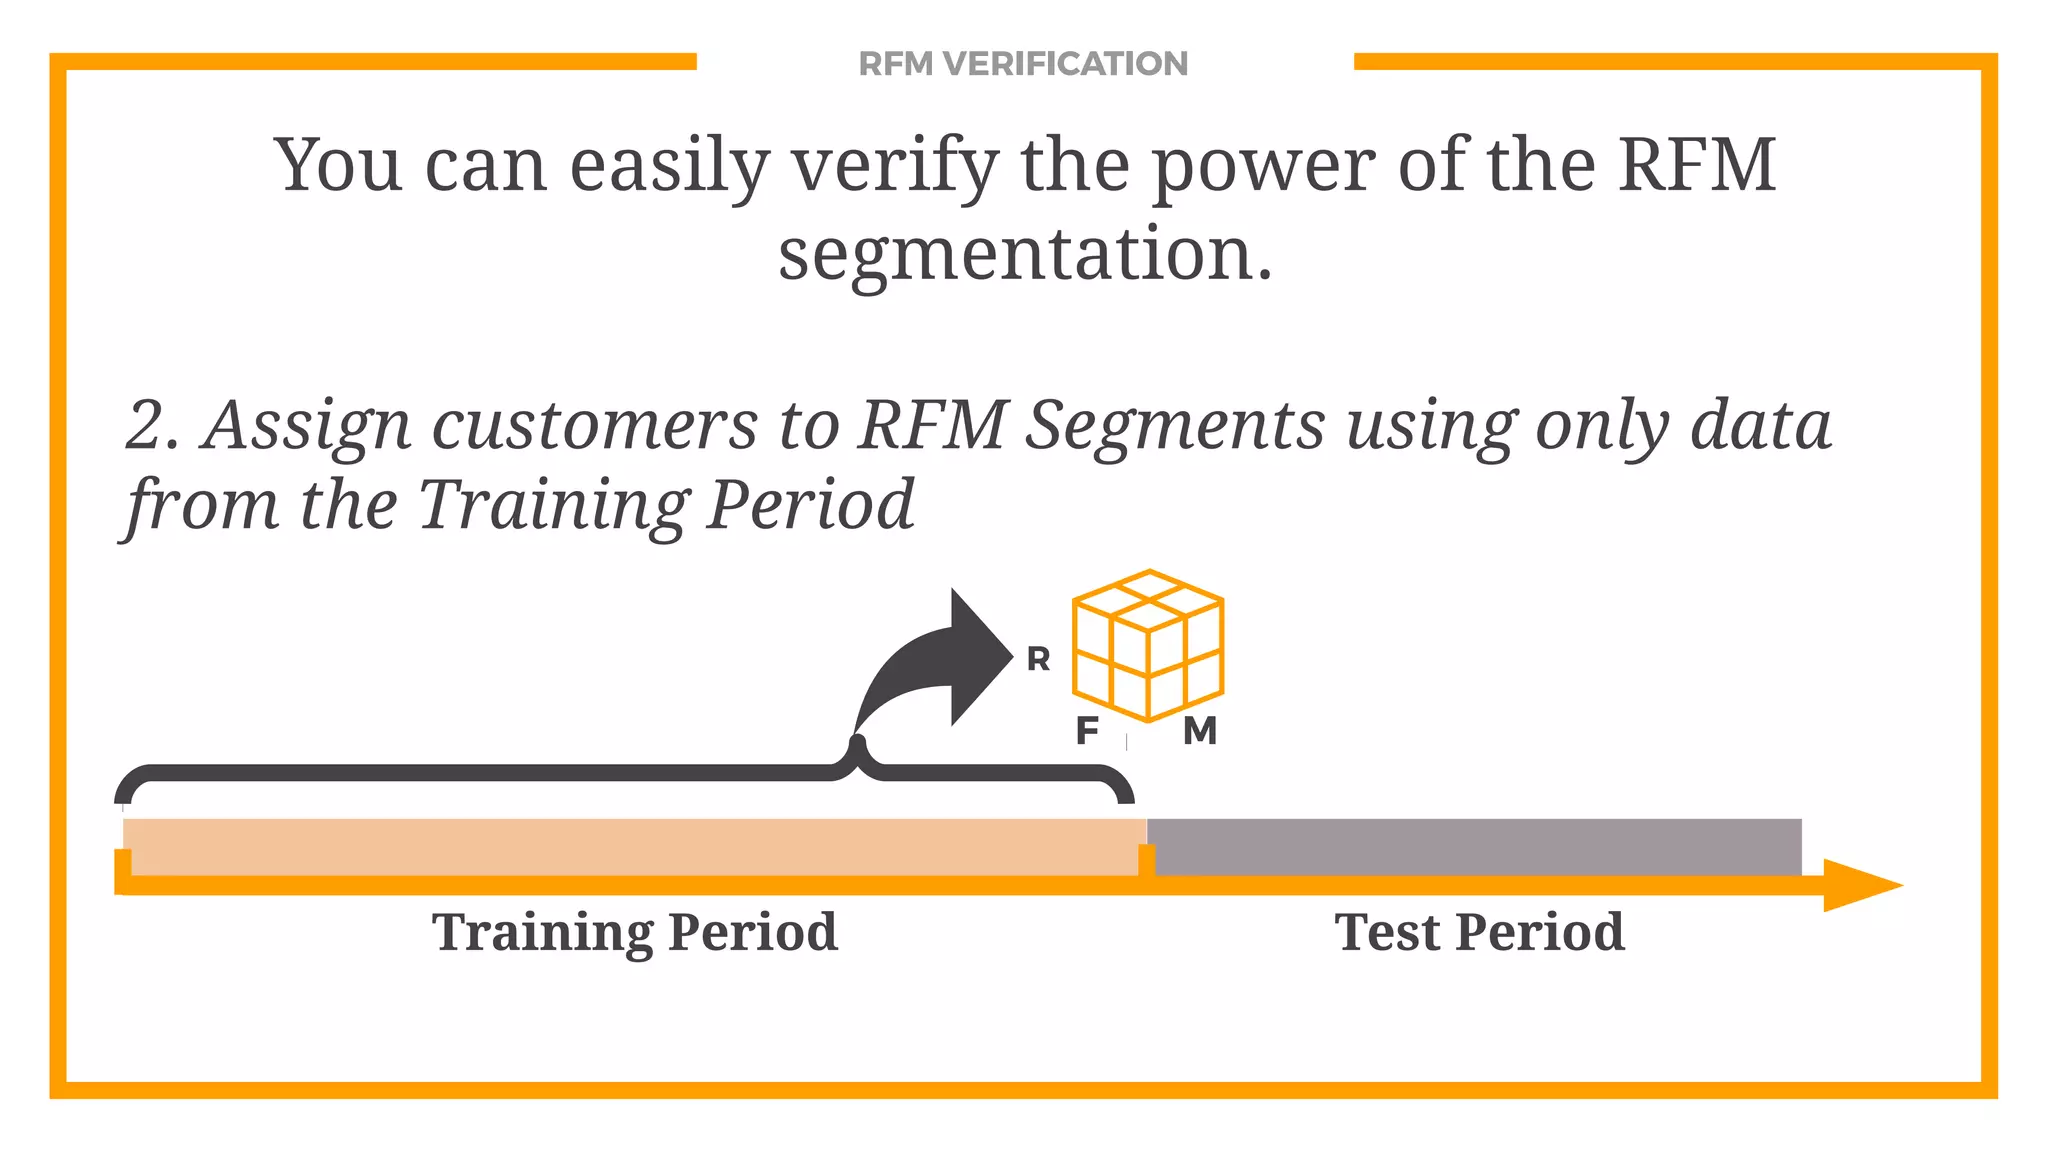
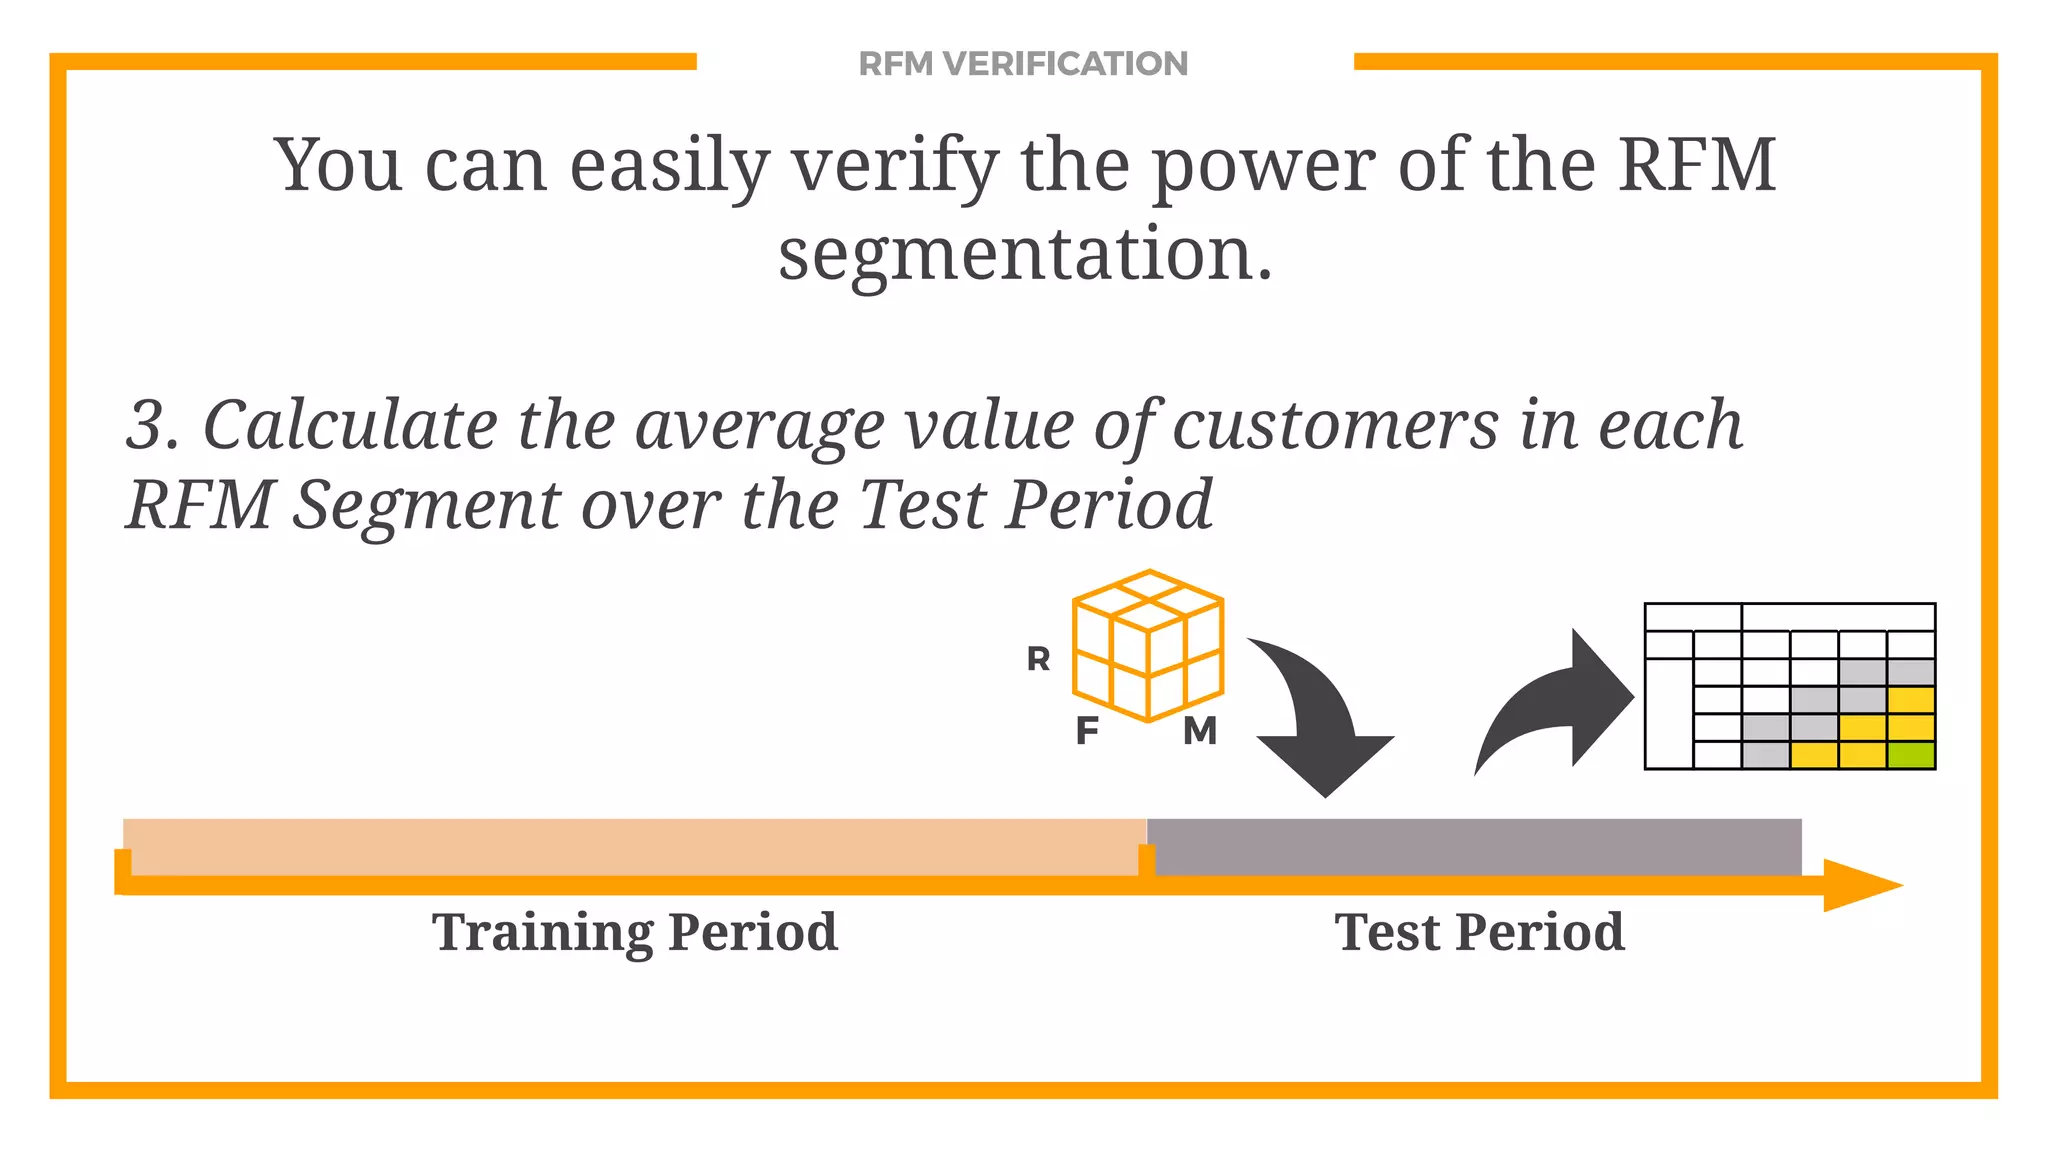
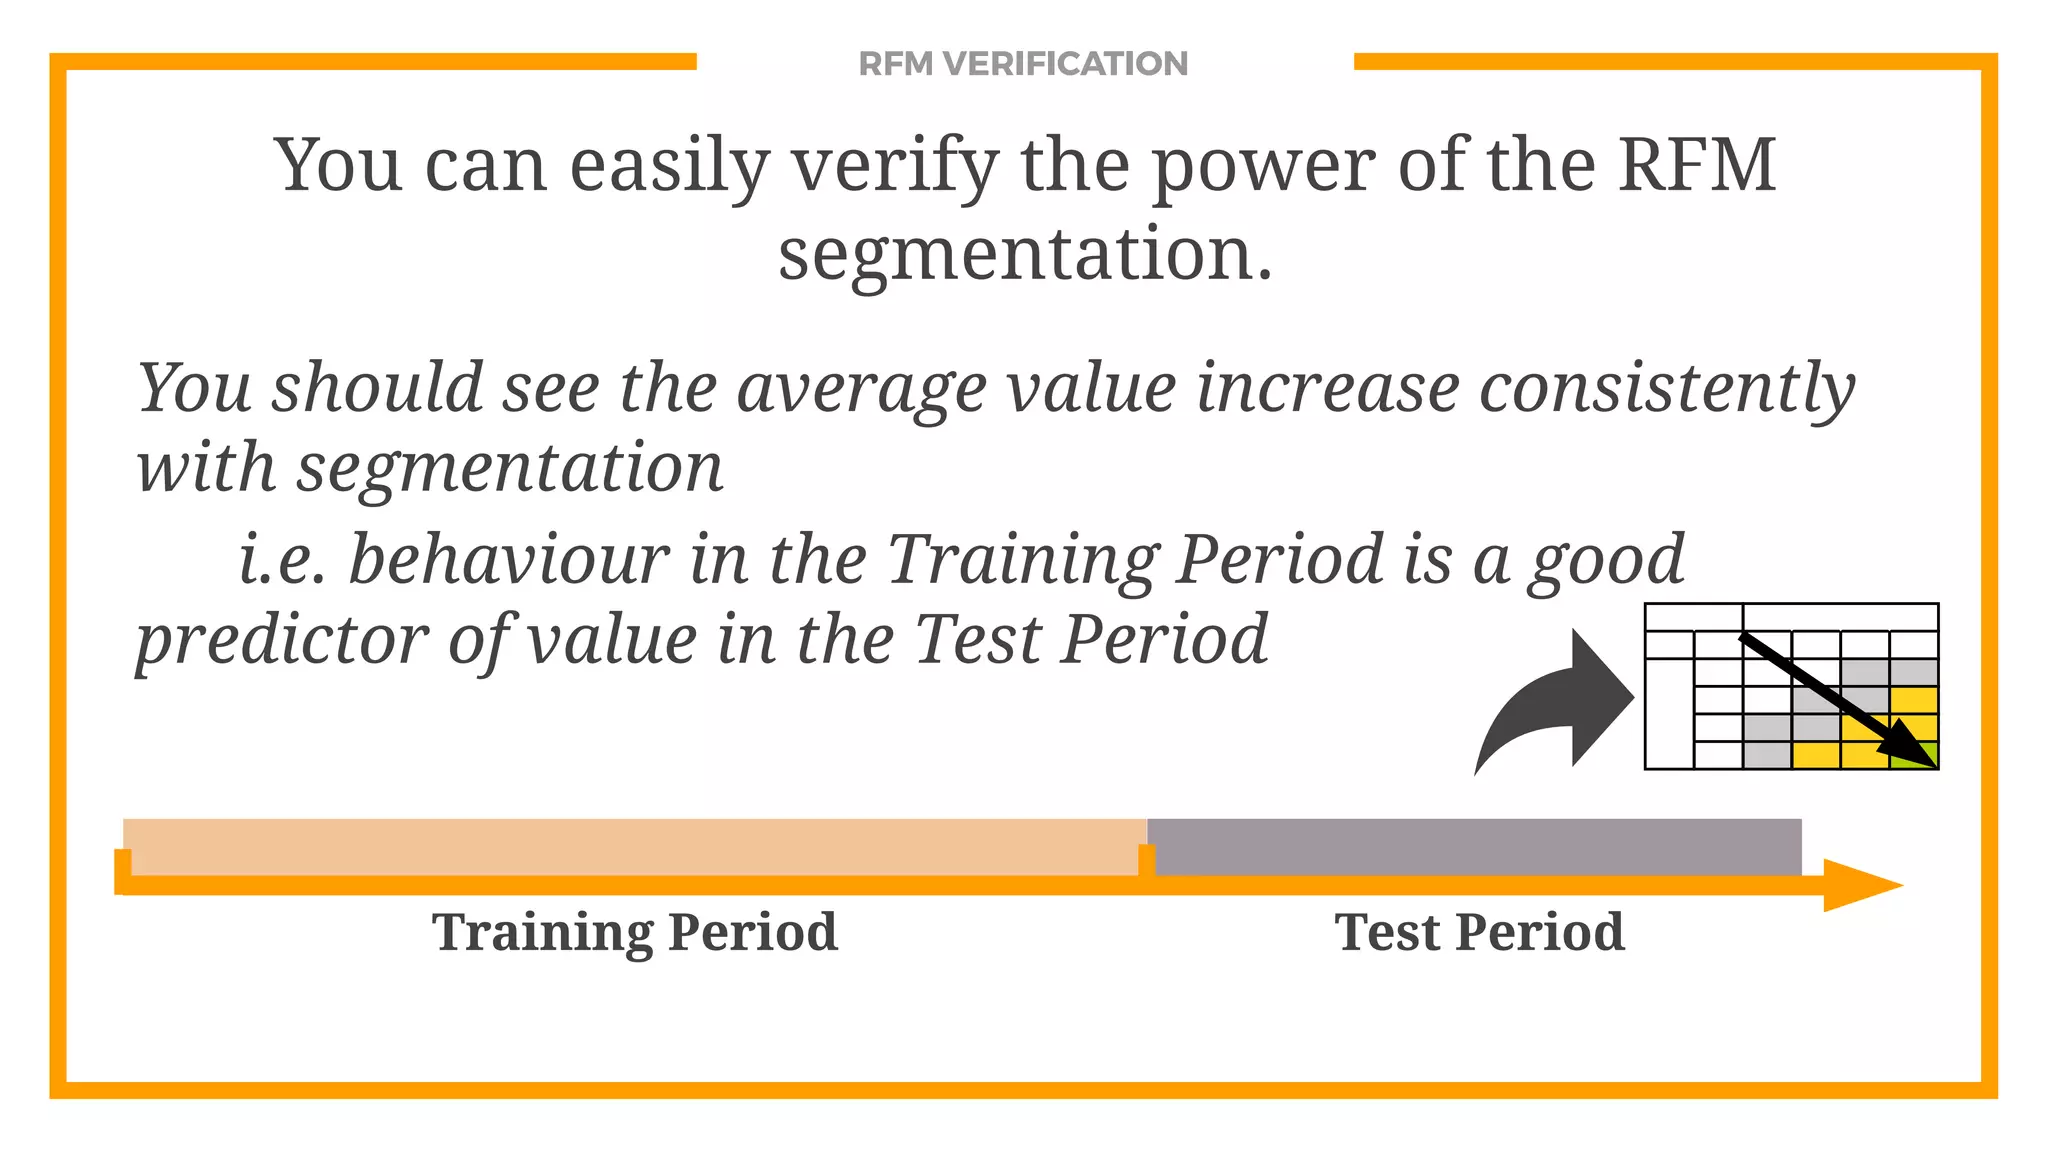

The document discusses RFM customer segmentation, which segments customers based on their Recency (time since last activity), Frequency (number of activities), and Monetary (total monetary value) metrics. These metrics can be calculated from transaction or engagement data and used to group customers into segments. The segments are identified by analyzing the distribution of the RFM metrics and identifying cut-off points. RFM segmentation allows identifying the most valuable customers and those at high risk of churn for targeted marketing campaigns.


![Cdac -Project Presentation [Autosaved].pptx](https://cdn.slidesharecdn.com/ss_thumbnails/cdac-projectpresentationautosaved-231029063336-13e0f780-thumbnail.jpg?width=640&height=640&fit=bounds)