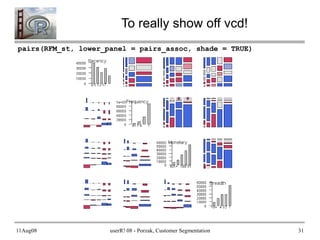
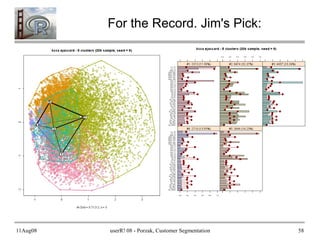
This document discusses using R for customer segmentation. It outlines using purchase behavior data and survey response data to create actionable customer segments. The goal is to improve customer lifetime value by sending targeted messages. The document demonstrates building RFM (recency, frequency, monetary) metrics and segments from purchase data, including data aggregation, metric calculation, and segment assignment. Visualizations of customers in the RFM space are shown to understand segment distributions.

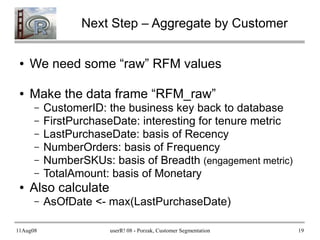
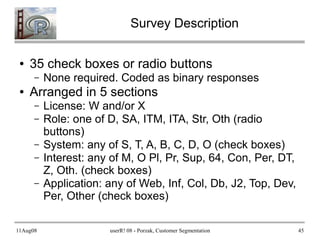
![11Aug08 userR! 08 - Porzak, Customer Segmentation 11
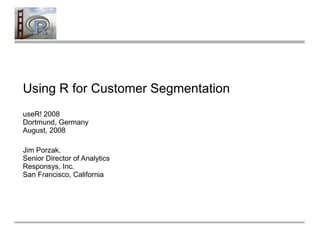
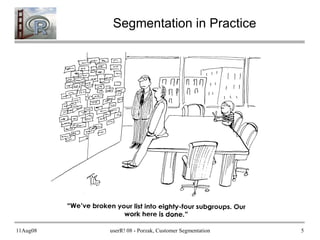
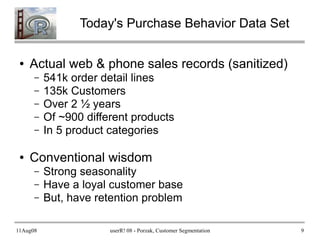
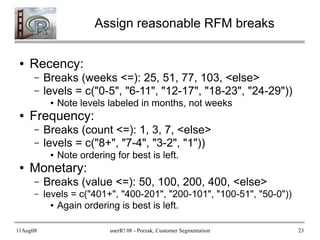
Preloaded as “orders” data frame
> load("BehavioralDataSet.Rda")
> str(orders)
'data.frame': 541101 obs. of 9 variables:
$ SKU_ID : int 459 459 459 459 459 459 459 459 459 459 ...
$ ChannelID: int 3 4 3 3 3 3 4 3 3 3 ...
$ CustID : int 134945 212174 39861 11227 137271 60982 ...
$ OrderID : int 326324 109305 172669 132642 20449 40826 ...
$ OrderDate:Class 'Date' num [1:541101] 13211 13649 13670 ...
$ Quantity : int 1 2 1 3 1 1 1 1 1 1 ...
$ Amount : num 18 36 18 54 18 18 18 18 18 18 ...
$ Channel : Factor w/ 4 levels "phone1","phone2",..: 3 4 3
3 ...
$ Category : Factor w/ 7 levels "*","C","G","I",..: 3 3 3 3
3 ...](https://image.slidesharecdn.com/usingrforcustomersegmentation-161115133908/85/Using-R-for-customer-segmentation-11-320.jpg)
![11Aug08 userR! 08 - Porzak, Customer Segmentation 12
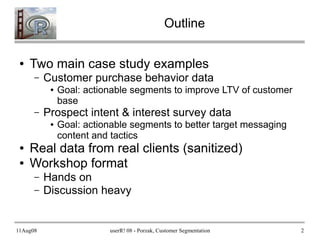
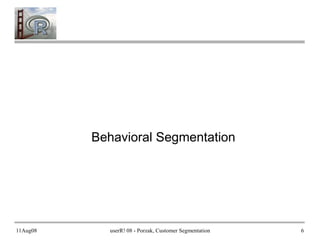
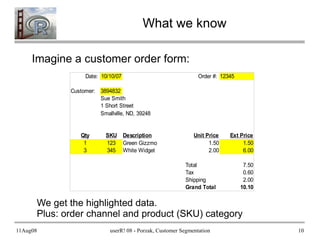
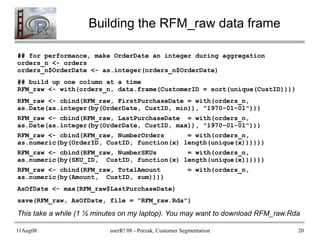
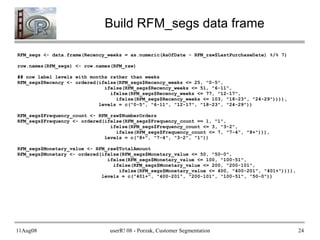
orders summary
> summary(orders[-(1:2)])
CustID OrderID OrderDate Quantity
Min. : 2 Min. : 2 Min. :2005-09-01 Min. : 0.000
1st Qu.: 62221 1st Qu.:105292 1st Qu.:2006-07-18 1st Qu.: 1.000
Median :124343 Median :210908 Median :2007-02-14 Median : 1.000
Mean :152974 Mean :207535 Mean :2007-03-11 Mean : 1.113
3rd Qu.:185119 3rd Qu.:315711 3rd Qu.:2007-12-04 3rd Qu.: 1.000
Max. :506929 Max. :388319 Max. :2008-07-14 Max. :275.000
NA's : 4
Amount Channel Category
Min. : 0.01 phone1: 14303 *: 0
1st Qu.: 20.00 phone2: 90 C:142147
Median : 30.00 web1 :451354 G:114300
Mean : 31.81 web2 : 75354 I: 14961
3rd Qu.: 35.00 N: 50385
Max. :4577.00 T:199354
X: 19954](https://image.slidesharecdn.com/usingrforcustomersegmentation-161115133908/85/Using-R-for-customer-segmentation-12-320.jpg)
![11Aug08 userR! 08 - Porzak, Customer Segmentation 34
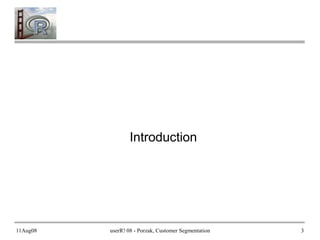
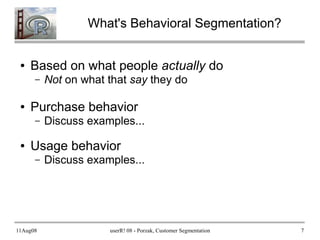
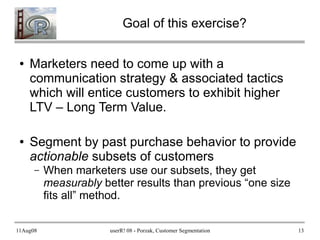
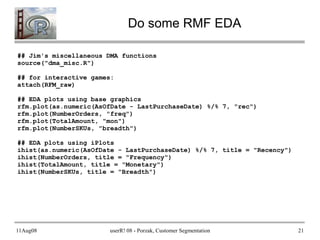
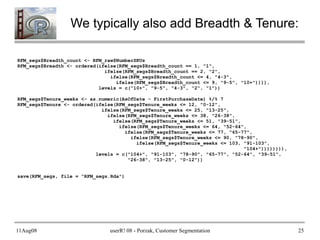
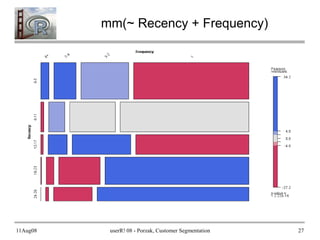
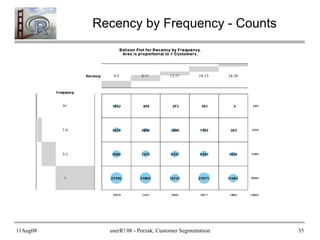
Use Balloon Plots to Communicate
require(gplots)
# Recency by Frequence - Counts
RxF <- as.data.frame(table(RFM_segs$Recency, RFM_segs$Frequency,
dnn = c("Recency", "Frequency")),
responseName = "Number_Customers")
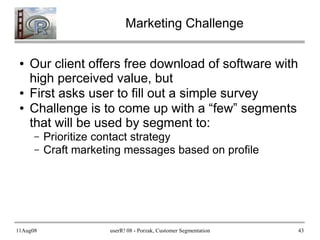
with(RxF, balloonplot(Recency, Frequency, Number_Customers, zlab = "#
Customers"))
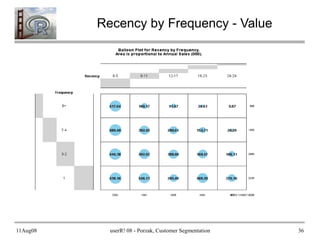
# Recency by Frequency - Annual Value (total annual sales to segment)
VbyRxF <- (aggregate(RFM_segs$Monetary_value,
by = list(Recency = factor(RFM_segs$Recency),
Frequency = RFM_segs$Frequency),
sum))
names(VbyRxF)[3] <- "Annual_Sales"
VbyRxF$Annual_Sales <- VbyRxF$Annual_Sales / (28/12) ## normalize to
annual revnue
with(VbyRxF, balloonplot(Recency, Frequency, Annual_Sales / 1000, zlab =
"Annual Sales (000)"))](https://image.slidesharecdn.com/usingrforcustomersegmentation-161115133908/85/Using-R-for-customer-segmentation-34-320.jpg)
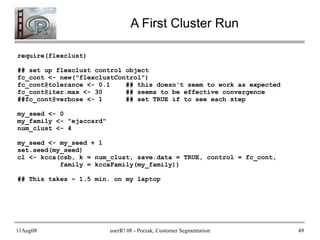
![11Aug08 userR! 08 - Porzak, Customer Segmentation 38
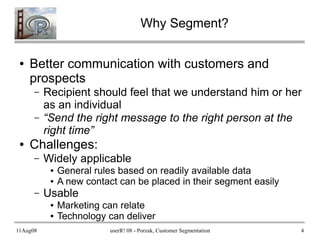
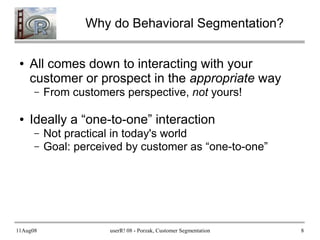
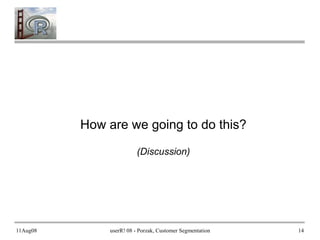
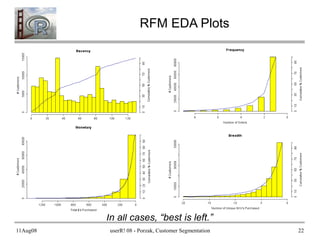
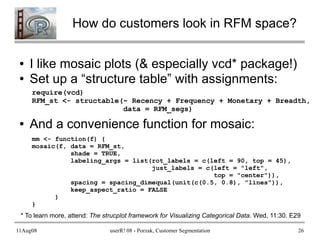
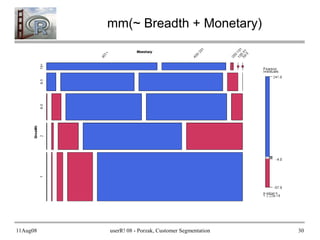
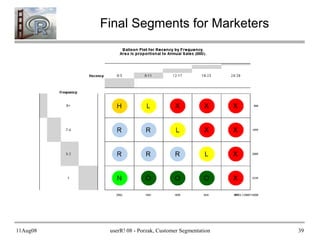
Color & Label Segment Cells
# a matrix of segment codes
RF_segs0 <- matrix("", nrow = 4, ncol = 5)
# manually make assignments
object.browser() ## Fill in H, R, N, L, or O. Save as RF_segs.txt
# get back into R
RF_segs <- as.matrix(read.delim("RF_segs.txt", sep = "t",
na.strings = ""))
RF_segs[is.na(RF_segs)] <- "X" ## N/A's become “Lost”
# add colors and labels to balloon plot
# Magic values for balloon cell centers
RF_x <- matrix(2:6 + 0.25, nrow = 4, ncol = 5, byrow = TRUE)
RF_y <- matrix(4:1, nrow = 4, ncol = 5, byrow = FALSE)
RF_cols <- sapply(RF_segs, function(x) switch(x, H="gold",
R="slategray2", N="green",
L="yellow", O="darkgreen", "red"))
points(RF_x, RF_y, col = RF_cols, pch = 16, cex = 12)
text(RF_x, RF_y, RF_segs, cex = 2)](https://image.slidesharecdn.com/usingrforcustomersegmentation-161115133908/85/Using-R-for-customer-segmentation-38-320.jpg)


![Cdac -Project Presentation [Autosaved].pptx](https://cdn.slidesharecdn.com/ss_thumbnails/cdac-projectpresentationautosaved-231029063336-13e0f780-thumbnail.jpg?width=640&height=640&fit=bounds)


![Hernan Litvac - eCommerce Day Africa Blended [Professional] Experience 2023](https://cdn.slidesharecdn.com/ss_thumbnails/2023africazeropartydatahernanlitvacensubs-230921231034-6d643848-thumbnail.jpg?width=640&height=640&fit=bounds)


