This document provides an overview of data collection methods for research. It discusses:
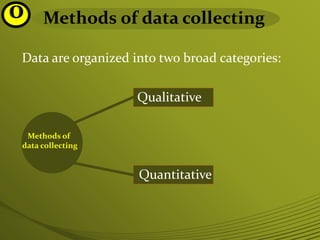
1) The importance of data collection as the process of gathering information to answer research questions. Both qualitative and quantitative methods are described.
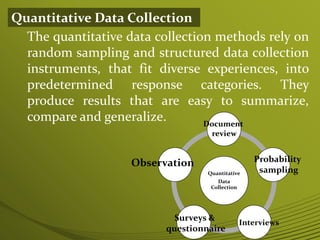
2) Common qualitative methods include interviews, observations, documents, and focus groups. Quantitative methods involve surveys, questionnaires, and probability sampling.
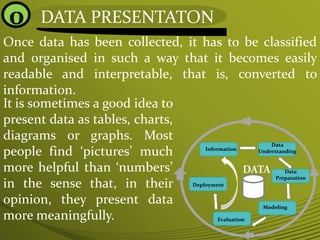
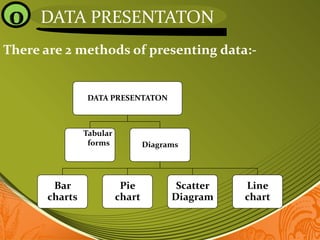
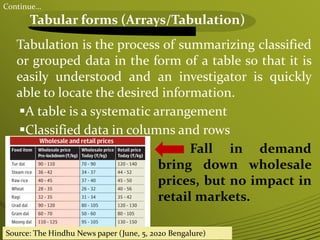
3) The document outlines different ways to present collected data, including tables, bar charts, pie charts, scatter plots, and line graphs. These visual representations make complex data easier to understand.
4) The final sections discuss how data science can help solve problems and briefly compare social science and science approaches to data collection.


![FBS 719 and FBS 819 BIOSTATISTICS [Autosaved].pptx](https://cdn.slidesharecdn.com/ss_thumbnails/fbs719andfbs819biostatisticsautosaved-240713084256-92f19157-thumbnail.jpg?width=640&height=640&fit=bounds)


