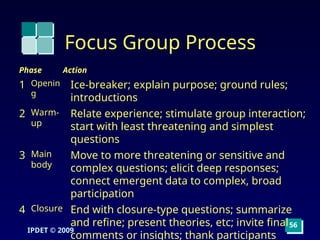
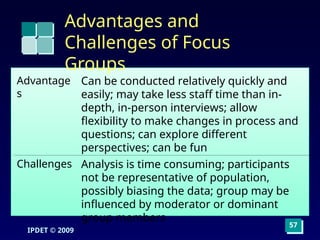
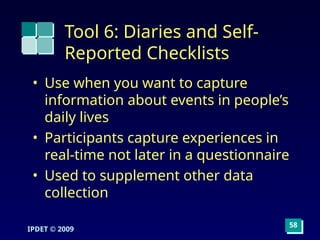
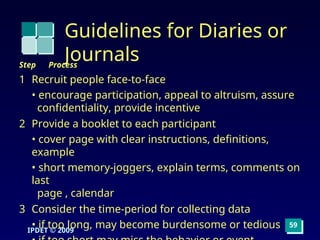
Lesson 1
Selecting andConstructing Data
Collection Instruments
Prepared By:
Engr. Jordan Ronquillo
1
2.
Grading System
Seatworks,
Homeworks etc– 10%
Quizzes – 30%
Attendance – 10%
Major Exams – 50%
_________________
Total – 100%
2
Passing – 50%
MIDTERM – 40%
FINALS – 60%
________________
Total – 100%
Grading System
Seatworks,
Homeworks etc – 10%
Quizzes – 30%
Attendance – 10%
Major Exams – 50%
_________________
Total – 100%
Passing – 50%
MIDTERM – 40%
FINALS – 60%
________________
Total – 100%
3.
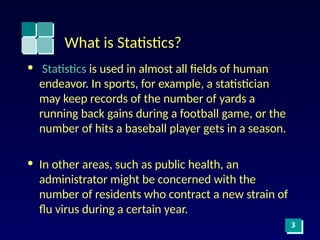
What is Statistics?
•Statistics is used in almost all fields of human
endeavor. In sports, for example, a statistician
may keep records of the number of yards a
running back gains during a football game, or the
number of hits a baseball player gets in a season.
• In other areas, such as public health, an
administrator might be concerned with the
number of residents who contract a new strain of
flu virus during a certain year.
3
4.
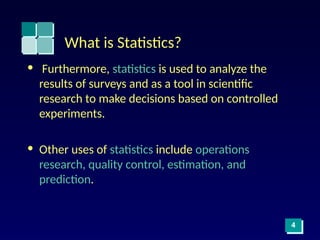
What is Statistics?
•Furthermore, statistics is used to analyze the
results of surveys and as a tool in scientific
research to make decisions based on controlled
experiments.
• Other uses of statistics include operations
research, quality control, estimation, and
prediction.
4
5.
What is Statistics?
•Statistics is the science of conducting
studies to collect, organize, summarize,
analyze, and draw conclusions from data.
• Statistics is derived from the Latin word
status, which is loosely defined as a
statesman.
5
6.
The following examplespresent some
statistics:
• Our country ranked second in the world with
the most diverse species of fishes.
• The Philippines is also a rich source of minerals. In
fact, 9 million hectares in our country contains
metallic and non-metallic ores.
• We also have 1,210 species of different plants; 477 of
which can be eaten, 627 can be used for medicine,
and 35 are considered fibre crops.
6
7.
The following examplespresent some
statistics:
• Over 13 million hectares of agricultural
land have been shrinking due to massive
land conversion and privatization.
• What’s worse is that more than 1 million
farmers are displaced every year causing
them to lose their only source of income
and pushing them to the brink of starvation.
7
8.
Aspects of Statistics
1.Theoretical or mathematical statistics
- deals with the development, derivation, and
proof of statistical theorems, formulas, rules,
and laws.
2. Applied statistics
- Involves the applications of those theorems,
formulas, rules, and laws to solve real-world
problems.
8
9.
Applied Statistics
1. DescriptiveStatistics
-consists of methods for organizing, displaying,
and describing data by using tables, graphs, and
summary measures.
2. Inferential Statistics
- consists of methods that use sample results to
help make decisions or predictions about a
population.
9
10.
10
Introduction
• Data CollectionStrategies
• Characteristics of Good Measures
• Quantitative and Qualitative Data
• Tools for Collecting Data
11.
11
Data Collection
Strategies
• bestway: decision depends on:
– What you need to know: numbers or stories
– Where the data reside: environment, files,
people
– Resources and time available
– Complexity of the data to be collected
– Frequency of data collection
– Intended forms of data analysis
12.
12
Rules for CollectingData
• Use multiple data collection methods
• Use available data, but need to know
– how the measures were defined
– how the data were collected and cleaned
– the extent of missing data
– how accuracy of the data was ensured
13.
13
Rules for CollectingData
• If must collect original data:
– be sensitive to burden on others
– pre-test, pre-test, pre-test
– establish procedures and follow them
(protocol)
– maintain accurate records of definitions and
coding
– verify accuracy of coding, data input
14.
14
Rules for CollectingData
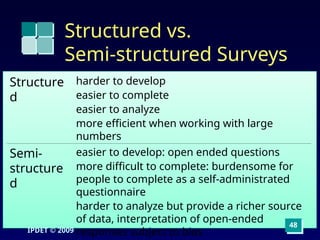
2 types of approach in collecting data
a). Structured Approach
b). Semi-Structured Approach
15.
15
Structured Approach
• Alldata collected in the same way
• Especially important for multi-site
and cluster evaluations so you can
compare
• Important when you need to make
comparisons with alternate
interventions
16.
16
Use Structured Approach
When:
•need to address extent questions
• have a large sample or population
• know what needs to be measured
• need to show results numerically
• need to make comparisons across
different sites or interventions
17.
17
Semi-structured
Approach
• Systematic andfollow general
procedures but data are not collected
in exactly the same way every time
• More open and fluid
• Does not follow a rigid script
– may ask for more detail
– people can tell what they want in their
own way
18.
18
Use Semi-structured
Approach when:
•conducting exploratory work
• seeking understanding, themes, and/or
issues
• need narratives or stories
• want in-depth, rich, “backstage”
information
• seek to understand results of data that
are unexpected
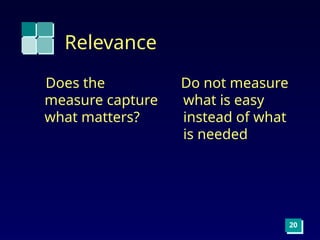
21
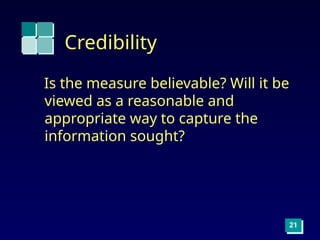
Credibility
Is the measurebelievable? Will it be
viewed as a reasonable and
appropriate way to capture the
information sought?
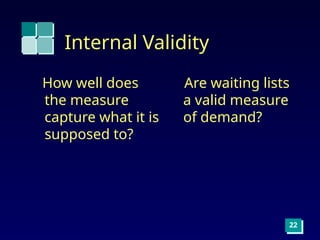
22.
Internal Validity
How welldoes
the measure
capture what it is
supposed to?
Are waiting lists
a valid measure
of demand?
22
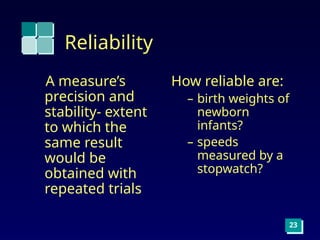
23.
Reliability
A measure’s
precision and
stability-extent
to which the
same result
would be
obtained with
repeated trials
How reliable are:
– birth weights of
newborn
infants?
– speeds
measured by a
stopwatch?
23
25
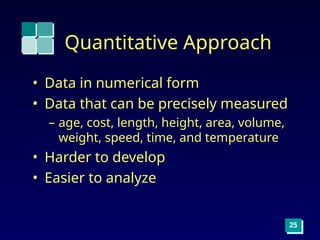
Quantitative Approach
• Datain numerical form
• Data that can be precisely measured
– age, cost, length, height, area, volume,
weight, speed, time, and temperature
• Harder to develop
• Easier to analyze
26.
26
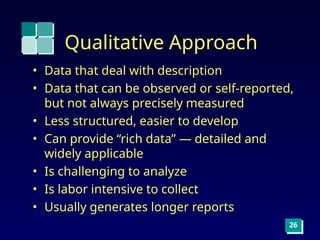
Qualitative Approach
• Datathat deal with description
• Data that can be observed or self-reported,
but not always precisely measured
• Less structured, easier to develop
• Can provide “rich data” — detailed and
widely applicable
• Is challenging to analyze
• Is labor intensive to collect
• Usually generates longer reports
27.
27
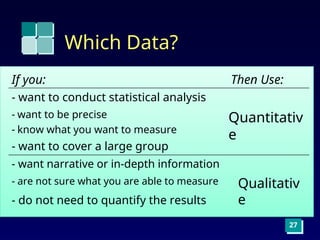
Which Data?
- donot need to quantify the results
- are not sure what you are able to measure Qualitativ
e
- want narrative or in-depth information
- want to cover a large group
- want to be precise
- know what you want to measure
Quantitativ
e
- want to conduct statistical analysis
Then Use:
If you:
28.
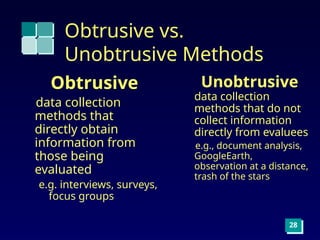
Obtrusive vs.
Unobtrusive Methods
Obtrusive
datacollection
methods that
directly obtain
information from
those being
evaluated
e.g. interviews, surveys,
focus groups
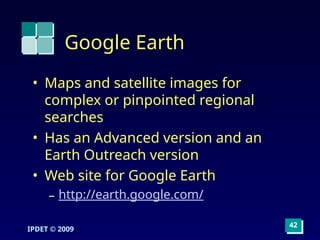
Unobtrusive
data collection
methods that do not
collect information
directly from evaluees
e.g., document analysis,
GoogleEarth,
observation at a distance,
trash of the stars
28
29.
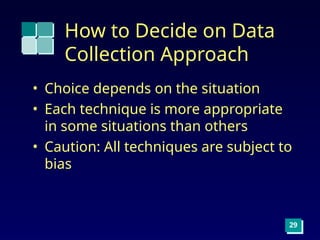
29
How to Decideon Data
Collection Approach
• Choice depends on the situation
• Each technique is more appropriate
in some situations than others
• Caution: All techniques are subject to
bias
30.
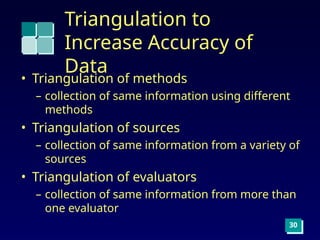
Triangulation to
Increase Accuracyof
Data
• Triangulation of methods
– collection of same information using different
methods
• Triangulation of sources
– collection of same information from a variety of
sources
• Triangulation of evaluators
– collection of same information from more than
one evaluator
30
31.
31
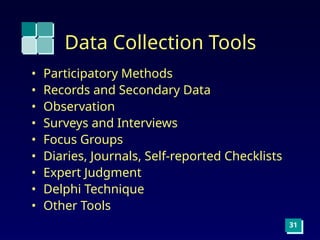
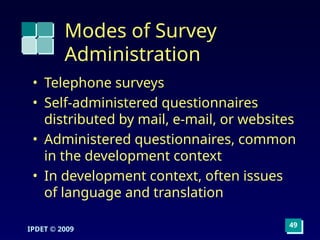
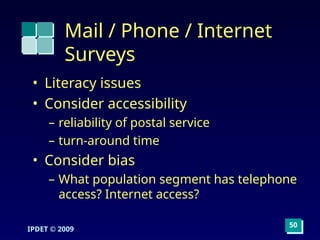
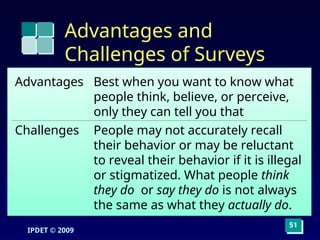
Data Collection Tools
•Participatory Methods
• Records and Secondary Data
• Observation
• Surveys and Interviews
• Focus Groups
• Diaries, Journals, Self-reported Checklists
• Expert Judgment
• Delphi Technique
• Other Tools
32.
32
Tool 1: Participatory
Methods
•Involve groups or communities
heavily in data collection
• Examples:
– community meetings
– mapping
– transect walks


![Hypotheses Testing stat [Autosaved].pptx](https://cdn.slidesharecdn.com/ss_thumbnails/hypothesestestingautosaved-241015205108-f0373f24-thumbnail.jpg?width=640&height=640&fit=bounds)


