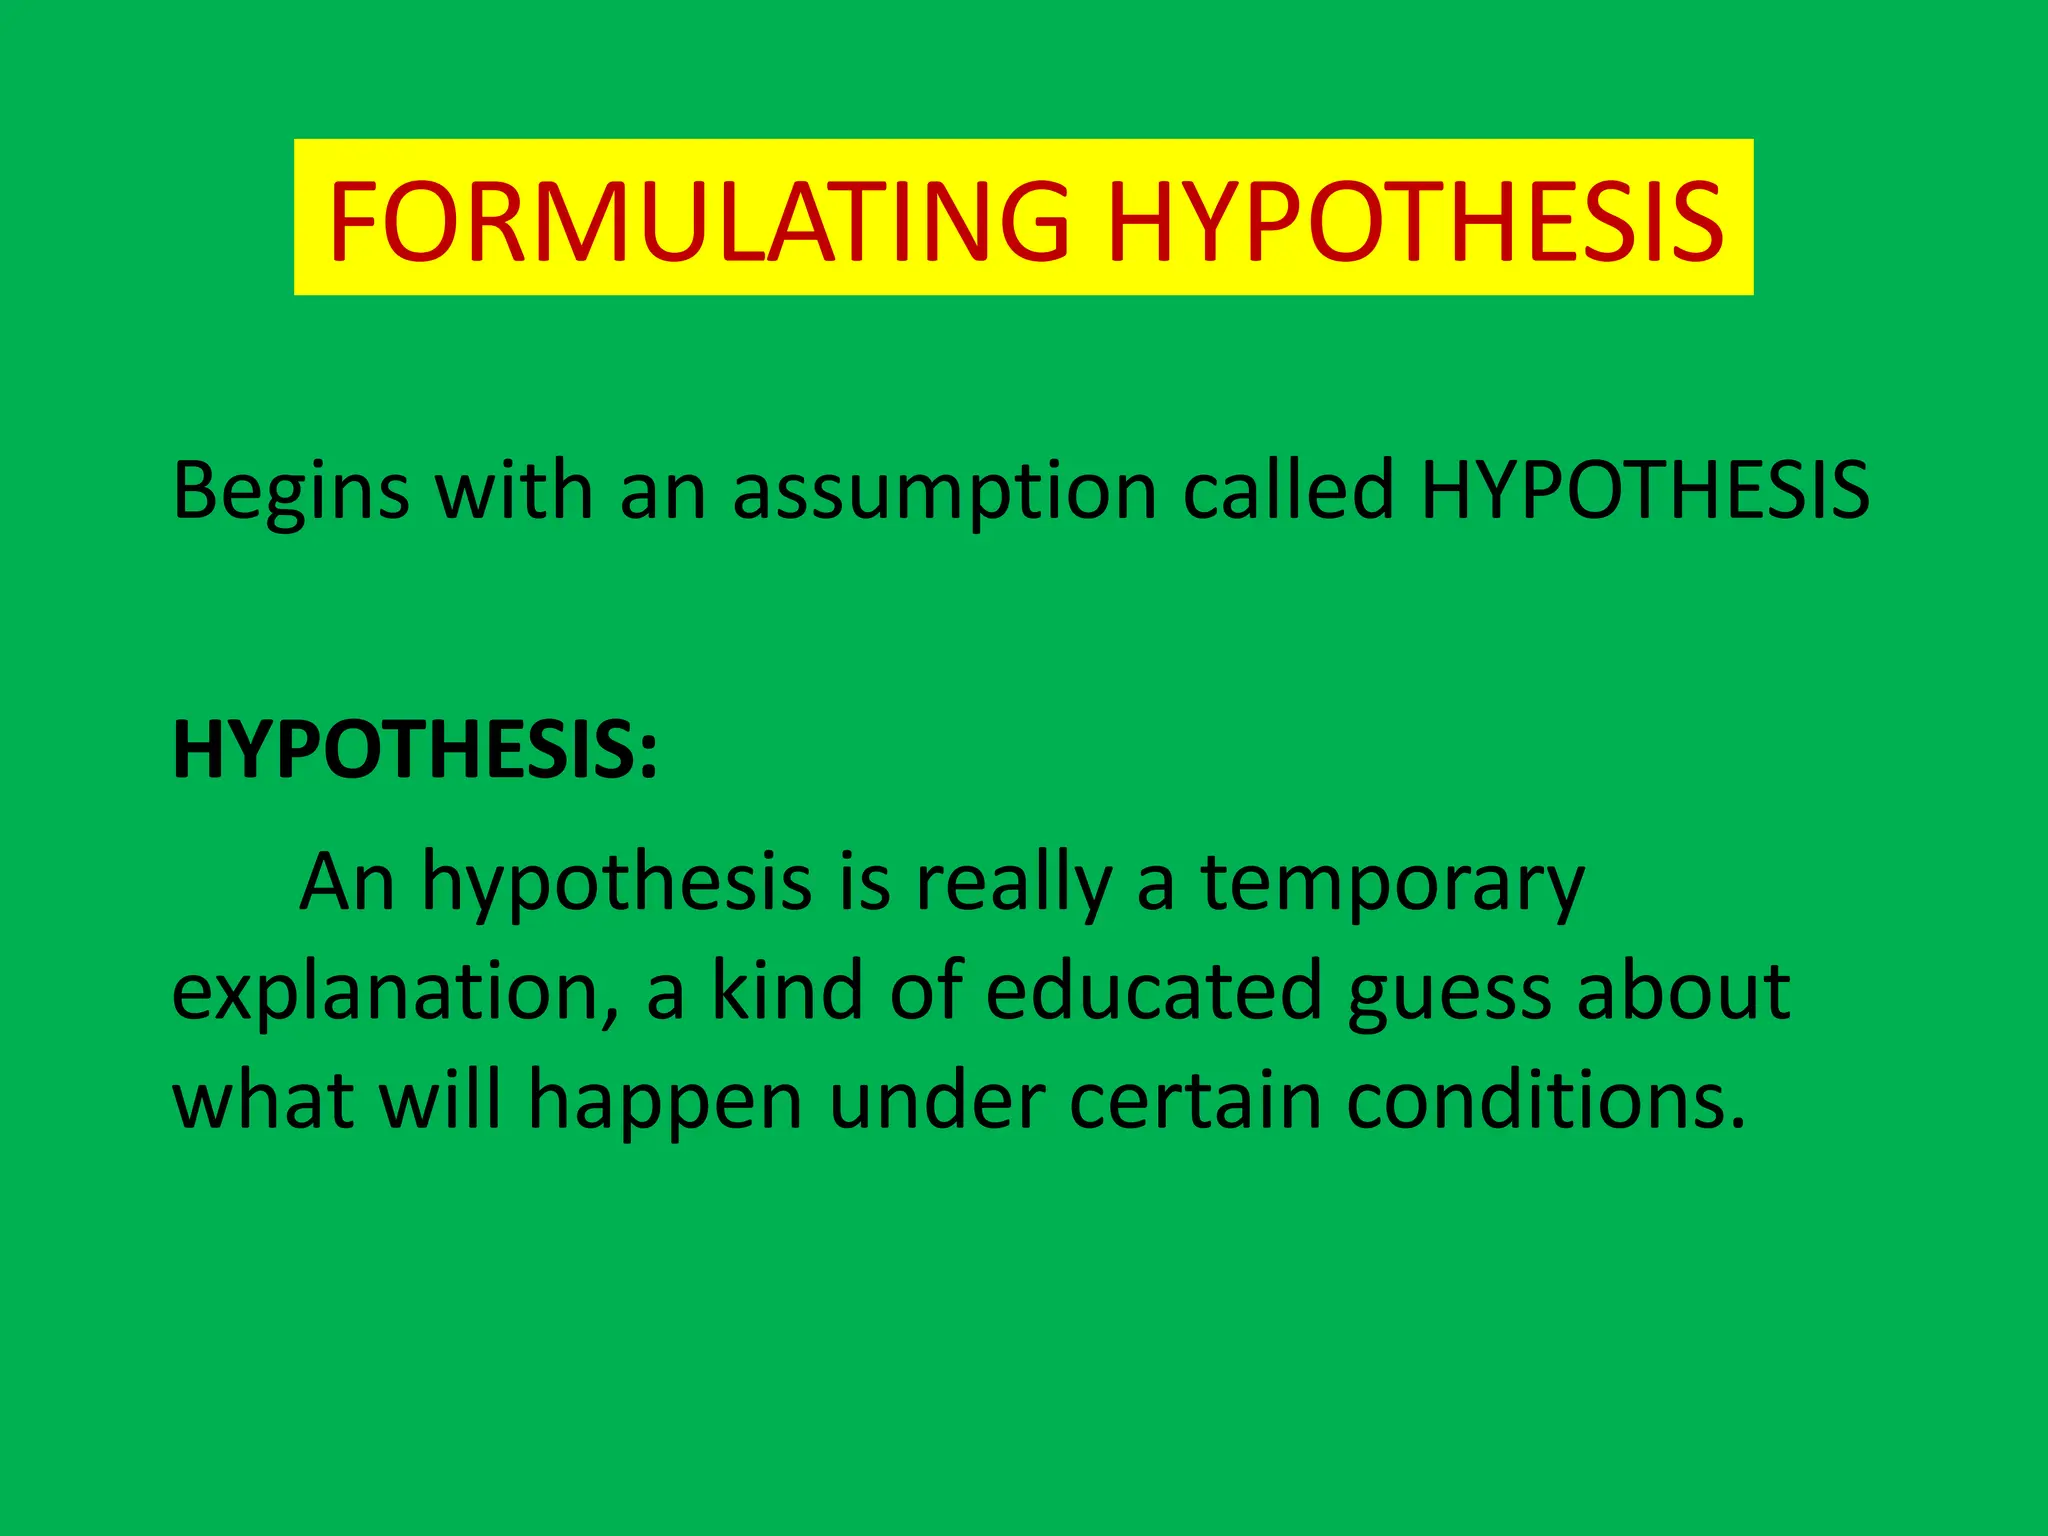
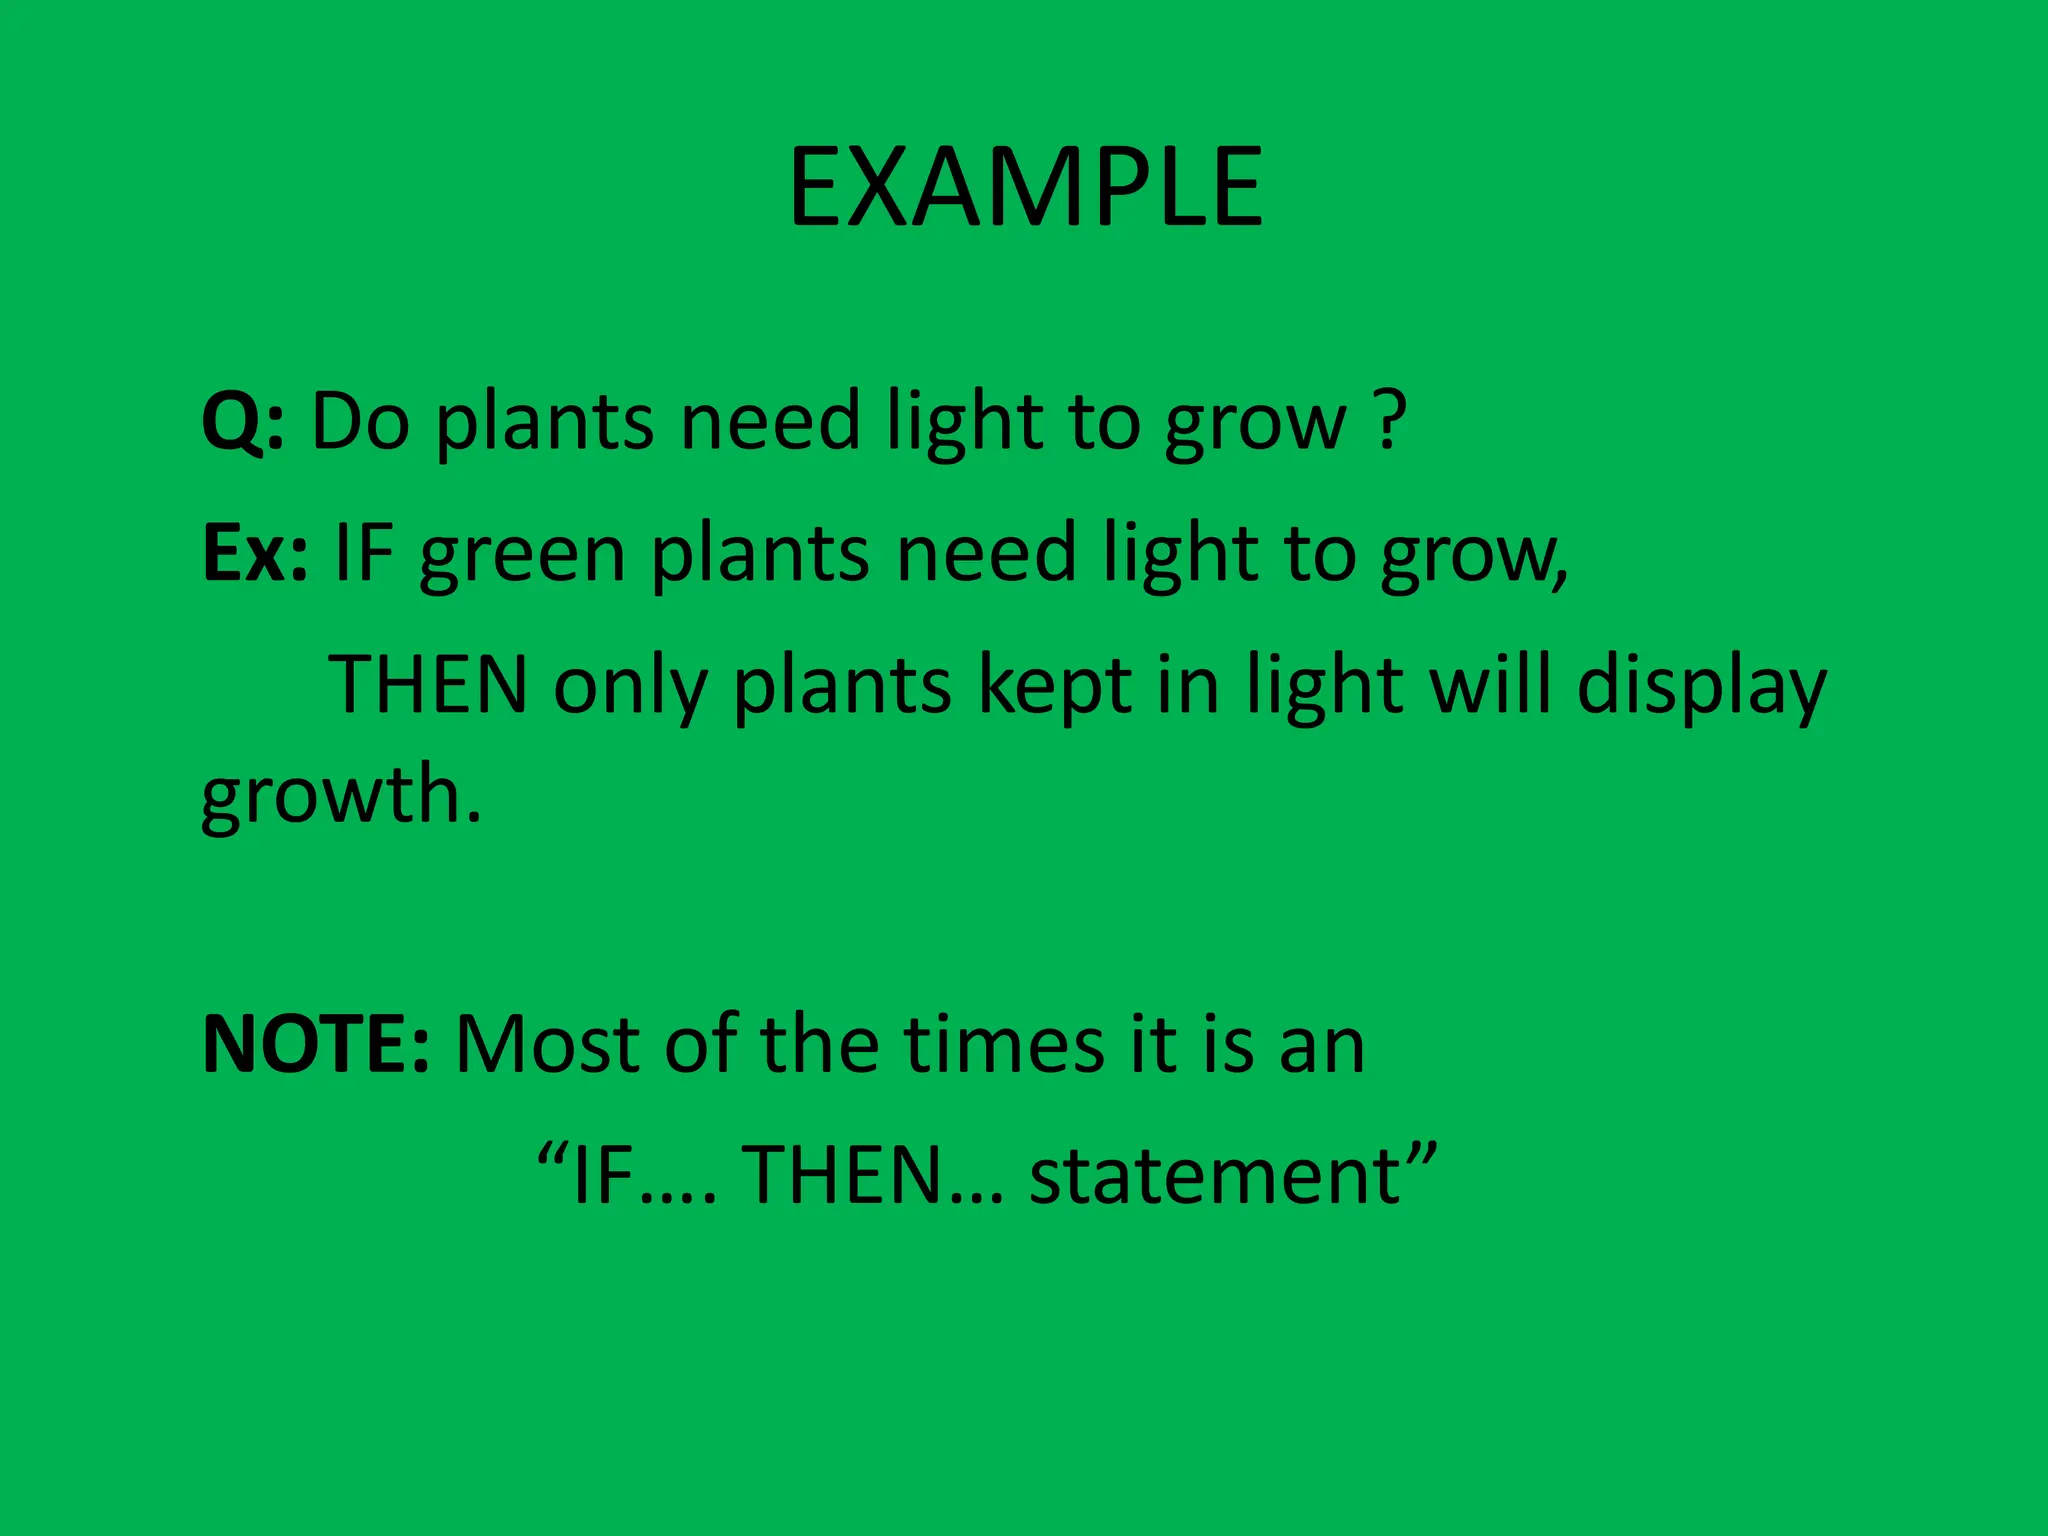
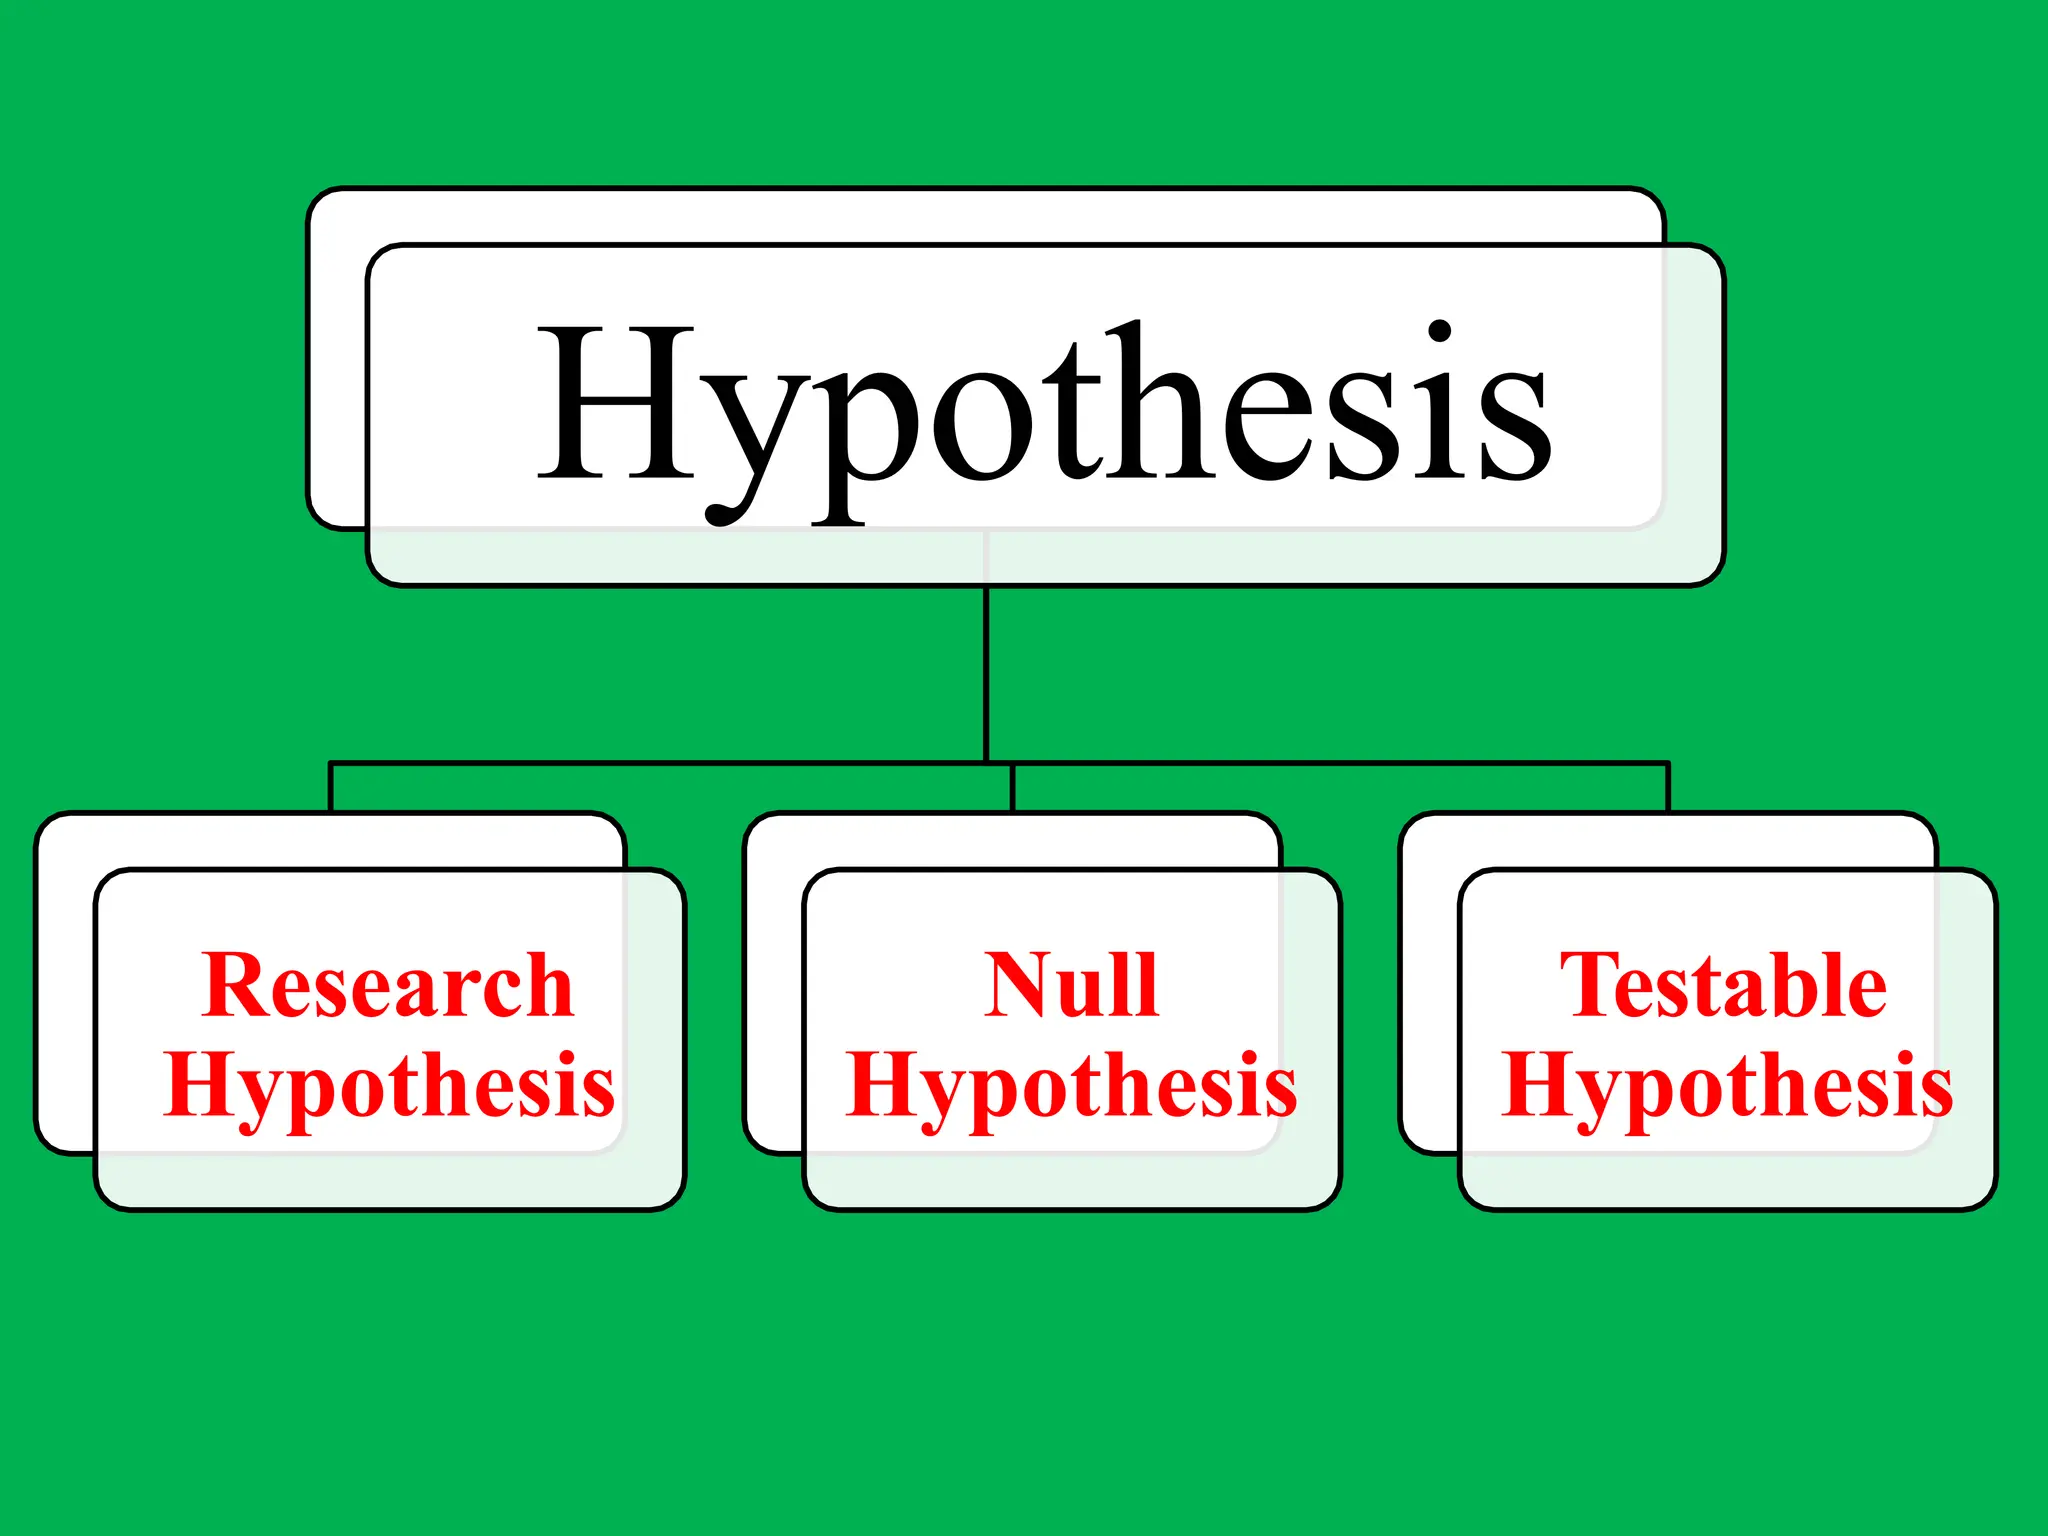
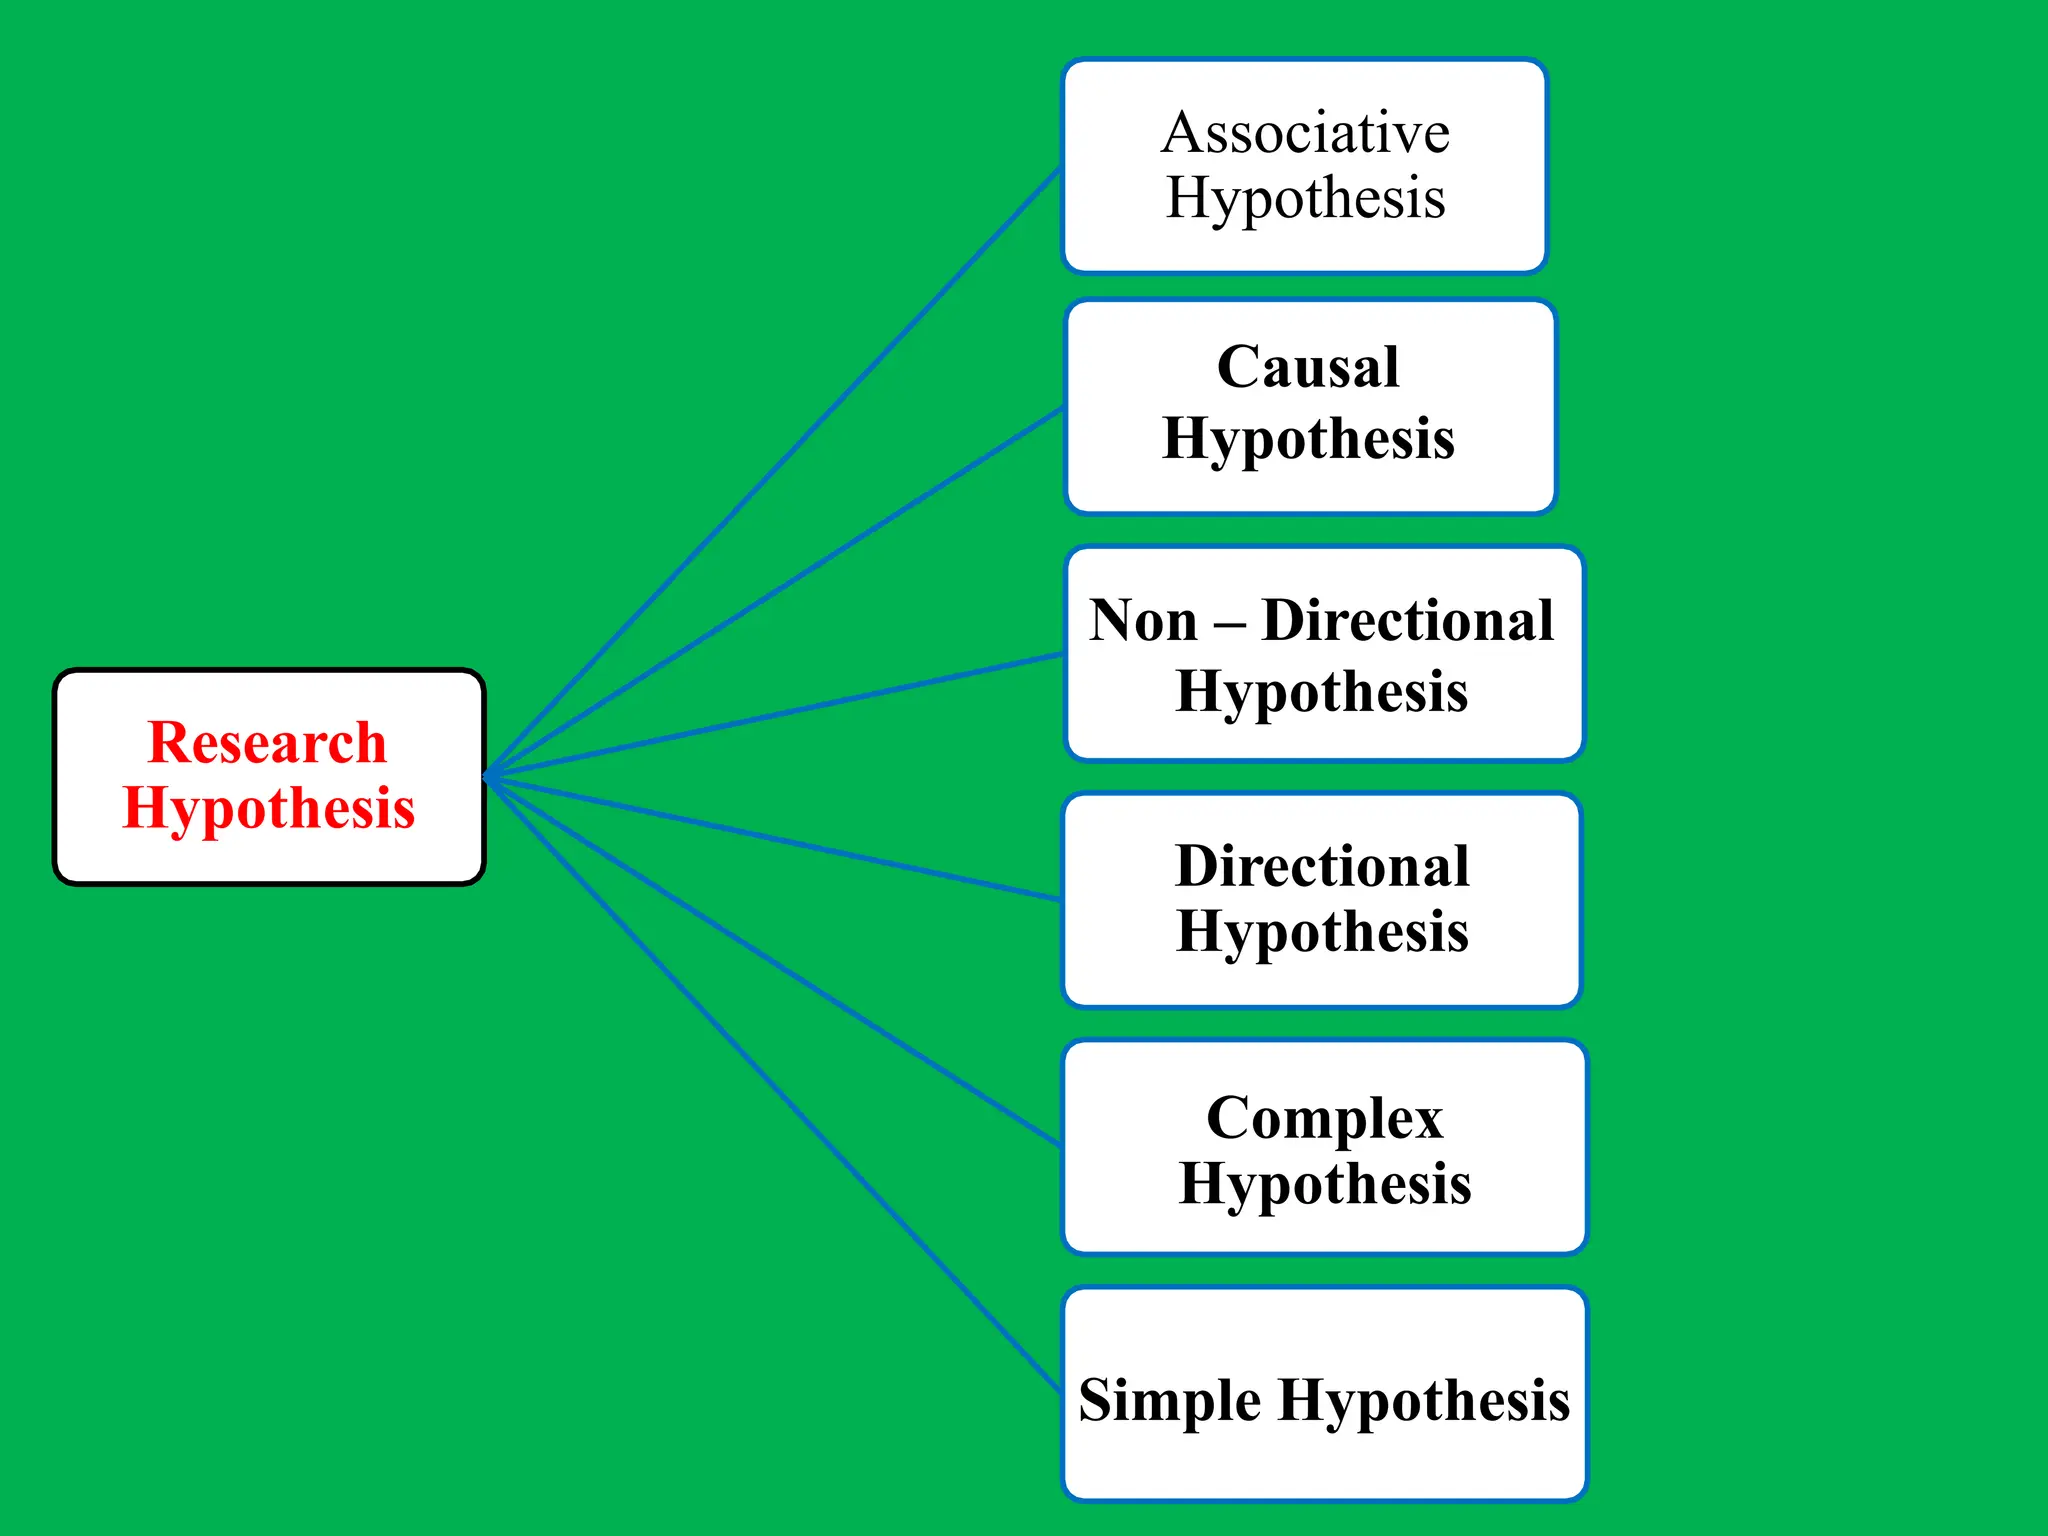
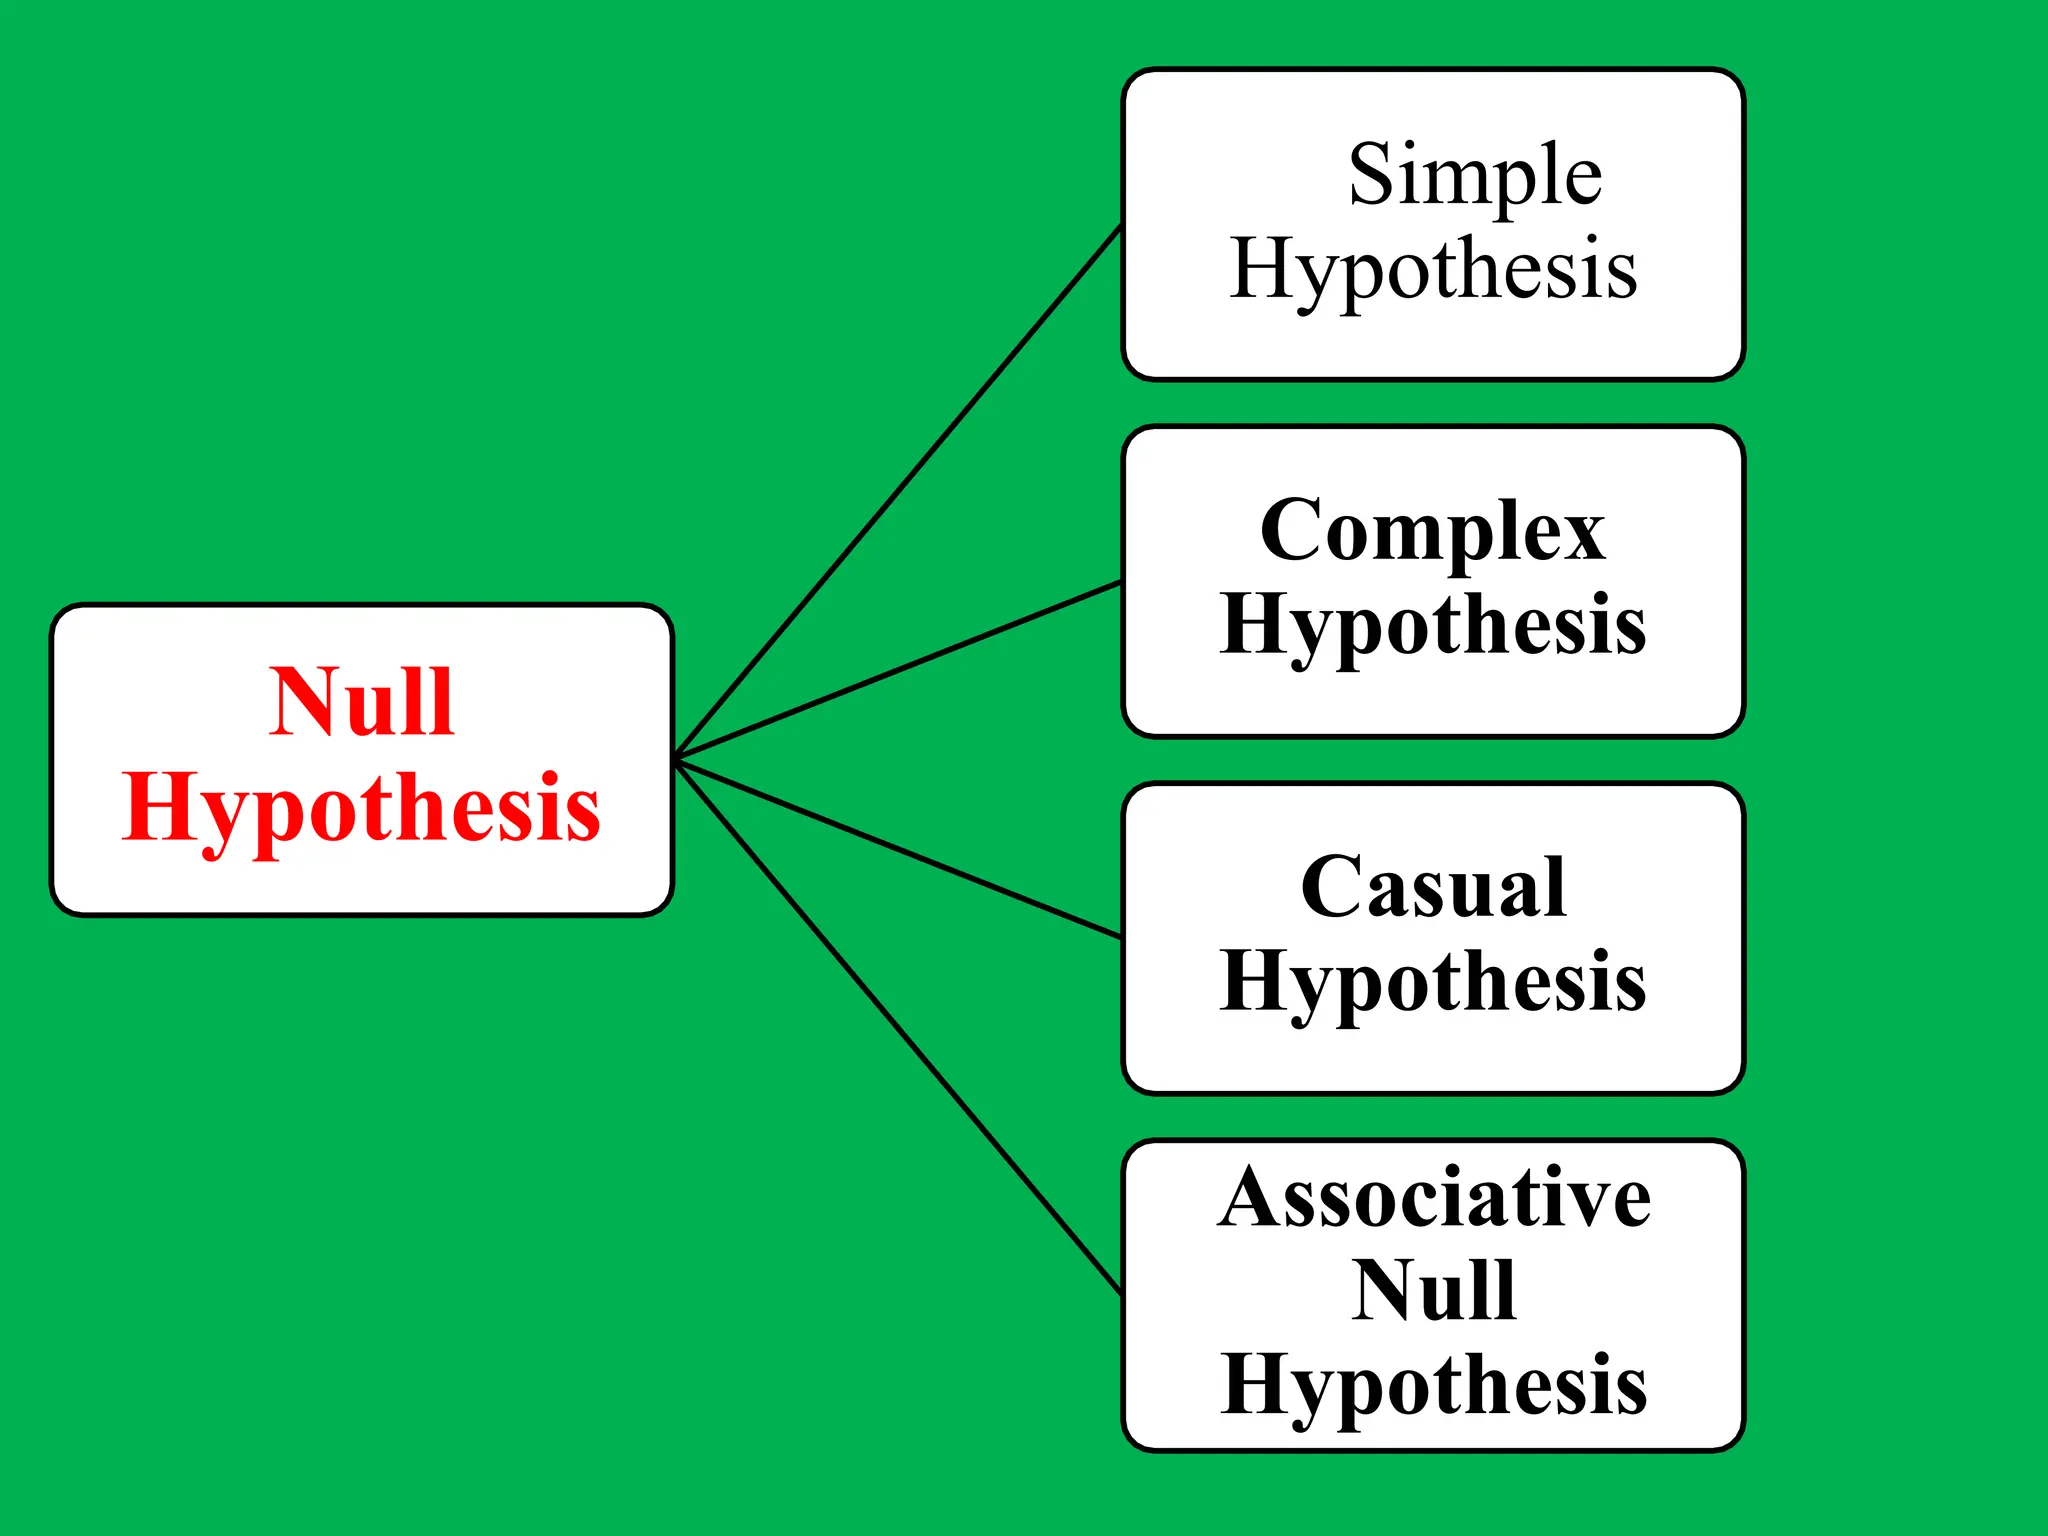
4. FORMULATING HYPOTHESIS
Begins with an assumption called HYPOTHESIS
HYPOTHESIS:
An hypothesis is really a temporary
explanation, a kind of educated guess about
what will happen under certain conditions.
5. EXAMPLE
Q: Do plants need light to grow ?
Ex: IF green plants need light to grow,
THEN only plants kept in light will display
growth.
NOTE: Most of the times it is an
“IF…. THEN… statement”
6. Take the following and make an hypothesis
• Do living things give off CO2 when they digest
food?
• A scientist think that living things give off
carbon dioxide as they break down food. He
predicts that carbon dioxide can be detected
as an organism digests food.
7. What is Hypothesis Testing
A set of logical and statistical guidelines
used to make decisions from sample statistics
to population characteristics.
8. Hypotheses Testing
The intent of hypothesis testing is to
formally examine two opposing
conjectures (hypotheses), H0 and HA/H1
These two hypotheses are mutually
exclusive and exhaustive.
Sample information is collected and
analysed.
9. Basic Concepts in Hypotheses Testing
• Null Hypotheses &Alternate Hypotheses
• Level of Significance
• Critical Region
• Decision Rule(Test of Hypothesis)
• Type I & Type II Errors
• Two Tailed & One Tailed Tests
• One Sample & Two Sample Tests
10. NULL HYPOTHESIS
• Specific statement about a population
parameter made for the purposes of
argument.
• It Is always about a population parameter, not
about a sample statistic.
11. Alternate Hypothesis
• Represents all other possible parameter
values except that stated in the null
hypothesis.
• Denoted by H1 / HA.
12. Level of Significance
• The critical probability in choosing between the
null & alternative hypotheses.
• The higher the significance level, the higher the
probability of rejecting a null hypothesis when its
true.
• Confidence level:
A percentage or decimal value that tells how
confident a researcher can be about being
correct.
13. Critical Region
• The Acceptance and Rejection region.
• If the value of mean falls within the rejection
region, the null hypothesis is rejected.
14. Decision Rule (Test of Hypothesis)
The rule according to which we accept or
reject null hypothesis.
15. Type I Error & Type II Error
• A Type I error is the mistake of rejecting the
null hypothesis when it is true.
• α- Type I error.
• A Type II error is the mistake of failing to reject
the null hypothesis when it is false.
• β- Type II error.
16. Type I Error & Type II Error
Accept H0 Reject H0
Ho (True)
Correct Decision Type I Error
Ho (False) Type II Error Correct Decision
17. Type I Error & Type II Error
Decision No disease Disease
Not diagnosed OK Type I error
Diagnosed Type II error OK
treated but not harmed
by the treatment
irreparable damage
would be done
18. One Tailed & Two Tailed Test
• Two-Tailed Tests
• If the null hypothesis is rejected for values of the
test statistic falling into either tail of its sampling
distribution.
• A deviation in either direction would reject the
null hypothesis
• Normally α is divided into α/2 on one side and
α/2 on the other.
20. One Tailed & Two Tailed Test
One-Tailed Tests
• If null hypothesis is rejected only for values of
the test statistic falling into one specified tail
of its sampling distribution.
24. One Sample & Two Sample Tests
• One Sample Test
When we want to draw inferences about the
population on the basis of given sample.
• Two Sample Test
When we want to compare and draw inferences
about 2 populations on the basis of given
samples.
25. Independent & Paired Samples
• Independent Samples
Drawn randomly from different populations.
• Paired Samples
When the data for the two samples relate to
the same group of respondents.
26. Types of Hypotheses
• Research hypotheses.
• Logical hypotheses.
– Null hypothesis (Ho).
– Alternative hypothesis (HA/H1).
• Statistical hypotheses.
28. Cont…
• It provides clarity to the research problem and
research objectives
• It describes, explains or predicts the expected
results or outcome of the research.
• It indicates the type of research design.
• It directs the research study process.
29. Cont…
• It identifies the population of the research study
that is to be investigated or examined.
• It facilitates data collection, data analysis and
data interpretation
37. Cont…simple hypothesis
• Example- two session (Plyometric)/day
increase the playing (Jumping) performance.
– In the above example, 2 session/day Plyometric is
independent variable and Jumping is dependent
variable. The statement shows that there exists a
relationship between 2 session Plyometric and
playing (Jumping) performance.
38. Complex Hypothesis
• Complex hypothesis predicts that
there exists relationship between two
or more independent and dependent
variable.
39. Cont…Complex Hypothesis
• Example – To make developed world cup
athlete.
– In the above example, three independent variable
are:-A) Types of Training B) Nutrition, C) Body
type.
– And three dependent variable are:- a) Speed
B) strength C) Power
40. Directional Hypothesis
• Directional Hypothesis predicts the direction of
the relationship between the independent and
dependent variable.
• Example- High quality of nursing education will
lead to high quality of nursing practice skills.
41. Non directional Hypothesis
• Non -directional Hypothesis predicts the
relationship between the independent variable and
the dependent variable but does not specific the
directional of the relationship.
• Example- teacher student relationship influence
student’s learning.
42. Causal Hypothesis
• Causal Hypothesis predicts a cause and effects
relationship or interaction between the
independent variable and dependent variable.
This hypothesis predicts the effect of the
independent variable on the dependent
variable.
43. Cont…
• In this the independent variable is the experimental
or treatment variable. The dependent variable is the
outcome variable.
• Example – early postoperative ambulation will
lead to prompt recovery.
44. Associative hypothesis
• Associative Hypothesis predicts an associative
relationship between the independent variable
and the dependent variable.
• When there is a change in any one of the
variables, changes also occurs in the other
variable.
45. Cont…
• The associative relationship between the
independent and dependent variables may have
either.
– Positive association
– Negative association
47. Cont…
• Null Hypothesis is also called statistical
hypothesis because this type of hypothesis is used
for statistical testing and statically interpretation.
The null hypothesis predicts that, there is no
relationship between the independent variable and
dependent variable.
49. Testable Hypothesis
• The testable hypothesis predicts relationship
between the independent variable and the
dependent variable and theses variable are
testable or measurable.
50. Cont…
• Example – Increase in patient’s body
temperature causes increase in patient’s
pulse rate.