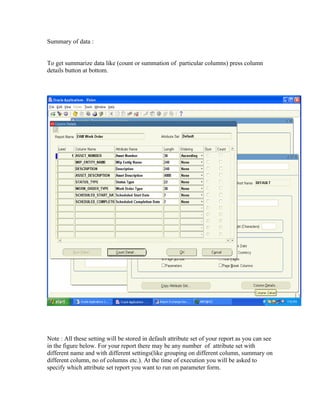
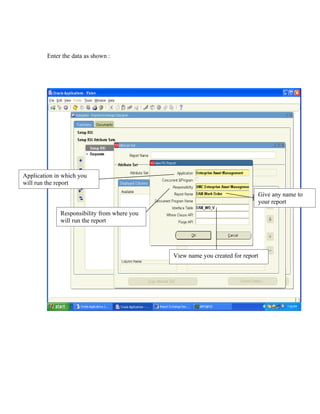
This document provides instructions for creating reports using the Report eXchange Designer (RX) module in Oracle Applications. It outlines the key steps as: 1) Creating a view with relevant data including a REQUEST_ID column; 2) Creating the RX report by selecting attributes like the application, view, columns, grouping, and summaries; and 3) Creating a concurrent program using the FARXPBSH executable and parameters like the report ID, attribute set, and output format to run the report. The instructions provide details on settings for each step to design customized reports through RX without using the Oracle Report Builder.
The "What If Analysis" functionality in Excel finds the best possible scenario based on available data points. Use it to find the best price to optimise revenue and profit.
Excel tips: How to use Conditional Formatting TablesStefania Borchia
In this presentation, I will show you how to create a table in Excel using the Conditional Formatting option and how to take advantage of their default functionalities.
This is a quick start guide to Power BI. Stay tuned for my next Power BI guide which will include advanced techniques in using this extremely popular data program.
Pivot Tables and Beyond Data Analysis in Excel 2013 - Course Technology Compu...Cengage Learning
Pivot Tables and Beyond Data Analysis in Excel 2013 - Course Technology Computing Conference
Presenter: Patrick Carey, Cengage Learning Author
Excel is sometimes called the most popular "database" in the world, not because it's a database but because it makes data so accessible that users often turn to spreadsheets for data entry. Yet for all that, Excel's tools for data analysis and modeling remain largely untapped by the average user. In this, pivot tables may be the most powerful and least utilized tool for data exploration. In this presentation we'll examine some of the new enhancements to pivot tables introduced in Excel 2013. We'll examine how to set up relationships using the Excel Data Model to summarize information across multiple data tables. And then we'll go beyond, exploring the data modeling and data visualizing tools provided by the PowerPivot and Power View add-ins, interpreting data not just numerically but through visual imagery, charts, and interactive maps.
The Ultimate Guide to Ad5 e808 adobe audience manager business practitioner e...PennyJose1
Please follow the below link to get this ultimate guide -
https://bit.ly/2Zv7LXG
AD5-E808 Adobe Audience Manager Business Practitioner Expert Certification Exam provides you with the necessary skills and knowledge to create, execute, and optimize multichannel marketing campaigns that integrate Adobe Experience Manager, Adobe Campaign, and Adobe Target. The exam assesses your proficiency in administering, deploying, and supporting multichannel marketing. Scale your capabilities as a digital marketer by proving you have the skills to streamline processes and drive accurate audience data analytics throughout the customer lifecycle.
Presentation is about advance excel advance feature PIVOT Table and contains steps to insert pivot table and some useful features of pivot table in case of large amount of data
The pivot tables are not created mechanically. In Microsoft excel the user should select the data first for which the pivot table should be created. The pivot table option is available on the insert tab. The user has the option of inserting the pivot table either in the existing sheet or creating the pivot table in the new sheet. Copy the link given below and paste it in new browser window to get more information on Pivot Table:- http://www.transtutors.com/homework-help/statistics/pivot-table.aspx
This is an instructional powerpoint is provided by Dydacomp on the use of Multichannel Order Manager (M.O.M. 7i) Report Builder Module. It is useful in providing tips on how to install, setup the Report Builder and create reports with the Report Builder.
India Orthopedic Devices Market: Unlocking Growth Secrets, Trends and Develop...Kumar Satyam
According to TechSci Research report, “India Orthopedic Devices Market -Industry Size, Share, Trends, Competition Forecast & Opportunities, 2030”, the India Orthopedic Devices Market stood at USD 1,280.54 Million in 2024 and is anticipated to grow with a CAGR of 7.84% in the forecast period, 2026-2030F. The India Orthopedic Devices Market is being driven by several factors. The most prominent ones include an increase in the elderly population, who are more prone to orthopedic conditions such as osteoporosis and arthritis. Moreover, the rise in sports injuries and road accidents are also contributing to the demand for orthopedic devices. Advances in technology and the introduction of innovative implants and prosthetics have further propelled the market growth. Additionally, government initiatives aimed at improving healthcare infrastructure and the increasing prevalence of lifestyle diseases have led to an upward trend in orthopedic surgeries, thereby fueling the market demand for these devices.
What is the TDS Return Filing Due Date for FY 2024-25.pdfseoforlegalpillers
It is crucial for the taxpayers to understand about the TDS Return Filing Due Date, so that they can fulfill your TDS obligations efficiently. Taxpayers can avoid penalties by sticking to the deadlines and by accurate filing of TDS. Timely filing of TDS will make sure about the availability of tax credits. You can also seek the professional guidance of experts like Legal Pillers for timely filing of the TDS Return.
Buy Verified PayPal Account | Buy Google 5 Star Reviewsusawebmarket
Buy Verified PayPal Account
Looking to buy verified PayPal accounts? Discover 7 expert tips for safely purchasing a verified PayPal account in 2024. Ensure security and reliability for your transactions.
PayPal Services Features-
🟢 Email Access
🟢 Bank Added
🟢 Card Verified
🟢 Full SSN Provided
🟢 Phone Number Access
🟢 Driving License Copy
🟢 Fasted Delivery
Client Satisfaction is Our First priority. Our services is very appropriate to buy. We assume that the first-rate way to purchase our offerings is to order on the website. If you have any worry in our cooperation usually You can order us on Skype or Telegram.
24/7 Hours Reply/Please Contact
usawebmarketEmail: support@usawebmarket.com
Skype: usawebmarket
Telegram: @usawebmarket
WhatsApp: +1(218) 203-5951
USA WEB MARKET is the Best Verified PayPal, Payoneer, Cash App, Skrill, Neteller, Stripe Account and SEO, SMM Service provider.100%Satisfection granted.100% replacement Granted.
Putting the SPARK into Virtual Training.pptxCynthia Clay
This 60-minute webinar, sponsored by Adobe, was delivered for the Training Mag Network. It explored the five elements of SPARK: Storytelling, Purpose, Action, Relationships, and Kudos. Knowing how to tell a well-structured story is key to building long-term memory. Stating a clear purpose that doesn't take away from the discovery learning process is critical. Ensuring that people move from theory to practical application is imperative. Creating strong social learning is the key to commitment and engagement. Validating and affirming participants' comments is the way to create a positive learning environment.
Accpac to QuickBooks Conversion Navigating the Transition with Online Account...PaulBryant58
This article provides a comprehensive guide on how to
effectively manage the convert Accpac to QuickBooks , with a particular focus on utilizing online accounting services to streamline the process.
"𝑩𝑬𝑮𝑼𝑵 𝑾𝑰𝑻𝑯 𝑻𝑱 𝑰𝑺 𝑯𝑨𝑳𝑭 𝑫𝑶𝑵𝑬"
𝐓𝐉 𝐂𝐨𝐦𝐬 (𝐓𝐉 𝐂𝐨𝐦𝐦𝐮𝐧𝐢𝐜𝐚𝐭𝐢𝐨𝐧𝐬) is a professional event agency that includes experts in the event-organizing market in Vietnam, Korea, and ASEAN countries. We provide unlimited types of events from Music concerts, Fan meetings, and Culture festivals to Corporate events, Internal company events, Golf tournaments, MICE events, and Exhibitions.
𝐓𝐉 𝐂𝐨𝐦𝐬 provides unlimited package services including such as Event organizing, Event planning, Event production, Manpower, PR marketing, Design 2D/3D, VIP protocols, Interpreter agency, etc.
Sports events - Golf competitions/billiards competitions/company sports events: dynamic and challenging
⭐ 𝐅𝐞𝐚𝐭𝐮𝐫𝐞𝐝 𝐩𝐫𝐨𝐣𝐞𝐜𝐭𝐬:
➢ 2024 BAEKHYUN [Lonsdaleite] IN HO CHI MINH
➢ SUPER JUNIOR-L.S.S. THE SHOW : Th3ee Guys in HO CHI MINH
➢FreenBecky 1st Fan Meeting in Vietnam
➢CHILDREN ART EXHIBITION 2024: BEYOND BARRIERS
➢ WOW K-Music Festival 2023
➢ Winner [CROSS] Tour in HCM
➢ Super Show 9 in HCM with Super Junior
➢ HCMC - Gyeongsangbuk-do Culture and Tourism Festival
➢ Korean Vietnam Partnership - Fair with LG
➢ Korean President visits Samsung Electronics R&D Center
➢ Vietnam Food Expo with Lotte Wellfood
"𝐄𝐯𝐞𝐫𝐲 𝐞𝐯𝐞𝐧𝐭 𝐢𝐬 𝐚 𝐬𝐭𝐨𝐫𝐲, 𝐚 𝐬𝐩𝐞𝐜𝐢𝐚𝐥 𝐣𝐨𝐮𝐫𝐧𝐞𝐲. 𝐖𝐞 𝐚𝐥𝐰𝐚𝐲𝐬 𝐛𝐞𝐥𝐢𝐞𝐯𝐞 𝐭𝐡𝐚𝐭 𝐬𝐡𝐨𝐫𝐭𝐥𝐲 𝐲𝐨𝐮 𝐰𝐢𝐥𝐥 𝐛𝐞 𝐚 𝐩𝐚𝐫𝐭 𝐨𝐟 𝐨𝐮𝐫 𝐬𝐭𝐨𝐫𝐢𝐞𝐬."
Attending a job Interview for B1 and B2 Englsih learnersErika906060
It is a sample of an interview for a business english class for pre-intermediate and intermediate english students with emphasis on the speking ability.
Unveiling the Secrets How Does Generative AI Work.pdfSam H
At its core, generative artificial intelligence relies on the concept of generative models, which serve as engines that churn out entirely new data resembling their training data. It is like a sculptor who has studied so many forms found in nature and then uses this knowledge to create sculptures from his imagination that have never been seen before anywhere else. If taken to cyberspace, gans work almost the same way.
Personal Brand Statement:
As an Army veteran dedicated to lifelong learning, I bring a disciplined, strategic mindset to my pursuits. I am constantly expanding my knowledge to innovate and lead effectively. My journey is driven by a commitment to excellence, and to make a meaningful impact in the world.
Remote sensing and monitoring are changing the mining industry for the better. These are providing innovative solutions to long-standing challenges. Those related to exploration, extraction, and overall environmental management by mining technology companies Odisha. These technologies make use of satellite imaging, aerial photography and sensors to collect data that might be inaccessible or from hazardous locations. With the use of this technology, mining operations are becoming increasingly efficient. Let us gain more insight into the key aspects associated with remote sensing and monitoring when it comes to mining.
The world of search engine optimization (SEO) is buzzing with discussions after Google confirmed that around 2,500 leaked internal documents related to its Search feature are indeed authentic. The revelation has sparked significant concerns within the SEO community. The leaked documents were initially reported by SEO experts Rand Fishkin and Mike King, igniting widespread analysis and discourse. For More Info:- https://news.arihantwebtech.com/search-disrupted-googles-leaked-documents-rock-the-seo-world/
Search Disrupted Google’s Leaked Documents Rock the SEO World.pdf
Report exchange designer
1. Report Exchange Designer
Report eXchange Designer is one of the module of Oracle Applications Business Suite.
It provides generally used Fixed Asset reports that you can modify according to your
needs using some simple forms. These reports are run as a spawned process and not
designed in oracle report builder. It is generally recommended to not to design new
reports using RX but you can do so following some easy steps.
2. Steps of creating reports :
1. Creating View.
2. Creating Report
3. Creating Concurrent Program
1. Create a view with relevant data . This view should have its first column as
REQUEST_ID.
6. Enter the data as shown :
Application in which you
will run the report
Give any name to
your report
Responsibility from where you
will run the report
View name you created for report
8. Grouping of the data :
For grouping first select the column and then press + button (Increase Level) at right side.
9. Grouping Style :
You can group left or group above your data. For that change tab to Page Setup.
On this tab you can specify what information you want to display in your report heading.
10. Summary of data :
To get summarize data like (count or summation of particular columns) press column
details button at bottom.
Note : All these setting will be stored in default attribute set of your report as you can see
in the figure below. For your report there may be any number of attribute set with
different name and with different settings(like grouping on different column, summary on
different column, no of columns etc.). At the time of execution you will be asked to
specify which attribute set report you want to run on parameter form.
11. To copy one attribute set press Copy Attribute Set Button at bottom :
12. After copying you can modify new attribute set (like grouping, summary etc.)
In above screen you are now grouping on Work Order Type instead of Asset Number and
removed 2 columns from the same report i.e. when you run report selecting default
attribute set these 2 columns will be shown on report but not with sandeep_set.
Save all your work . you are done with report creation.
13. Find report id for this report.
Goto Help->Diagnistic->Examine
Select Reports Block and then find Report_Id field :
In above screen report id is 100183 . Note it down you will enter it in your concurrent
program parameter.
14. 3. Create a concurrent program .
Executable : FARXPBSH.
You don’t need to create or change the executable always use FARXPBSH.
Screen below is just for your reference
This executable publish seeded reports and reports developed by you.
It is a spawned process which is C or Pro*C program.
For all the reports use this executable.
16. Program Parameters :
Create following 4 compulsory parameters and enter the data as shown in following
screens :
17. Enter report id that we got at the time of report creation. --- 100183 in this case.
Confirm that display checkbox is unchecked for report_id parameter.
18. Here we specified DEFAULT as default value for Attribute Set.
At run time you can choose any attribute set you defined for this report.
19. Here we specified TEXT as default value for Output format.
At runtime you can choose other options i.e.
CSV – Comma Separated Values
HTML – HTML format
TEXT – Text Format
TAB - Tab Delimited
20. You can specify more parameters with these compulsory parameters.
Suppose you want to specify where clause for some column.
For ex : Asset Number should be in given range .
For this kind of parameter you need to specify relational operator with parameter name
surrounded by “[“ & “]”.
For Ex :
[ASSET_NUMBER>=]
[ASSET_NUMBER<=]
[ASSET_NUMBER=]
[ASSET_NUMBER IS LIKE ]
21. Now you are done with program creation.
Assign this program to appropriate request group of your application .
Now navigate to correct responsibility (In our example DMC Enterprise Asset
Management) and submit the request