Power BI desktop helps import data, transform data, visualize the data, and create reports, and these reports you can share with other people in your organization. Here are the steps to create a report in Power BI Desktop.
Power BI is a business analytics service provided by Microsoft that offers interactive visualizations and self-service business intelligence capabilities. It helps users connect to various data sources to build visualizations and explore data to generate insights without depending on IT staff. Gartner recognized Microsoft as a leader in analytics and business intelligence platforms due to Power BI's capabilities. Power BI transforms data into visualizations that improve business decision making. It offers tools like Power BI Desktop, Power BI Service, and mobile apps.
This document provides an overview of measures in Power BI Desktop and includes a tutorial for creating basic measures. It discusses automatic measures, creating measures using DAX functions, and common measure examples like sums, averages, and counts. The tutorial guides the reader through understanding measures and creating their own basic measures in the Power BI Desktop model.
This document provides an overview of Microsoft Power BI, including its history, key features, and capabilities. It describes how Power BI allows users to connect to various data sources, perform data transformation using Power Query, build interactive reports with Power View and Power Pivot, and create visualizations and dashboards to share insights. The document also discusses Power BI Desktop, the Power BI service, and how to publish reports and dashboards to the web for sharing.
Microsoft Power BI, the powerful analytics tool that has emerged as the leader in business analytics can be your career if you upskill yourself using Power BI Training in Chennai at Credo Systemz. Mainly, Our Power BI Certification Course in Chennai enables the aspirants to master this professional skill set from the basics under the guidance of our Business Intelligence Experts.
Power BI Interview Questions and Answers-Credo systemz.pdfnishajeni1
Microsoft Power BI, the powerful analytics tool that has emerged as the leader in business analytics can be your career if you upskill yourself using Power BI Training in Chennai at Credo Systemz. Mainly, Our Power BI Certification Course in Chennai enables the aspirants to master this professional skill set from the basics under the guidance of our Business Intelligence Experts.
What is Microsoft Power BI and what are its benefits. how we can Analyse data with the help of power BI. Power BI A Microsoft Business Intelligence and Data Analysis tool.
Power BI Interview Questions & Answers.docxnishajeni1
Power BI is a business analytics suite that allows users to connect to data sources, transform data, create visualizations and reports, and share insights. It consists of several components like Power Query for data transformation, Power Pivot for data modeling, and Power View for visualization. Power BI can be used to analyze sales, marketing, financial, supply chain, and other operational data to gain insights. It offers self-service BI capabilities and allows sharing reports through the Power BI service.
The document provides an overview of a Power BI training course. The course objectives include learning about connecting to data sources, transforming data, building data model relationships, using DAX functions to transform data, and creating visualizations. It discusses topics like importing data from CSV and Excel files into Power BI, using Power Query to transform data, establishing relationships between tables in the data model, using measures and columns with DAX, and building basic and dynamic visualizations. It also provides resources for sample data files and additional learning materials for the course.
There are five types of datasets in Power BI: connected data models, uploaded Power BI Desktop files, Excel/CSV files, push datasets, and streaming datasets. Datasets represent data ready for reporting and visualization. Power BI can connect to external hosted models like SQL Server Analysis Services. Dataflows allow users to organize, clean, and transform data from multiple sources into a unified data structure for building datasets and reports. Dataflows use an Azure Data Lake for data storage while datasets point to subsets of dataflow data for specific reports.
Power BI is a business analytics service by Microsoft that offers interactive visualizations and self-service business intelligence capabilities. It transforms data into visualizations that improve business decision making. Power BI offers different tools like Power BI Desktop, Power BI Service, and mobile apps. It also provides various licensing options like Power BI Pro and Power BI Premium. Before sharing reports, users can configure settings like featured reports, persistent filters, and cross filtering.
Power BI is a self-service business intelligence tool that allows users to analyze and visualize data. It consists of Power BI Desktop, the Power BI web service, and the Power BI mobile app. Power BI Desktop is used to build reports and dashboards locally, while the web service allows users to publish, share, and collaborate on reports and dashboards online. To create a dashboard in Power BI, a user would connect to a data source, build visualizations with the data, publish the report to the web, combine reports into a dashboard, and then share the dashboard.
Power BI is a collection of software services, apps, and connectors that work together to transform unrelated data sources into interactive visualizations and insights. It has 6 main components: Power Query for data transformation, Power Pivot for tabular data modeling, Power View for data visualization, Power Map for 3D geospatial visualization, Power Q&A for natural language questions, and Power BI Desktop for report development. Power BI can connect to various data sources and publish reports, dashboards, and datasets to the Power BI website for sharing and accessing on mobile devices. It provides an integrated solution for self-service business intelligence but has some limitations around customization, large datasets, and cross-domain sharing.
BI: new of the buzz words that everyone is talking about but what is it? How can it be used to make a impact in my organization? How do I get started? This session was delivered for SharePoint Saturday Reston.
How do you use Power BI to help you Analyze Data.pdfAlpha BOLD
Data is the lifeblood of businesses in today’s digital age. However, collecting and storing data alone isn’t enough. Without proper analysis, data is just a collection of numbers and figures. This is where Power BI comes in. Power BI is a powerful business analytics tool that helps businesses make sense of their data.
10 Features of Tableau to Smoothen your Data Visualization Tasks.pptxSudhanshiBakre1
Tableau is a popular business intelligence tool that makes data visualization easy through features like drag-and-drop functionality. It allows users to create dashboards and reports from various data sources and share them collaboratively. Key features include advanced visualizations, maps, mobile compatibility, predictive analysis capabilities, and natural language search of data through Ask Data. Tableau's wide range of features make it effective for extracting insights from complex data.
This document provides an overview of a training on Microsoft Power BI. It introduces Power BI as a business intelligence tool consisting of three core applications: connecting to data sources, data preparation and analysis, and visualization and collaboration. It outlines the key topics that will be covered in the training, including connecting and transforming data in Power BI Desktop, data modeling, analyzing data with DAX calculations, visualizing and formatting data, filters, and refreshing and scheduling reports in Power BI Service. The training will cover the components and building blocks of Power BI, how to use the Power BI Desktop interface, and include hands-on exercises for working with data, creating reports and dashboards, and publishing to Power BI Service.
How to Set Up Power BI Sales Dashboard.pdfKavika Roy
Learn how to set up Power BI Sales dashboard in just few steps. Transform the way you analyze and visualize your sales data.
Read the Full Article: https://www.datatobiz.com/blog/how-to-set-up-power-bi-sales-dashboard/
Power BI vs Tableau | Key features and Comparison 2022 Sparity1
We are the leading iT Software development company in USA. We are the leaders in providing the best Software, Ai Mi, Data science, Data security, QA, UI/UX, RPA, App development, Digital transformation, Cloud and Cyber security services.
What is the Best Data Visualization Tool: Power BI or Tableau?Digital Dialogue
Business Intelligence (BI) is a vital field of computer science that involves a range of processes and technologies aimed at gathering, storing, analyzing, and providing access to data to enhance business decision-making. Read more here!
Power BI is a business analytics tool used to analyze business data and derive insights, while Tableau is a business intelligence and data visualization tool used to generate flexible reports and visualizations. Tableau typically handles larger data volumes faster than Power BI and has a larger community/support network, but Power BI is easier for less technical users and integrates better with other Microsoft products. Both tools have cloud-based and on-premise deployment options, with Tableau supporting more platforms, while Power BI is limited to Azure in the cloud.
Power BI for Office 365 provides many new features enabling everyone new scenarios of putting in place business intelligence with Excel and Office 365. Discover, access and manipulate data with just a few clicks, shape and transform data. Analyze and create stunning interactive visualizations that uncover hidden insights to share and collaborate from anywhere, and soon on any device.
Top 60 Power BI Interview Questions and Answers for 2023.pdfDatacademy.ai
Description:-
Power BI is a business analytics service provided by Microsoft. It allows users to create reports and dashboards based on various data sources, such as Excel, databases, and online services. With Power BI, users can visualize and analyze their data, and share their insights with others in their organization. Power BI offers a range of features, including data modeling, data visualization, reporting, and collaboration. It is available as a standalone service, or as part of various Office 365 plans. Power BI is designed to be user-friendly, so that people with little or no technical expertise can use it to gain insights from their data.we are provide top 60 Power BI Interview Questions and Answers for 2023.
Visit by :-https://www.datacademy.ai/power-bi-interview-questions/
This document provides an overview of Power BI, including:
- Power BI is a business analytics tool from Microsoft that allows users to visualize, analyze, and share insights from data.
- It offers desktop, service, and mobile platforms. The desktop application allows local data preparation, while the service enables cloud-based sharing of reports and dashboards.
- The document walks through an example of connecting to sample GDP data, cleaning and preparing the data with Power Query, building visualizations with charts and maps, and publishing a report to the Power BI cloud service.
This document provides an overview of Power BI, including:
- What Power BI is and why it is used for data visualization and business intelligence.
- The key building blocks of Power BI like visualizations, reports, dashboards, and datasets.
- The different Power BI tools like Power BI Desktop, Power BI Service, and mobile apps.
- The advantages of Power BI like secure report publishing and no need for specialized technical support.
- The differences between Power BI reports and dashboards, where reports can have multiple pages and dashboards are limited to one page.
Transforming Data into Actionable Insights Advanced Modeling in Power BI .pdfComplere Infosystem
In today's data-based very competitive world, businesses are engaged in collecting data from multiple sources. This meaningful information improves your decision making and strategy. Power BI is a technologically dvanced business analytics tool by Microsoft. It offers powerful features to change raw data into meaningful information. In this content today we will discuss how advanced data modeling in Power BI can transform your data into actionable information. For more information visit: https://complereinfosystem.com/advanced-data-modeling-techniques-power-bi/
Master the Art of Data Visualizations with Credo Systemz (1).pdfcsvishnukumar
Microsoft Power BI, the powerful analytics tool that has emerged as the leader in business analytics can be your career if you upskill yourself using Power BI Training in Chennai at Credo Systemz. Mainly, Our Power BI Certification Course in Chennai enables the aspirants to master this professional skill set from the basics under the guidance of our Business Intelligence Experts.
Master the Art of Data Visualizations with Credo Systemz (1).pdfnishajeni1
Microsoft Power BI, the powerful analytics tool that has emerged as the leader in business analytics can be your career if you upskill yourself using Power BI Training in Chennai at Credo Systemz. Mainly, Our Power BI Certification Course in Chennai enables the aspirants to master this professional skill set from the basics under the guidance of our Business Intelligence Experts.
At Omnepresent Technologies, we champion the transformative power of no-code and low-code platforms, driving innovation and agility in application development. Embracing this revolution is key to staying competitive, enabling rapid adaptation to market dynamics and fostering collaborative development in the digital age.
Read more : https://omnepresent.com/low-code-no-code-services/
Discover the top 5 benefits of utilizing Low Code No Code (LCNC) platforms. OmnePresent Technologies empowers organizations to leverage these platforms for enhanced speed, agility, cost-efficiency, and accessibility. With our expertise, businesses can accelerate innovation, unleash workforce potential, and gain a competitive edge in the digital landscape. Thrive with LCNC solutions.
Read to know more : https://omnepresent.com/low-code-no-code-services/
More Related Content
Similar to How to Create a Report in Power BI Desktop.pdf
The document provides an overview of a Power BI training course. The course objectives include learning about connecting to data sources, transforming data, building data model relationships, using DAX functions to transform data, and creating visualizations. It discusses topics like importing data from CSV and Excel files into Power BI, using Power Query to transform data, establishing relationships between tables in the data model, using measures and columns with DAX, and building basic and dynamic visualizations. It also provides resources for sample data files and additional learning materials for the course.
There are five types of datasets in Power BI: connected data models, uploaded Power BI Desktop files, Excel/CSV files, push datasets, and streaming datasets. Datasets represent data ready for reporting and visualization. Power BI can connect to external hosted models like SQL Server Analysis Services. Dataflows allow users to organize, clean, and transform data from multiple sources into a unified data structure for building datasets and reports. Dataflows use an Azure Data Lake for data storage while datasets point to subsets of dataflow data for specific reports.
Power BI is a business analytics service by Microsoft that offers interactive visualizations and self-service business intelligence capabilities. It transforms data into visualizations that improve business decision making. Power BI offers different tools like Power BI Desktop, Power BI Service, and mobile apps. It also provides various licensing options like Power BI Pro and Power BI Premium. Before sharing reports, users can configure settings like featured reports, persistent filters, and cross filtering.
Power BI is a self-service business intelligence tool that allows users to analyze and visualize data. It consists of Power BI Desktop, the Power BI web service, and the Power BI mobile app. Power BI Desktop is used to build reports and dashboards locally, while the web service allows users to publish, share, and collaborate on reports and dashboards online. To create a dashboard in Power BI, a user would connect to a data source, build visualizations with the data, publish the report to the web, combine reports into a dashboard, and then share the dashboard.
Power BI is a collection of software services, apps, and connectors that work together to transform unrelated data sources into interactive visualizations and insights. It has 6 main components: Power Query for data transformation, Power Pivot for tabular data modeling, Power View for data visualization, Power Map for 3D geospatial visualization, Power Q&A for natural language questions, and Power BI Desktop for report development. Power BI can connect to various data sources and publish reports, dashboards, and datasets to the Power BI website for sharing and accessing on mobile devices. It provides an integrated solution for self-service business intelligence but has some limitations around customization, large datasets, and cross-domain sharing.
BI: new of the buzz words that everyone is talking about but what is it? How can it be used to make a impact in my organization? How do I get started? This session was delivered for SharePoint Saturday Reston.
How do you use Power BI to help you Analyze Data.pdfAlpha BOLD
Data is the lifeblood of businesses in today’s digital age. However, collecting and storing data alone isn’t enough. Without proper analysis, data is just a collection of numbers and figures. This is where Power BI comes in. Power BI is a powerful business analytics tool that helps businesses make sense of their data.
10 Features of Tableau to Smoothen your Data Visualization Tasks.pptxSudhanshiBakre1
Tableau is a popular business intelligence tool that makes data visualization easy through features like drag-and-drop functionality. It allows users to create dashboards and reports from various data sources and share them collaboratively. Key features include advanced visualizations, maps, mobile compatibility, predictive analysis capabilities, and natural language search of data through Ask Data. Tableau's wide range of features make it effective for extracting insights from complex data.
This document provides an overview of a training on Microsoft Power BI. It introduces Power BI as a business intelligence tool consisting of three core applications: connecting to data sources, data preparation and analysis, and visualization and collaboration. It outlines the key topics that will be covered in the training, including connecting and transforming data in Power BI Desktop, data modeling, analyzing data with DAX calculations, visualizing and formatting data, filters, and refreshing and scheduling reports in Power BI Service. The training will cover the components and building blocks of Power BI, how to use the Power BI Desktop interface, and include hands-on exercises for working with data, creating reports and dashboards, and publishing to Power BI Service.
How to Set Up Power BI Sales Dashboard.pdfKavika Roy
Learn how to set up Power BI Sales dashboard in just few steps. Transform the way you analyze and visualize your sales data.
Read the Full Article: https://www.datatobiz.com/blog/how-to-set-up-power-bi-sales-dashboard/
Power BI vs Tableau | Key features and Comparison 2022 Sparity1
We are the leading iT Software development company in USA. We are the leaders in providing the best Software, Ai Mi, Data science, Data security, QA, UI/UX, RPA, App development, Digital transformation, Cloud and Cyber security services.
What is the Best Data Visualization Tool: Power BI or Tableau?Digital Dialogue
Business Intelligence (BI) is a vital field of computer science that involves a range of processes and technologies aimed at gathering, storing, analyzing, and providing access to data to enhance business decision-making. Read more here!
Power BI is a business analytics tool used to analyze business data and derive insights, while Tableau is a business intelligence and data visualization tool used to generate flexible reports and visualizations. Tableau typically handles larger data volumes faster than Power BI and has a larger community/support network, but Power BI is easier for less technical users and integrates better with other Microsoft products. Both tools have cloud-based and on-premise deployment options, with Tableau supporting more platforms, while Power BI is limited to Azure in the cloud.
Power BI for Office 365 provides many new features enabling everyone new scenarios of putting in place business intelligence with Excel and Office 365. Discover, access and manipulate data with just a few clicks, shape and transform data. Analyze and create stunning interactive visualizations that uncover hidden insights to share and collaborate from anywhere, and soon on any device.
Top 60 Power BI Interview Questions and Answers for 2023.pdfDatacademy.ai
Description:-
Power BI is a business analytics service provided by Microsoft. It allows users to create reports and dashboards based on various data sources, such as Excel, databases, and online services. With Power BI, users can visualize and analyze their data, and share their insights with others in their organization. Power BI offers a range of features, including data modeling, data visualization, reporting, and collaboration. It is available as a standalone service, or as part of various Office 365 plans. Power BI is designed to be user-friendly, so that people with little or no technical expertise can use it to gain insights from their data.we are provide top 60 Power BI Interview Questions and Answers for 2023.
Visit by :-https://www.datacademy.ai/power-bi-interview-questions/
This document provides an overview of Power BI, including:
- Power BI is a business analytics tool from Microsoft that allows users to visualize, analyze, and share insights from data.
- It offers desktop, service, and mobile platforms. The desktop application allows local data preparation, while the service enables cloud-based sharing of reports and dashboards.
- The document walks through an example of connecting to sample GDP data, cleaning and preparing the data with Power Query, building visualizations with charts and maps, and publishing a report to the Power BI cloud service.
This document provides an overview of Power BI, including:
- What Power BI is and why it is used for data visualization and business intelligence.
- The key building blocks of Power BI like visualizations, reports, dashboards, and datasets.
- The different Power BI tools like Power BI Desktop, Power BI Service, and mobile apps.
- The advantages of Power BI like secure report publishing and no need for specialized technical support.
- The differences between Power BI reports and dashboards, where reports can have multiple pages and dashboards are limited to one page.
Transforming Data into Actionable Insights Advanced Modeling in Power BI .pdfComplere Infosystem
In today's data-based very competitive world, businesses are engaged in collecting data from multiple sources. This meaningful information improves your decision making and strategy. Power BI is a technologically dvanced business analytics tool by Microsoft. It offers powerful features to change raw data into meaningful information. In this content today we will discuss how advanced data modeling in Power BI can transform your data into actionable information. For more information visit: https://complereinfosystem.com/advanced-data-modeling-techniques-power-bi/
Master the Art of Data Visualizations with Credo Systemz (1).pdfcsvishnukumar
Microsoft Power BI, the powerful analytics tool that has emerged as the leader in business analytics can be your career if you upskill yourself using Power BI Training in Chennai at Credo Systemz. Mainly, Our Power BI Certification Course in Chennai enables the aspirants to master this professional skill set from the basics under the guidance of our Business Intelligence Experts.
Master the Art of Data Visualizations with Credo Systemz (1).pdfnishajeni1
Microsoft Power BI, the powerful analytics tool that has emerged as the leader in business analytics can be your career if you upskill yourself using Power BI Training in Chennai at Credo Systemz. Mainly, Our Power BI Certification Course in Chennai enables the aspirants to master this professional skill set from the basics under the guidance of our Business Intelligence Experts.
Similar to How to Create a Report in Power BI Desktop.pdf (20)
At Omnepresent Technologies, we champion the transformative power of no-code and low-code platforms, driving innovation and agility in application development. Embracing this revolution is key to staying competitive, enabling rapid adaptation to market dynamics and fostering collaborative development in the digital age.
Read more : https://omnepresent.com/low-code-no-code-services/
Discover the top 5 benefits of utilizing Low Code No Code (LCNC) platforms. OmnePresent Technologies empowers organizations to leverage these platforms for enhanced speed, agility, cost-efficiency, and accessibility. With our expertise, businesses can accelerate innovation, unleash workforce potential, and gain a competitive edge in the digital landscape. Thrive with LCNC solutions.
Read to know more : https://omnepresent.com/low-code-no-code-services/
How low code platforms are shaping the future of digital payments.pptxOmnePresentTechnolog1
Low-code app development services have transformed the digital payment world by allowing companies to develop creative, effective, and secure payment solutions. They are positioned to act as catalysts for future digital payments development thanks to their capacity to speed development, improve teamwork, and revolutionize user experiences.
How low code platforms are shaping the future of digital payments.pdfOmnePresentTechnolog1
Low-code app development services have transformed the digital payment world by allowing companies to develop creative, effective, and secure payment solutions. They are positioned to act as catalysts for future digital payments development thanks to their capacity to speed development, improve teamwork, and revolutionize user experiences.
Build a Smart App with Low-code and Artificial Intelligence.pdfOmnePresentTechnolog1
Ready to unlock the true potential of LowCodeAI apps? Our cutting-edge technology empowers your workforce and uncovers valuable insights. Experience smarter, efficient apps with ease. Discover the future of work with GenerativeArtificialIntelligence. Build NextGenerationApps today with OmnePresent!
Ready to Transform Your Manufacturing Business? Let's embark on a transformative journey together! Contact our dedicated team today to discover how Omnepresent's comprehensive offerings, powered by Mendix, can unlock the full potential of your 𝐬𝐡𝐨𝐩 𝐟𝐥𝐨𝐨𝐫 𝐨𝐩𝐞𝐫𝐚𝐭𝐢𝐨𝐧𝐬. Together, let's unlock new horizons of success and transform your manufacturing business into a powerhouse of efficiency, innovation, and excellence with Omnepresent's unparalleled offerings.
Effective case management systems allow organizations to increase the efficiency of their business processes while boosting accountability. OmnePresent’s Case Management solution helps you streamline case-based work like tracking an application for a new account or the resolution of a disputed credit card transaction or even a support ticket for difficulty logging into online banking. Boost efficiency, reduce errors, and lower costs by automating complex end-to-end processes with our case management system. Book a demo today
Power BI is a set of business analytics tools that enable seamless data analysis and sharing of insights. You can monitor your business and get answers quickly with rich dashboards. It empowers organizations to better create data-driven cultures where decisions are made based on data. Users can connect their data to Power BI and convert them into a variety of visualizations like column charts, pie charts, bubble and heat maps, scatter plots, etc. to gain and share insights. Leverage OmnePresent's PowerBI Consulting Services to create a data-driven culture and get important business insights.
5th LF Energy Power Grid Model Meet-up SlidesDanBrown980551
5th Power Grid Model Meet-up
It is with great pleasure that we extend to you an invitation to the 5th Power Grid Model Meet-up, scheduled for 6th June 2024. This event will adopt a hybrid format, allowing participants to join us either through an online Mircosoft Teams session or in person at TU/e located at Den Dolech 2, Eindhoven, Netherlands. The meet-up will be hosted by Eindhoven University of Technology (TU/e), a research university specializing in engineering science & technology.
Power Grid Model
The global energy transition is placing new and unprecedented demands on Distribution System Operators (DSOs). Alongside upgrades to grid capacity, processes such as digitization, capacity optimization, and congestion management are becoming vital for delivering reliable services.
Power Grid Model is an open source project from Linux Foundation Energy and provides a calculation engine that is increasingly essential for DSOs. It offers a standards-based foundation enabling real-time power systems analysis, simulations of electrical power grids, and sophisticated what-if analysis. In addition, it enables in-depth studies and analysis of the electrical power grid’s behavior and performance. This comprehensive model incorporates essential factors such as power generation capacity, electrical losses, voltage levels, power flows, and system stability.
Power Grid Model is currently being applied in a wide variety of use cases, including grid planning, expansion, reliability, and congestion studies. It can also help in analyzing the impact of renewable energy integration, assessing the effects of disturbances or faults, and developing strategies for grid control and optimization.
What to expect
For the upcoming meetup we are organizing, we have an exciting lineup of activities planned:
-Insightful presentations covering two practical applications of the Power Grid Model.
-An update on the latest advancements in Power Grid -Model technology during the first and second quarters of 2024.
-An interactive brainstorming session to discuss and propose new feature requests.
-An opportunity to connect with fellow Power Grid Model enthusiasts and users.
Dandelion Hashtable: beyond billion requests per second on a commodity serverAntonios Katsarakis
This slide deck presents DLHT, a concurrent in-memory hashtable. Despite efforts to optimize hashtables, that go as far as sacrificing core functionality, state-of-the-art designs still incur multiple memory accesses per request and block request processing in three cases. First, most hashtables block while waiting for data to be retrieved from memory. Second, open-addressing designs, which represent the current state-of-the-art, either cannot free index slots on deletes or must block all requests to do so. Third, index resizes block every request until all objects are copied to the new index. Defying folklore wisdom, DLHT forgoes open-addressing and adopts a fully-featured and memory-aware closed-addressing design based on bounded cache-line-chaining. This design offers lock-free index operations and deletes that free slots instantly, (2) completes most requests with a single memory access, (3) utilizes software prefetching to hide memory latencies, and (4) employs a novel non-blocking and parallel resizing. In a commodity server and a memory-resident workload, DLHT surpasses 1.6B requests per second and provides 3.5x (12x) the throughput of the state-of-the-art closed-addressing (open-addressing) resizable hashtable on Gets (Deletes).
Programming Foundation Models with DSPy - Meetup SlidesZilliz
Prompting language models is hard, while programming language models is easy. In this talk, I will discuss the state-of-the-art framework DSPy for programming foundation models with its powerful optimizers and runtime constraint system.
Skybuffer AI: Advanced Conversational and Generative AI Solution on SAP Busin...Tatiana Kojar
Skybuffer AI, built on the robust SAP Business Technology Platform (SAP BTP), is the latest and most advanced version of our AI development, reaffirming our commitment to delivering top-tier AI solutions. Skybuffer AI harnesses all the innovative capabilities of the SAP BTP in the AI domain, from Conversational AI to cutting-edge Generative AI and Retrieval-Augmented Generation (RAG). It also helps SAP customers safeguard their investments into SAP Conversational AI and ensure a seamless, one-click transition to SAP Business AI.
With Skybuffer AI, various AI models can be integrated into a single communication channel such as Microsoft Teams. This integration empowers business users with insights drawn from SAP backend systems, enterprise documents, and the expansive knowledge of Generative AI. And the best part of it is that it is all managed through our intuitive no-code Action Server interface, requiring no extensive coding knowledge and making the advanced AI accessible to more users.
Ivanti’s Patch Tuesday breakdown goes beyond patching your applications and brings you the intelligence and guidance needed to prioritize where to focus your attention first. Catch early analysis on our Ivanti blog, then join industry expert Chris Goettl for the Patch Tuesday Webinar Event. There we’ll do a deep dive into each of the bulletins and give guidance on the risks associated with the newly-identified vulnerabilities.
Digital Marketing Trends in 2024 | Guide for Staying AheadWask
https://www.wask.co/ebooks/digital-marketing-trends-in-2024
Feeling lost in the digital marketing whirlwind of 2024? Technology is changing, consumer habits are evolving, and staying ahead of the curve feels like a never-ending pursuit. This e-book is your compass. Dive into actionable insights to handle the complexities of modern marketing. From hyper-personalization to the power of user-generated content, learn how to build long-term relationships with your audience and unlock the secrets to success in the ever-shifting digital landscape.
Driving Business Innovation: Latest Generative AI Advancements & Success StorySafe Software
Are you ready to revolutionize how you handle data? Join us for a webinar where we’ll bring you up to speed with the latest advancements in Generative AI technology and discover how leveraging FME with tools from giants like Google Gemini, Amazon, and Microsoft OpenAI can supercharge your workflow efficiency.
During the hour, we’ll take you through:
Guest Speaker Segment with Hannah Barrington: Dive into the world of dynamic real estate marketing with Hannah, the Marketing Manager at Workspace Group. Hear firsthand how their team generates engaging descriptions for thousands of office units by integrating diverse data sources—from PDF floorplans to web pages—using FME transformers, like OpenAIVisionConnector and AnthropicVisionConnector. This use case will show you how GenAI can streamline content creation for marketing across the board.
Ollama Use Case: Learn how Scenario Specialist Dmitri Bagh has utilized Ollama within FME to input data, create custom models, and enhance security protocols. This segment will include demos to illustrate the full capabilities of FME in AI-driven processes.
Custom AI Models: Discover how to leverage FME to build personalized AI models using your data. Whether it’s populating a model with local data for added security or integrating public AI tools, find out how FME facilitates a versatile and secure approach to AI.
We’ll wrap up with a live Q&A session where you can engage with our experts on your specific use cases, and learn more about optimizing your data workflows with AI.
This webinar is ideal for professionals seeking to harness the power of AI within their data management systems while ensuring high levels of customization and security. Whether you're a novice or an expert, gain actionable insights and strategies to elevate your data processes. Join us to see how FME and AI can revolutionize how you work with data!
GraphRAG for Life Science to increase LLM accuracyTomaz Bratanic
GraphRAG for life science domain, where you retriever information from biomedical knowledge graphs using LLMs to increase the accuracy and performance of generated answers
Let's Integrate MuleSoft RPA, COMPOSER, APM with AWS IDP along with Slackshyamraj55
Discover the seamless integration of RPA (Robotic Process Automation), COMPOSER, and APM with AWS IDP enhanced with Slack notifications. Explore how these technologies converge to streamline workflows, optimize performance, and ensure secure access, all while leveraging the power of AWS IDP and real-time communication via Slack notifications.
leewayhertz.com-AI in predictive maintenance Use cases technologies benefits ...alexjohnson7307
Predictive maintenance is a proactive approach that anticipates equipment failures before they happen. At the forefront of this innovative strategy is Artificial Intelligence (AI), which brings unprecedented precision and efficiency. AI in predictive maintenance is transforming industries by reducing downtime, minimizing costs, and enhancing productivity.
zkStudyClub - LatticeFold: A Lattice-based Folding Scheme and its Application...Alex Pruden
Folding is a recent technique for building efficient recursive SNARKs. Several elegant folding protocols have been proposed, such as Nova, Supernova, Hypernova, Protostar, and others. However, all of them rely on an additively homomorphic commitment scheme based on discrete log, and are therefore not post-quantum secure. In this work we present LatticeFold, the first lattice-based folding protocol based on the Module SIS problem. This folding protocol naturally leads to an efficient recursive lattice-based SNARK and an efficient PCD scheme. LatticeFold supports folding low-degree relations, such as R1CS, as well as high-degree relations, such as CCS. The key challenge is to construct a secure folding protocol that works with the Ajtai commitment scheme. The difficulty, is ensuring that extracted witnesses are low norm through many rounds of folding. We present a novel technique using the sumcheck protocol to ensure that extracted witnesses are always low norm no matter how many rounds of folding are used. Our evaluation of the final proof system suggests that it is as performant as Hypernova, while providing post-quantum security.
Paper Link: https://eprint.iacr.org/2024/257
Generating privacy-protected synthetic data using Secludy and MilvusZilliz
During this demo, the founders of Secludy will demonstrate how their system utilizes Milvus to store and manipulate embeddings for generating privacy-protected synthetic data. Their approach not only maintains the confidentiality of the original data but also enhances the utility and scalability of LLMs under privacy constraints. Attendees, including machine learning engineers, data scientists, and data managers, will witness first-hand how Secludy's integration with Milvus empowers organizations to harness the power of LLMs securely and efficiently.
For the full video of this presentation, please visit: https://www.edge-ai-vision.com/2024/06/temporal-event-neural-networks-a-more-efficient-alternative-to-the-transformer-a-presentation-from-brainchip/
Chris Jones, Director of Product Management at BrainChip , presents the “Temporal Event Neural Networks: A More Efficient Alternative to the Transformer” tutorial at the May 2024 Embedded Vision Summit.
The expansion of AI services necessitates enhanced computational capabilities on edge devices. Temporal Event Neural Networks (TENNs), developed by BrainChip, represent a novel and highly efficient state-space network. TENNs demonstrate exceptional proficiency in handling multi-dimensional streaming data, facilitating advancements in object detection, action recognition, speech enhancement and language model/sequence generation. Through the utilization of polynomial-based continuous convolutions, TENNs streamline models, expedite training processes and significantly diminish memory requirements, achieving notable reductions of up to 50x in parameters and 5,000x in energy consumption compared to prevailing methodologies like transformers.
Integration with BrainChip’s Akida neuromorphic hardware IP further enhances TENNs’ capabilities, enabling the realization of highly capable, portable and passively cooled edge devices. This presentation delves into the technical innovations underlying TENNs, presents real-world benchmarks, and elucidates how this cutting-edge approach is positioned to revolutionize edge AI across diverse applications.
HCL Notes and Domino License Cost Reduction in the World of DLAUpanagenda
Webinar Recording: https://www.panagenda.com/webinars/hcl-notes-and-domino-license-cost-reduction-in-the-world-of-dlau/
The introduction of DLAU and the CCB & CCX licensing model caused quite a stir in the HCL community. As a Notes and Domino customer, you may have faced challenges with unexpected user counts and license costs. You probably have questions on how this new licensing approach works and how to benefit from it. Most importantly, you likely have budget constraints and want to save money where possible. Don’t worry, we can help with all of this!
We’ll show you how to fix common misconfigurations that cause higher-than-expected user counts, and how to identify accounts which you can deactivate to save money. There are also frequent patterns that can cause unnecessary cost, like using a person document instead of a mail-in for shared mailboxes. We’ll provide examples and solutions for those as well. And naturally we’ll explain the new licensing model.
Join HCL Ambassador Marc Thomas in this webinar with a special guest appearance from Franz Walder. It will give you the tools and know-how to stay on top of what is going on with Domino licensing. You will be able lower your cost through an optimized configuration and keep it low going forward.
These topics will be covered
- Reducing license cost by finding and fixing misconfigurations and superfluous accounts
- How do CCB and CCX licenses really work?
- Understanding the DLAU tool and how to best utilize it
- Tips for common problem areas, like team mailboxes, functional/test users, etc
- Practical examples and best practices to implement right away
Skybuffer SAM4U tool for SAP license adoptionTatiana Kojar
Manage and optimize your license adoption and consumption with SAM4U, an SAP free customer software asset management tool.
SAM4U, an SAP complimentary software asset management tool for customers, delivers a detailed and well-structured overview of license inventory and usage with a user-friendly interface. We offer a hosted, cost-effective, and performance-optimized SAM4U setup in the Skybuffer Cloud environment. You retain ownership of the system and data, while we manage the ABAP 7.58 infrastructure, ensuring fixed Total Cost of Ownership (TCO) and exceptional services through the SAP Fiori interface.
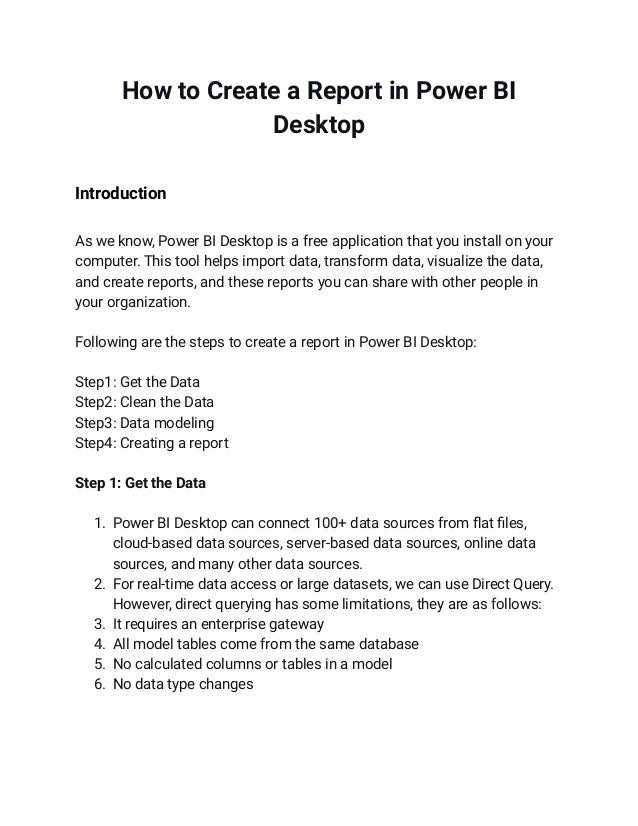
1. How to Create a Report in Power BI
Desktop
Introduction
As we know, Power BI Desktop is a free application that you install on your
computer. This tool helps import data, transform data, visualize the data,
and create reports, and these reports you can share with other people in
your organization.
Following are the steps to create a report in Power BI Desktop:
Step1: Get the Data
Step2: Clean the Data
Step3: Data modeling
Step4: Creating a report
Step 1: Get the Data
1. Power BI Desktop can connect 100+ data sources from flat files,
cloud-based data sources, server-based data sources, online data
sources, and many other data sources.
2. For real-time data access or large datasets, we can use Direct Query.
However, direct querying has some limitations, they are as follows:
3. It requires an enterprise gateway
4. All model tables come from the same database
5. No calculated columns or tables in a model
6. No data type changes
2. The following image shows the connection window for connecting different
data sources in PowerBI Desktop.
Step 2: Clean the Data
You need to clean the data before using it in a report to improve the report's
performance. Power Query in Power BI Desktop allows us to clean the data,
merge the data, and append the data from different sources. Reports
require cleaned data that is fixed or has no incorrect, corrupted, incorrectly
formatted, duplicated or incomplete data within a database.
3. Transforming Data is part of data cleaning that consists of operations like
renaming objects, combining queries, fixing metadata, filtering rows,
eliminating columns, and adding columns.
Configuring the Properties is also part of data cleaning which consists of
operations like sorting the order, hidden objects, formatting the objects or
columns, changing the datatype, summarization, etc.
The following image shows the power query window for cleaning and
transforming data in PowerBI Desktop.
Step 3: Data Modeling
When you import the data from different data sources, you need to create
relationships between them. Data modeling is the feature used to connect
multiple data sources in Power BI tools using a relationship.
There are different types of relationships. They are one-to-one relationships,
one-to-many relationships, many-to-one relationships, and many-to-many
relationships.
The following image shows the data-modeling, window-managing
relationship between the table in PowerBI Desktop.
4. Step 4: Creating Report
PowerBI Desktop is based on the concept that a picture is worth many
thousands of words. It consists of a visualization pane that lets you create
clear and convincing visuals that tell you and your audience far more than
the profusion of figures ever could.
Power BI Desktop lets you make a suitable dataset into different visuals
● Pie Chart
● Donut Chart
● Bar chart
● Column Chart
● Stacked bar/column chart
● Clustered bar/column chart
● Line chart
● Area chart
● Funnel Chart
● Waterfall Chart
● Gauge
● Slicer
The visualization pane in the image of the Power BI desktop below is used
to select the chart used in the report and the columns used in the data
pane to create this View.
5. The report is a combination of different visuals, which may consist of
graphs, charts, slicers, cards, and many other visuals. You can create a
particular chart by selecting visuals from the visualization pane and data
from the field pane.
Once charts are added to a report, they can be interactive with end-users
using filters. The following filters can be used in the report to filter the rows
and see some specific values.
The following image shows the report's final look, which consists of cards,
slicers, buttons, and different charts.
6. Power BI has a multitude of advantages that make it stand apart as a BI
tool. For more information, get in touch with us.