Download as PDF, PPTX


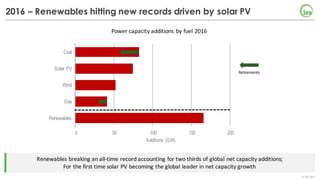
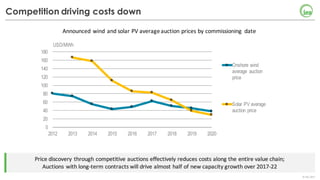
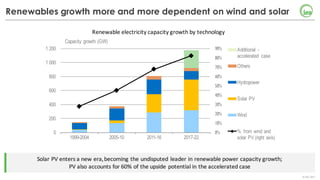
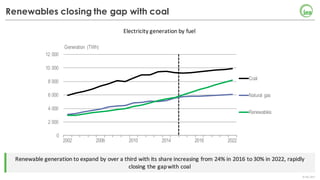
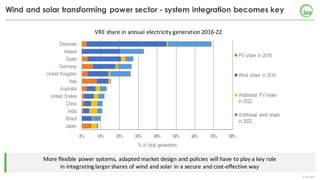
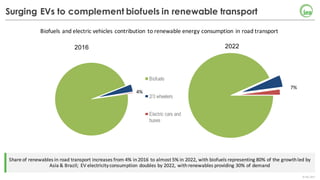
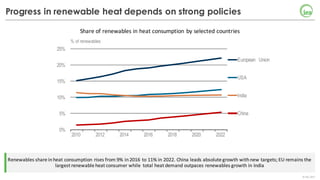

The document summarizes key findings about renewables in 2017. Solar PV broke records in 2016, growing faster than any other form of energy and becoming the global leader in new capacity additions. Wind and solar prices continue to decline due to competitive auctions. By 2022, renewables capacity is projected to grow by over 1,000 GW and generate over 8,000 TWh of electricity annually, led by strong growth in China, India, and solar PV. Widespread adoption of renewables presents challenges around integrating variable wind and solar power into existing energy systems.