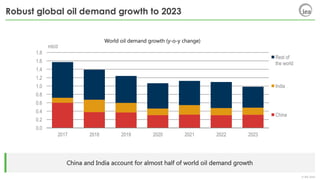
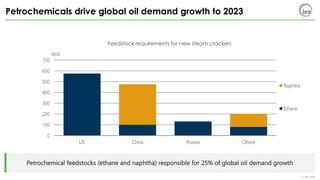
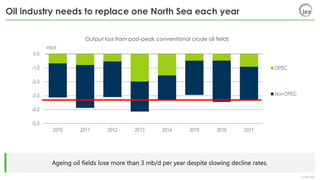
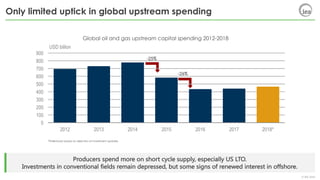
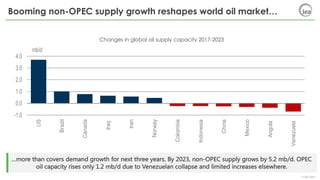
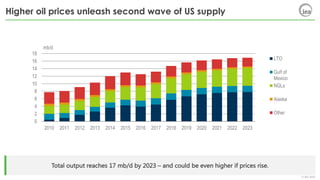
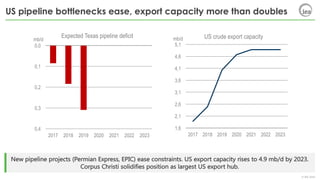
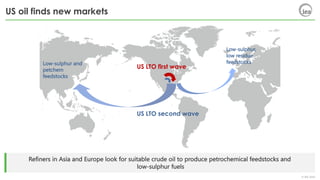
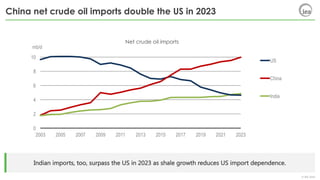
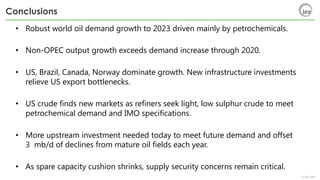
Market Report Series
Oil 2018
CERA Week, Houston – 5 March 2018
© IEA 2018
Robust global oil demand growth to 2023
China and India account for almost half of world oil demand growth
World oil demand growth (y-o-y change)
0.0
0.2
0.4
0.6
0.8
1.0
1.2
1.4
1.6
1.8
2017 2018 2019 2020 2021 2022 2023
mb/d
Rest of
the world
India
China
© IEA 2018
Petrochemicals drive global oil demand growth to 2023
Petrochemical feedstocks (ethane and naphtha) responsible for 25% of global oil demand growth
Feedstock requirements for new steam crackers
0
100
200
300
400
500
600
700
US China Russia Others
kb/d
Naphtha
Ethane
© IEA 2018
-5.0
-4.0
-3.0
-2.0
-1.0
0.0
2010 2011 2012 2013 2014 2015 2016 2017
mb/d
OPEC
Non-OPEC
Oil industry needs to replace one North Sea each year
Ageing oil fields lose more than 3 mb/d per year despite slowing decline rates.
Output loss from post-peak conventional crude oil fields
© IEA 2018
Only limited uptick in global upstream spending
Producers spend more on short cycle supply, especially US LTO.
Investments in conventional fields remain depressed, but some signs of renewed interest in offshore.
Global oil and gas upstream capital spending 2012-2018
-25%
-26%
*Preliminary based on selection of investment updates
0
100
200
300
400
500
600
700
800
900
2012 2013 2014 2015 2016 2017 2018*
USD billion
© IEA 2018
Booming non-OPEC supply growth reshapes world oil market…
…more than covers demand growth for next three years. By 2023, non-OPEC supply grows by 5.2 mb/d. OPEC
oil capacity rises only 1.2 mb/d due to Venezuelan collapse and limited increases elsewhere.
Changes in global oil supply capacity 2017-2023
-1.0
0.0
1.0
2.0
3.0
4.0
US
Brazil
Canada
Iraq
Iran
Norway
Colombia
Indonesia
China
Mexico
Angola
Venezuela
mb/d
© IEA 2018
0
2
4
6
8
10
12
14
16
18
2010 2011 2012 2013 2014 2015 2016 2017 2018 2019 2020 2021 2022 2023
mb/d
LTO
Gulf of
Mexico
NGLs
Alaska
Other
Higher oil prices unleash second wave of US supply
Total output reaches 17 mb/d by 2023 – and could be even higher if prices rise.
0
2
4
6
8
10
12
14
16
18
2010 2011 2012 2013 2014 2015 2016 2017 2018 2019 2020 2021 2022 2023
mb/d
LTO
Gulf of
Mexico
NGLs
Alaska
Other
© IEA 2018
US pipeline bottlenecks ease, export capacity more than doubles
New pipeline projects (Permian Express, EPIC) ease constraints. US export capacity rises to 4.9 mb/d by 2023.
Corpus Christi solidifies position as largest US export hub.
0,0
0,1
0,2
0,3
0,4
2017 2018 2019 2020 2021 2022 2023
mb/d
Expected Texas pipeline deficit
1,6
2,1
2,6
3,1
3,6
4,1
4,6
5,1
2017 2018 2019 2020 2021 2022 2023
mb/d US crude export capacity
© IEA 2018
US oil finds new markets
Refiners in Asia and Europe look for suitable crude oil to produce petrochemical feedstocks and
low-sulphur fuels
US LTO first wave
US LTO second wave
Low-sulphur,
low residue
feedstocksLow-sulphur and
petchem
feedstocks
© IEA 2018
China net crude oil imports double the US in 2023
0
2
4
6
8
10
2003 2005 2007 2009 2011 2013 2015 2017 2019 2021 2023
mb/d
US
China
India
Indian imports, too, surpass the US in 2023 as shale growth reduces US import dependence.
Net crude oil imports
© IEA 2018
Middle East wants to refine more oil
Middle East accounts for 30% of global refining capacity growth.
International downstream expansion becomes a strategic objective for the region’s NOCs.
0.0
0.5
1.0
1.5
2.0
2.5
3.0
2005-11 2011-17 2017-23
mb/d Refining capacity additions
China India Middle East
0.0
0.5
1.0
1.5
2.0
2.5
3.0
2005-11 2011-17 2017-23
mb/d Middle East capacity expansion
Upstream Refining
© IEA 2018
Conclusions
• Robust world oil demand growth to 2023 driven mainly by petrochemicals.
• Non-OPEC output growth exceeds demand increase through 2020.
• US, Brazil, Canada, Norway dominate growth. New infrastructure investments
relieve US export bottlenecks.
• US crude finds new markets as refiners seek light, low sulphur crude to meet
petrochemical demand and IMO specifications.
• More upstream investment needed today to meet future demand and offset
3 mb/d of declines from mature oil fields each year.
• As spare capacity cushion shrinks, supply security concerns remain critical.
© IEA 2018

Oil 2018 slide deck

  • 1.
    Market Report Series Oil2018 CERA Week, Houston – 5 March 2018
  • 2.
    © IEA 2018 Robustglobal oil demand growth to 2023 China and India account for almost half of world oil demand growth World oil demand growth (y-o-y change) 0.0 0.2 0.4 0.6 0.8 1.0 1.2 1.4 1.6 1.8 2017 2018 2019 2020 2021 2022 2023 mb/d Rest of the world India China
  • 3.
    © IEA 2018 Petrochemicalsdrive global oil demand growth to 2023 Petrochemical feedstocks (ethane and naphtha) responsible for 25% of global oil demand growth Feedstock requirements for new steam crackers 0 100 200 300 400 500 600 700 US China Russia Others kb/d Naphtha Ethane
  • 4.
    © IEA 2018 -5.0 -4.0 -3.0 -2.0 -1.0 0.0 20102011 2012 2013 2014 2015 2016 2017 mb/d OPEC Non-OPEC Oil industry needs to replace one North Sea each year Ageing oil fields lose more than 3 mb/d per year despite slowing decline rates. Output loss from post-peak conventional crude oil fields
  • 5.
    © IEA 2018 Onlylimited uptick in global upstream spending Producers spend more on short cycle supply, especially US LTO. Investments in conventional fields remain depressed, but some signs of renewed interest in offshore. Global oil and gas upstream capital spending 2012-2018 -25% -26% *Preliminary based on selection of investment updates 0 100 200 300 400 500 600 700 800 900 2012 2013 2014 2015 2016 2017 2018* USD billion
  • 6.
    © IEA 2018 Boomingnon-OPEC supply growth reshapes world oil market… …more than covers demand growth for next three years. By 2023, non-OPEC supply grows by 5.2 mb/d. OPEC oil capacity rises only 1.2 mb/d due to Venezuelan collapse and limited increases elsewhere. Changes in global oil supply capacity 2017-2023 -1.0 0.0 1.0 2.0 3.0 4.0 US Brazil Canada Iraq Iran Norway Colombia Indonesia China Mexico Angola Venezuela mb/d
  • 7.
    © IEA 2018 0 2 4 6 8 10 12 14 16 18 20102011 2012 2013 2014 2015 2016 2017 2018 2019 2020 2021 2022 2023 mb/d LTO Gulf of Mexico NGLs Alaska Other Higher oil prices unleash second wave of US supply Total output reaches 17 mb/d by 2023 – and could be even higher if prices rise. 0 2 4 6 8 10 12 14 16 18 2010 2011 2012 2013 2014 2015 2016 2017 2018 2019 2020 2021 2022 2023 mb/d LTO Gulf of Mexico NGLs Alaska Other
  • 8.
    © IEA 2018 USpipeline bottlenecks ease, export capacity more than doubles New pipeline projects (Permian Express, EPIC) ease constraints. US export capacity rises to 4.9 mb/d by 2023. Corpus Christi solidifies position as largest US export hub. 0,0 0,1 0,2 0,3 0,4 2017 2018 2019 2020 2021 2022 2023 mb/d Expected Texas pipeline deficit 1,6 2,1 2,6 3,1 3,6 4,1 4,6 5,1 2017 2018 2019 2020 2021 2022 2023 mb/d US crude export capacity
  • 9.
    © IEA 2018 USoil finds new markets Refiners in Asia and Europe look for suitable crude oil to produce petrochemical feedstocks and low-sulphur fuels US LTO first wave US LTO second wave Low-sulphur, low residue feedstocksLow-sulphur and petchem feedstocks
  • 10.
    © IEA 2018 Chinanet crude oil imports double the US in 2023 0 2 4 6 8 10 2003 2005 2007 2009 2011 2013 2015 2017 2019 2021 2023 mb/d US China India Indian imports, too, surpass the US in 2023 as shale growth reduces US import dependence. Net crude oil imports
  • 11.
    © IEA 2018 MiddleEast wants to refine more oil Middle East accounts for 30% of global refining capacity growth. International downstream expansion becomes a strategic objective for the region’s NOCs. 0.0 0.5 1.0 1.5 2.0 2.5 3.0 2005-11 2011-17 2017-23 mb/d Refining capacity additions China India Middle East 0.0 0.5 1.0 1.5 2.0 2.5 3.0 2005-11 2011-17 2017-23 mb/d Middle East capacity expansion Upstream Refining
  • 12.
    © IEA 2018 Conclusions •Robust world oil demand growth to 2023 driven mainly by petrochemicals. • Non-OPEC output growth exceeds demand increase through 2020. • US, Brazil, Canada, Norway dominate growth. New infrastructure investments relieve US export bottlenecks. • US crude finds new markets as refiners seek light, low sulphur crude to meet petrochemical demand and IMO specifications. • More upstream investment needed today to meet future demand and offset 3 mb/d of declines from mature oil fields each year. • As spare capacity cushion shrinks, supply security concerns remain critical.
  • 13.