Download as PPSX, PPTX
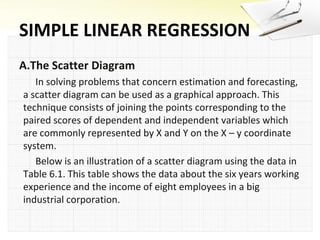
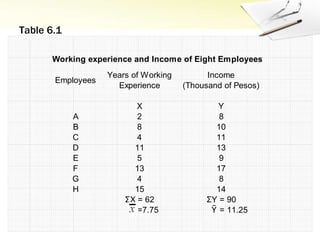
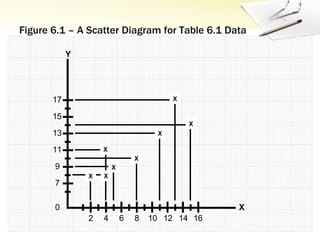
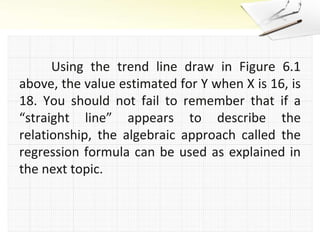
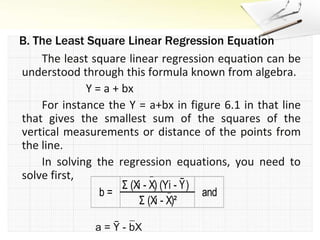
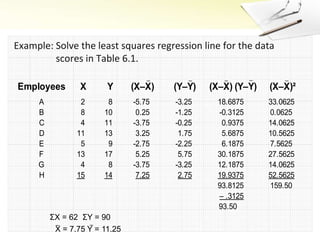
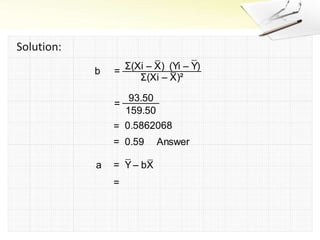
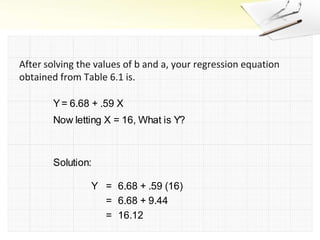
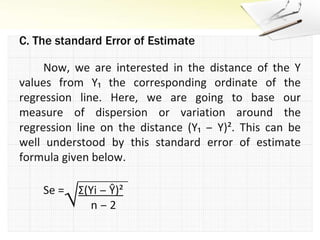
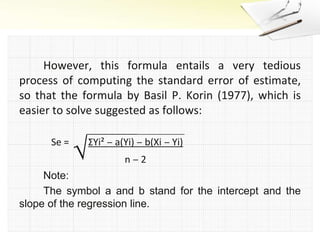
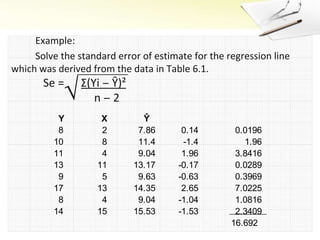
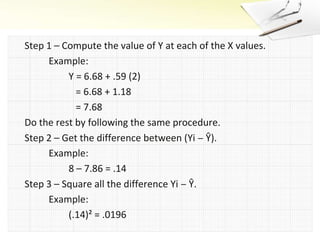
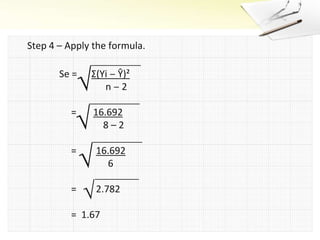
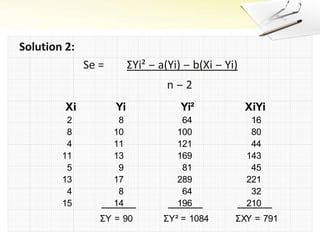
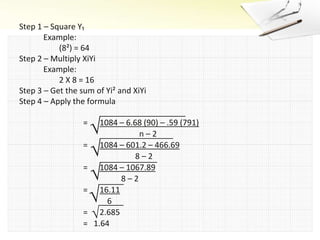
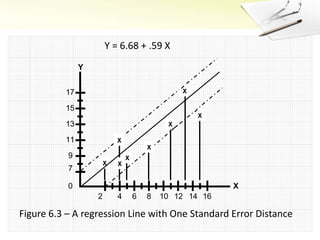

The document discusses simple linear regression, explaining the use of scatter diagrams to estimate and forecast relationships between dependent and independent variables. It illustrates the concept through examples, detailing how to draw trend lines and calculate the least squares regression equation, as well as the standard error of estimate. The final sections provide step-by-step procedures for solving regression equations and interpreting the standard error in relation to observed data.