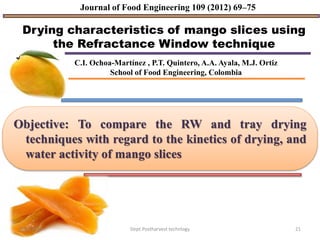
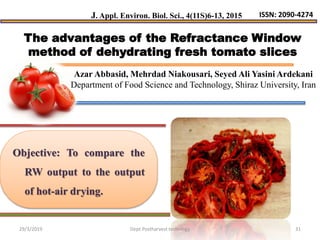
1) Refractance window drying is a novel drying method that uses infrared radiation to dry foods in a more efficient manner than conventional methods like freeze drying or hot air drying.
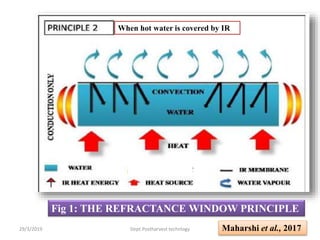
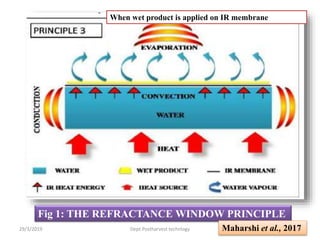
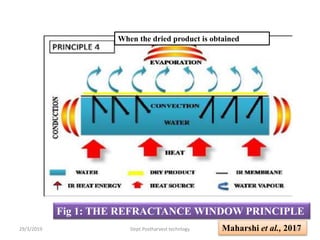
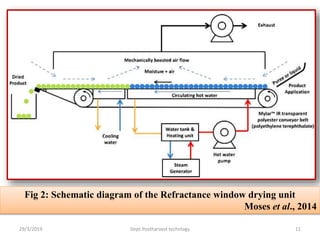
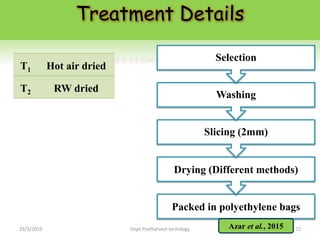
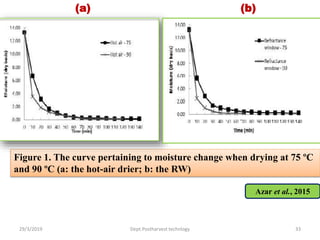
2) It involves placing a wet food product on a mylar sheet above hot water, where the water and mylar sheet work together to transmit infrared radiation and heat to dry the product quickly in 2-6 minutes.
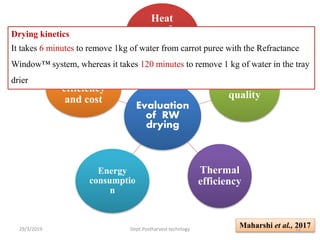
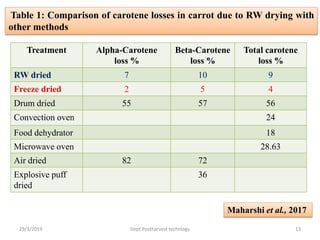
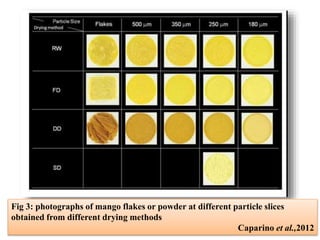
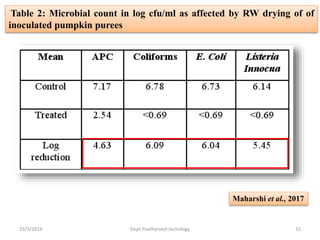
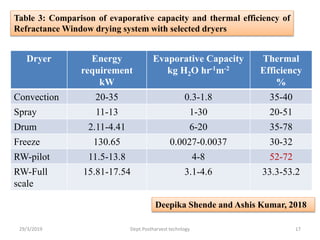
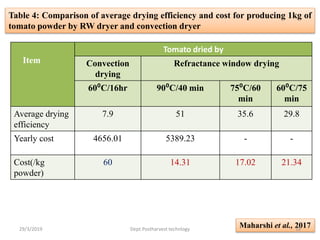
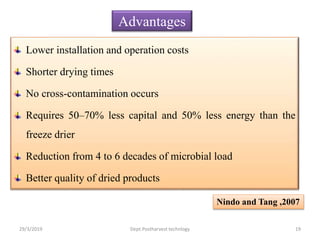
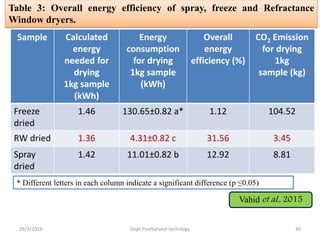
3) Studies have found refractance window drying produces higher quality dried products than other methods, with lower carotene and nutrient losses. It also uses 50-70% less energy and has lower costs.