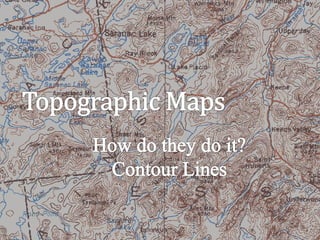
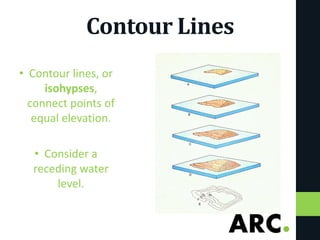
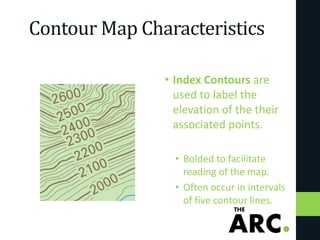
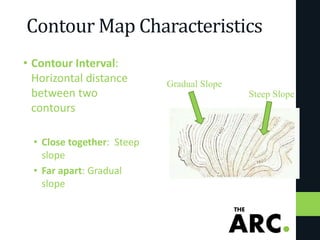
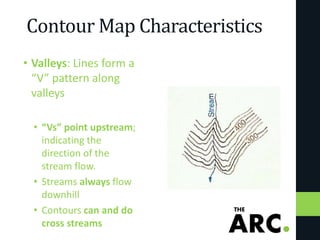
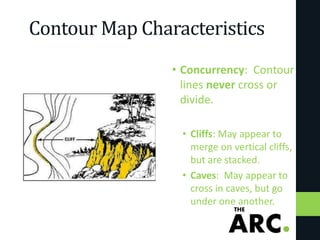
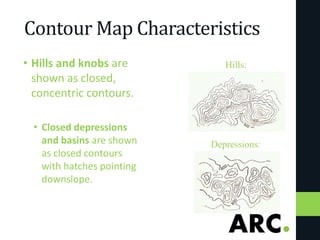
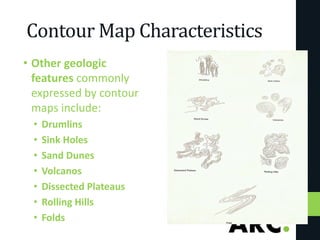
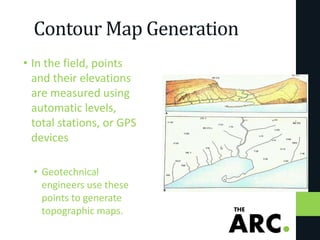
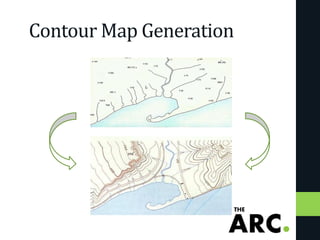
Topographic Maps and
Countours
Academic Resource Center
Topography: The relief features
or configuration of an area.
*How do we measure it?
Contour Lines
• Contour lines, or
isohypses,
connect points of
equal elevation.
• Consider a
receding water
level.
Contour Map Characteristics
• Index Contours are
used to label the
elevation of the their
associated points.
• Bolded to facilitate
reading of the map.
• Often occur in intervals
of five contour lines.
Contour Map Characteristics
• Contour Interval:
Horizontal distance
between two
contours
• Close together: Steep
slope
• Far apart: Gradual
slope
Gradual Slope
Steep Slope
Contour Map Characteristics
• Valleys: Lines form a
“V” pattern along
valleys
• “Vs” point upstream;
indicating the
direction of the
stream flow.
• Streams always flow
downhill
• Contours can and do
cross streams
Contour Map Characteristics
• Concurrency: Contour
lines never cross or
divide.
• Cliffs: May appear to
merge on vertical cliffs,
but are stacked.
• Caves: May appear to
cross in caves, but go
under one another.
Contour Map Characteristics
• Hills and knobs are
shown as closed,
concentric contours.
• Closed depressions
and basins are shown
as closed contours
with hatches pointing
downslope.
Hills:
Depressions:
Contour Map Characteristics
• Other geologic
features commonly
expressed by contour
maps include:
• Drumlins
• Sink Holes
• Sand Dunes
• Volcanos
• Dissected Plateaus
• Rolling Hills
• Folds
Contour Map Generation
• In the field, points
and their elevations
are measured using
automatic levels,
total stations, or GPS
devices
• Geotechnical
engineers use these
points to generate
topographic maps.
Contour Map Generation
• Estimating Contour Intervals:
• Use an engineering scale
• Measure the distance between two points
• Divide the distance by the number of contours
• Mark the points along the interval
Contour Map Generation
• Example:
• Contours are to be placed every ten feet.
d = 300 feet
• There are to be three contour
lines on this interval.
• Divide 300 feet by 3 to get
one contour every 100 feet.
• Mark four points (two on the
endpoints, and two between)
and draw the contours.
Topographic Profiles
• Cross-sectional view of a
portion of a topographic map.
• Used to demonstrate the
vertical scale of landforms.
• Usually use an exaggerated
scale.
Topographic Profiles
• Generating profiles:
• Draw a line between the two
points bounding the desired
profile area.
• Place a folded sheet of paper
along the line.
• Mark each contour line
intersecting the paper.
• From each mark, indicate the
vertical height with a dot on a
scale.
• Connect the height dots with a
smooth line.
Other Mapping Methods
• Aerial Photography
• Extensive visual details
• Allow stereoscopic
viewing
• Lack information about
rock bodies, terrain, and
other geologic features
Other Mapping Methods
• Landsat and Radar
• Earth Resources
Observation System
(EROS): satellite array
• Can see through cloud
cover
• Can be enhanced with
false color
• Used by Google Earth
Other Mapping Methods
• Computer Generated Terrain
Models
• Store vast amounts of data
• Can be rendered from
Landsat and radar data
• Vertical scale can be
exaggerated
• Reveals features that may
not be immediately
apparent
Other Mapping Methods
• Geologic Maps
• Display different rock types
in an area
• Readily available on United
States Geological Survey
websites
• Usually lack elevation
information
Questions?

1605005768-topograph (1).pdf

  • 1.
  • 2.
    Topography: The relieffeatures or configuration of an area. *How do we measure it?
  • 4.
    Contour Lines • Contourlines, or isohypses, connect points of equal elevation. • Consider a receding water level.
  • 5.
    Contour Map Characteristics •Index Contours are used to label the elevation of the their associated points. • Bolded to facilitate reading of the map. • Often occur in intervals of five contour lines.
  • 6.
    Contour Map Characteristics •Contour Interval: Horizontal distance between two contours • Close together: Steep slope • Far apart: Gradual slope Gradual Slope Steep Slope
  • 7.
    Contour Map Characteristics •Valleys: Lines form a “V” pattern along valleys • “Vs” point upstream; indicating the direction of the stream flow. • Streams always flow downhill • Contours can and do cross streams
  • 8.
    Contour Map Characteristics •Concurrency: Contour lines never cross or divide. • Cliffs: May appear to merge on vertical cliffs, but are stacked. • Caves: May appear to cross in caves, but go under one another.
  • 9.
    Contour Map Characteristics •Hills and knobs are shown as closed, concentric contours. • Closed depressions and basins are shown as closed contours with hatches pointing downslope. Hills: Depressions:
  • 10.
    Contour Map Characteristics •Other geologic features commonly expressed by contour maps include: • Drumlins • Sink Holes • Sand Dunes • Volcanos • Dissected Plateaus • Rolling Hills • Folds
  • 11.
    Contour Map Generation •In the field, points and their elevations are measured using automatic levels, total stations, or GPS devices • Geotechnical engineers use these points to generate topographic maps.
  • 12.
  • 13.
    Contour Map Generation •Estimating Contour Intervals: • Use an engineering scale • Measure the distance between two points • Divide the distance by the number of contours • Mark the points along the interval
  • 14.
    Contour Map Generation •Example: • Contours are to be placed every ten feet. d = 300 feet • There are to be three contour lines on this interval. • Divide 300 feet by 3 to get one contour every 100 feet. • Mark four points (two on the endpoints, and two between) and draw the contours.
  • 15.
    Topographic Profiles • Cross-sectionalview of a portion of a topographic map. • Used to demonstrate the vertical scale of landforms. • Usually use an exaggerated scale.
  • 16.
    Topographic Profiles • Generatingprofiles: • Draw a line between the two points bounding the desired profile area. • Place a folded sheet of paper along the line. • Mark each contour line intersecting the paper. • From each mark, indicate the vertical height with a dot on a scale. • Connect the height dots with a smooth line.
  • 17.
    Other Mapping Methods •Aerial Photography • Extensive visual details • Allow stereoscopic viewing • Lack information about rock bodies, terrain, and other geologic features
  • 18.
    Other Mapping Methods •Landsat and Radar • Earth Resources Observation System (EROS): satellite array • Can see through cloud cover • Can be enhanced with false color • Used by Google Earth
  • 19.
    Other Mapping Methods •Computer Generated Terrain Models • Store vast amounts of data • Can be rendered from Landsat and radar data • Vertical scale can be exaggerated • Reveals features that may not be immediately apparent
  • 20.
    Other Mapping Methods •Geologic Maps • Display different rock types in an area • Readily available on United States Geological Survey websites • Usually lack elevation information
  • 21.