This document provides an overview of quantitative research methodologies and designs that are covered in Unit VI of the RCH 7301 course. It discusses four main types of quantitative research design: descriptive, correlational, quasi-experimental, and experimental. Descriptive design establishes associations between variables, while correlational examines relationships. Quasi-experimental and experimental designs test hypotheses and interventions, with experimental having random assignment to control and intervention groups. The document also covers statistics for analyzing differences and associations, and provides guidance on choosing appropriate quantitative research designs.
A PRESENTATION ON RESEARCH METHODS: SELECTION OF A RESEARCH TOPIC, FORMULATING A HYPOTHESIS, PHILOSOPHICAL ISSUES IN RESEARCH, QUANTITATIVE VS QUALITATIVE DEBATE & SELECTION OF A RESEARCH METHOD
Causal Comparative Research At least two different groups are compared on a dependent variable or measure of performance (called the “effect”) because the independent variable (called the “cause”) has already occurred or cannot be manipulated. Dependent variable-the change or difference occurring as a result of the independent variable. Independent variable- an activity of characteristic believed to make a difference with respect to some behavior.
The research paper has developed over the past three centuries into a tool to communicate the results of scientific inquiry.
The ability to accurately describe ideas, protocols/procedures, and outcomes are the pillars of scientific writing.
Quantitative Methods of Research-Intro to research
Once a researcher has written the research question, the next step is to determine the appropriate research methodology necessary to study the question. The three main types of research design methods are qualitative, quantitative and mixed methods.
Quantitative research involves the systematic collection and analysis of data.
The research approach indicates the basic procedure for conducting research.
Research approach is the technique which the researcher uses to structure a study in order to gather and analyze information relevant to the research question .
2024.06.01 Introducing a competency framework for languag learning materials ...Sandy Millin
http://sandymillin.wordpress.com/iateflwebinar2024
Published classroom materials form the basis of syllabuses, drive teacher professional development, and have a potentially huge influence on learners, teachers and education systems. All teachers also create their own materials, whether a few sentences on a blackboard, a highly-structured fully-realised online course, or anything in between. Despite this, the knowledge and skills needed to create effective language learning materials are rarely part of teacher training, and are mostly learnt by trial and error.
Knowledge and skills frameworks, generally called competency frameworks, for ELT teachers, trainers and managers have existed for a few years now. However, until I created one for my MA dissertation, there wasn’t one drawing together what we need to know and do to be able to effectively produce language learning materials.
This webinar will introduce you to my framework, highlighting the key competencies I identified from my research. It will also show how anybody involved in language teaching (any language, not just English!), teacher training, managing schools or developing language learning materials can benefit from using the framework.
Students, digital devices and success - Andreas Schleicher - 27 May 2024..pptxEduSkills OECD
Andreas Schleicher presents at the OECD webinar ‘Digital devices in schools: detrimental distraction or secret to success?’ on 27 May 2024. The presentation was based on findings from PISA 2022 results and the webinar helped launch the PISA in Focus ‘Managing screen time: How to protect and equip students against distraction’ https://www.oecd-ilibrary.org/education/managing-screen-time_7c225af4-en and the OECD Education Policy Perspective ‘Students, digital devices and success’ can be found here - https://oe.cd/il/5yV
How to Split Bills in the Odoo 17 POS ModuleCeline George
Bills have a main role in point of sale procedure. It will help to track sales, handling payments and giving receipts to customers. Bill splitting also has an important role in POS. For example, If some friends come together for dinner and if they want to divide the bill then it is possible by POS bill splitting. This slide will show how to split bills in odoo 17 POS.
How to Create Map Views in the Odoo 17 ERPCeline George
The map views are useful for providing a geographical representation of data. They allow users to visualize and analyze the data in a more intuitive manner.
Palestine last event orientationfvgnh .pptxRaedMohamed3
An EFL lesson about the current events in Palestine. It is intended to be for intermediate students who wish to increase their listening skills through a short lesson in power point.
Operation “Blue Star” is the only event in the history of Independent India where the state went into war with its own people. Even after about 40 years it is not clear if it was culmination of states anger over people of the region, a political game of power or start of dictatorial chapter in the democratic setup.
The people of Punjab felt alienated from main stream due to denial of their just demands during a long democratic struggle since independence. As it happen all over the word, it led to militant struggle with great loss of lives of military, police and civilian personnel. Killing of Indira Gandhi and massacre of innocent Sikhs in Delhi and other India cities was also associated with this movement.
We all have good and bad thoughts from time to time and situation to situation. We are bombarded daily with spiraling thoughts(both negative and positive) creating all-consuming feel , making us difficult to manage with associated suffering. Good thoughts are like our Mob Signal (Positive thought) amidst noise(negative thought) in the atmosphere. Negative thoughts like noise outweigh positive thoughts. These thoughts often create unwanted confusion, trouble, stress and frustration in our mind as well as chaos in our physical world. Negative thoughts are also known as “distorted thinking”.
Instructions for Submissions thorugh G- Classroom.pptxJheel Barad
This presentation provides a briefing on how to upload submissions and documents in Google Classroom. It was prepared as part of an orientation for new Sainik School in-service teacher trainees. As a training officer, my goal is to ensure that you are comfortable and proficient with this essential tool for managing assignments and fostering student engagement.
Synthetic Fiber Construction in lab .pptxPavel ( NSTU)
Synthetic fiber production is a fascinating and complex field that blends chemistry, engineering, and environmental science. By understanding these aspects, students can gain a comprehensive view of synthetic fiber production, its impact on society and the environment, and the potential for future innovations. Synthetic fibers play a crucial role in modern society, impacting various aspects of daily life, industry, and the environment. ynthetic fibers are integral to modern life, offering a range of benefits from cost-effectiveness and versatility to innovative applications and performance characteristics. While they pose environmental challenges, ongoing research and development aim to create more sustainable and eco-friendly alternatives. Understanding the importance of synthetic fibers helps in appreciating their role in the economy, industry, and daily life, while also emphasizing the need for sustainable practices and innovation.
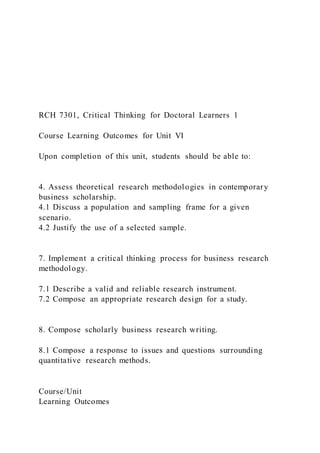
Rch 7301, critical thinking for doctoral learners 1
1. RCH 7301, Critical Thinking for Doctoral Learners 1
Course Learning Outcomes for Unit VI
Upon completion of this unit, students should be able to:
4. Assess theoretical research methodologies in contemporary
business scholarship.
4.1 Discuss a population and sampling frame for a given
scenario.
4.2 Justify the use of a selected sample.
7. Implement a critical thinking process for business research
methodology.
7.1 Describe a valid and reliable research instrument.
7.2 Compose an appropriate research design for a study.
8. Compose scholarly business research writing.
8.1 Compose a response to issues and questions surrounding
quantitative research methods.
Course/Unit
Learning Outcomes
2. Learning Activity
4.1
Unit Lesson
Chapter 6
Chapter 24
Unit VI Assignment
4.2
Unit Lesson
Chapter 6
Chapter 24
Unit VI Assignment
7.1
Unit Lesson
Chapter 6
Chapter 24
Unit VI Assignment
7.2
Unit Lesson
Chapter 6
Chapter 24
Unit VI Assignment
8.1
Unit Lesson
Chapter 6
Chapter 24
3. Unit VI Assignment
Required Unit Resources
Chapter 6: Quantitative Research Design
Chapter 24: Analysing and Presenting Quantitative Data
UNIT VI STUDY GUIDE
Quantitative Research Design: Exploration
RCH 7301, Critical Thinking for Doctoral Learners 2
UNIT x STUDY GUIDE
Title
Unit Lesson
Quantitative Research Design
Quantitative research measures and defines elements through
the collection of data, the analyzation of data,
and the application of the data to a theoretical framework.
Quantitative research design can be categorized
into four main types, which are listed below:
4. • descriptive where a subject is measured once; descriptive
quantitative research establishes
associations between variables;
• correlational where the relationship between study variables is
investigated;
• quasi-experimental where any cause-and-effect relationship is
determined; and
• experimental where a subject is measured before and after the
treatment and where any cause-and-
effect relationship is determined (Drummond & Murphy-Reyes,
2018).
The differences among the four types have to do with the
amount of control that the researcher designs for
the variables in the experiment or study. Quantitative research
makes use of tools (e.g., graphs, linear
regressions, hypothesis testing) to organize and analyze the
gathered data.
Researchers gather data from quantitative studies via
experimentation (i.e., where an independent variable’s
effects on a dependent variable are measured) or through
surveys, which are designed along a rating scale.
Because the focus of questions for a quantitative study is small,
the quantitative study can be very narrow and
limited in scope. That is both a strength and a weakness. A
quantitative study on a very focused sample can
yield reliable data about that group and research question, and
the study can be replicated elsewhere to test
a theory or hypothesis again. However, the collection of data
and a focused sample size can also mean that
the study’s results or conclusions are not applicable over a
5. wider area or grouping of people, and, therefore,
can have limited use unless the study is replicated repeatedly to
support the findings. Data trustworthiness is
determined by the credibility of the data collection, the data’s
transferability, the data’s dependability, and the
data’s confirmability.
Descriptive Quantitative Research
A researcher who designs a descriptive study wants to know the
nature of how things are as they are.
Descriptive quantitative research either identifies the
characteristics of a phenomenon or explores correlations
among phenomena. In terms of survey research, which is the
most commonly deployed type of descriptive
research, the researcher seeks to describe the characteristics of
a larger population. Descriptive research
examines phenomena as they are and does not involve changing
a situation that is being investigated. Since
the researcher does not practice control over any variables in
the study design, descriptive research cannot
be used to determine cause-and-effect relationships.
A descriptive research study might employ data collection
strategies such as sampling, observing, or
interviewing, which take on specific forms when the researcher
wants them to yield quantitative data.
Descriptive research designs include observation studies,
correlational research, development studies, and
survey-based research (Oakshott, 2019). All of these designs
yield data that can be worked on through
statistical analysis. Within the designs, survey-based research is
the most commonly used type of descriptive
quantitative research.
6. Correlational Quantitative Research
According to Creswell and Creswell (2018), a correlational
study can examine the extent to which differences
in one characteristic or variable are related to differences in one
or more other characteristics or variables. A
correlation exists if the dependent variable increases (moves
toward +1.0) or decreases (moves toward -1.0)
in a predictable fashion when the independent variable
increases. Correlational research seeks to establish a
relationship between variables that do not readily lend
themselves to experimental manipulation or control.
RCH 7301, Critical Thinking for Doctoral Learners 3
UNIT x STUDY GUIDE
Title
In a simple correlational study, a researcher gathers data about
two or more characteristics of a study
population. The numbers that are used reflect measurements of
the characteristics, such as customer
satisfaction ratings between two locations, employee
satisfaction ratings with and without a type of employer-
provided service, and so on. In a correlational study, each
characteristic has two identifying numbers that are
used to calculate the correlational coefficient (r). A perfect
correlation is +1.0 or -1.0. If the characteristics are
7. not related or are only remotely related, the coefficient is closer
to 0.
While a correlational relationship can be measured, it does not
imply a cause-and-effect relationship.
Researchers must be careful to avoid claiming causality, even if
a correlation close to +1.0 or -1.0 is found.
Influence can be present among correlating characteristics, but
researchers cannot infer a cause-and-effect
relationship based on correlation alone. Consider the following
example: The Earth’s atmospheric
temperature has demonstrably risen since pirates in tall ships
stopped sailing the high seas, but the absence
of pirates did not cause the rise in temperatures—even though
the correlation is close, if not perfect.
Correlational research can describe the homogeneity of
heterogeneity of the variables; it can describe the
degree to which the variables are intercorrelated by computing
the correlational coefficient r.
Quasi-Experimental and Experimental Quantitative Research
Experimental and quasi-experimental research is used to test a
hypothesis and, even further, an intervention
involved. An intervention is the main factor in experimental
research. To measure the effects of an
intervention, the researcher has to identify the variables and
discern the comparisons that are going to be
made between or within the group(s). Research must make
comparisons to examine relationships between
dependent and independent variables.
Experimental designs have an intervention, a control group, and
randomization of participants in the study’s
8. groups. A quasi-experimental design has an intervention, but it
has no randomization of participants in the
experimental and control groups.
Experimental
Design
Quasi-Experimental
Design
Intervention X X
Control Group X
Randomization of
Participants
X
Many experimental research designs measure a dependent
variable before and after an intervention, with
before and after measurements being the minimum. In a cross-
sectional study, data is collected at the before
and after points, so a cross-sectional design can work for a
project such as a dissertation study.
A good experimental or quasi-experimental quantitative
research design can aid you in answering the study’s
research question at the same time the design reduces threats to
the design’s validity. As a researcher,
asking and answering the following eight questions can help to
address key features of an experimental or
quasi-experimental research design.
9. • What is the research question, and will the study entail an
intervention?
• Rather than staging an intervention, will the researcher
observe participants and take
measurements?
• What are the variables?
• When and how often will the researcher collect data or take
measurements?
• What is the setting for the study?
• If the intervention study has multiple groups, how will the
researcher randomly assign participants to
the groups?
RCH 7301, Critical Thinking for Doctoral Learners 4
UNIT x STUDY GUIDE
Title
• If the study involves humans and an intervention, how will the
researcher, participants, and anyone
else involved in administrating the study be blinded from
knowing the groups to which participants
were assigned?
• What controls will be put into place to reduce the influence of
variables that are not involved in the
study?
10. Experimental research designs contain an intervention, so they
seek to answer questions about differences
(e.g., the difference between an outcome that is measured in
both the experimental and the control group).
On the other hand, correlational studies look at associations.
An experimental study is valid only if the following
characteristics are present:
• an intervention, where the researcher manipulates the
independent variable;
• control for the influence of variables not being measured in
the study, such as randomization and
control groups; and
• randomization, where the researcher randomly assigns each
participant so that a participant has a
50/50 chance of being assigned to either the intervention or the
control group. Randomization is
important to deducing the result of the intervention at the end of
the experiment.
Below, study two tables that present information about statistics
that examine differences and associations
between and among variables.
Name Test statistic Purpose Number of groups
Independent samples
t-test
11. t Test the difference
between the means of 2
independent groups.
2
Paired samples t-test t Test the difference
between the means of 2
paired groups (before
and after
measurements, which
are typical paired
samples t-tests).
2
One-way analysis of
variance (ANOVA)
F Test the difference
among means of >2
independent groups for
one independent
variable (that has >1
level).
> 2
Two-way analysis of
variance (ANOVA)
F Test the difference
among means for 2
independent variables,
where each can have >1
level.
12. > 2
Table 1. Quantitative research design: Statistics that examine
differences using an interval/ratio measurement
level
RCH 7301, Critical Thinking for Doctoral Learners 5
UNIT x STUDY GUIDE
Title
Name Test statistic Purpose Measurement of
dependent variable
Pearson product-
moment correlation
r Measure strength and
direction of relationship
between 2 variables.
Interval/ratio
Spearman rank-order
correlation
ρ Measure the strength
13. and direction of the
relationship between 2
variables
(nonparametric).
Ordinal, interval, or
ratio
Linear regression Predict the value of a
dependent variable,
and measure the size
of the effect of the
independent variable
on a dependent
variable while
controlling for
covariates.
Interval/ratio
Logistic regression This is the same as
linear, but it is used
when the dependent
variable is binary.
Binary/dichotomous
Table 2. Quantitative research design: Statistics that examine
associations
Refer to these tables in conference with your mentor and
dissertation chair to make decisions about
quantitative research designs.
14. References
Drummond, K. E., & Murphy-Reyes, A. (2018). Nutrition
research: Concepts and applications. Jones &
Bartlett Learning.
Creswell, J. W., & Creswell, J. D. (2018). Research design:
Qualitative, quantitative, and mixed methods
approaches (5th ed.). SAGE.
Oakshott, L. (2019). Essential quantitative methods: For
business, management and finance (7th ed.). Red
Globe Press.
Course Learning Outcomes for Unit VILearning
ActivityRequired Unit ResourcesUnit LessonQuantitative
Research DesignDescriptive Quantitative ResearchCorrelational
Quantitative ResearchQuasi-Experimental and Experimental
Quantitative ResearchReferences