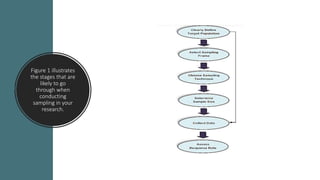
SlideShare a Scribd company logo
The Methods in
Quantitative Research
Practical Research 2
Research Methodology
Research methodology simply refers to the practical “how” of any given topic
of research. More specifically, it is about how a researcher systematically
designs a study to ensure valid and reliable results that address the research
aims and objectives.
For example,
how did the
researcher go
about
deciding:
WHAT DATA TO COLLECT (AND
WHAT DATA TO IGNORE)
WHO TO COLLECT IT FROM (IN
RESEARCH, THIS IS CALLED
“SAMPLING DESIGN”)
HOW TO COLLECT IT (THIS IS
CALLED “DATA COLLECTION
METHODS”)
HOW TO ANALYZE IT (THIS IS
CALLED “DATA ANALYSIS
METHODS”)
What are the
Methods of
Quantitative
Research?
The methods and techniques used in
writing research paper gauge to answer
the research questions and in collecting
data. Realizing the appropriate design
of your research is an initial act of your
study.
According to Sukamolson, (2007),
Survey research includes the use of
scientific sampling method with a
designed questionnaire to quantify a
given population's characteristics
using statistical methods.
Survey
More concisely Sukamolson, (2007) further describes survey as a form of
quantitative research that is concerned with ‘sampling questionnaire,
questionnaire design, questionnaire administration’ for the sake of gathering
information from the group/population under study, and then make analysis to
better understand their behavior and characteristics. In addition, Kraemer (1991)
outline three basic beliefs in survey research, such as survey which is used to
describe quantitatively a sectional aspect of a given populations that involves
studying the relationship, in survey research method, data are obtained from
people , and lastly, survey sample a part of population which is later used to
generalize the whole population, i.e a section of a population is sampled to
represent the whole population characteristics, viewpoint as well as opinion as
the case maybe.
Correlational
A quantitative methodology used to determine whether, and to what degree, a
relationship exists between two or more variables within a population (or a sample).
The degree of relationships is expressed by correlation coefficients. Coefficients range
from +1.00 to -1.00.
Higher correlations (coefficients closer to +1.00 or -1.00) indicate stronger
relationships.
Positive correlations indicate that as the values associated with one variable go up, so
do the values associated with the other.
Negative correlations indicate that as the values associated with one variable go up,
the values associated with the other go down.
Correlational
But tracing on this, Leedy & Ormrod (2010) remark that correlation
method of research deals with the creating relationship amid two or more
variables in the same population. “The first type of correlational design,
explanatory design, is conducted when researchers want to explore the
extents to which two or more variables co-vary, that is, where changes in
one variable are reflected in changes in the other (Creswell, 2008, p. 358).
The second type of correlational design, prediction design, is used by
researchers when the purpose of the study is to predict certain outcomes
in one variable from another variable that serves as the predictor.
Experimental
In the experimental research, the researcher investigates the treatment of an
intervention into the study group and then measures the outcomes of the treatment.
There are three types of exploratory approaches:
a. pre-experimental
b. true experimental
c. quasi-experimental
Experimental
According to Leedy & Ormrod, (2001). The pre-experimental design involves
an independent variable that does not vary or a control group that is not
randomly selected. Campbell and Stanley (1963) endorsed the true
experimental design, which provides a higher degree of control in the
experiment and produces a higher degree of validity. The true experimental
designs result in a systemic approach to quantitative data collection involving
mathematical models in the analyses.
Experimental
Whereas the quasi-experimental design involves nonrandom selection of study
participants. Therefore, control is limited, and true experimentation is not possible.
Since the variable cannot be controlled, validity may be sacrificed. The factorial
design focuses on two or more categories with the independent variables as
compared to the dependent variable (Vogt, 1999). Key, (1997) describes
experimental research as a form of research whereby a researcher takes control and
maintains the basic elements that might affect the result of an experiment, by so
doing; the researcher predicts the outcome of an experiment. While experimental
design is the synopsis that guides a researcher while testing his hypothesis inorder
to reach a tangible conclusion on the relationship concerning an independent
variable and a dependent variable.
Experimental
Experiment deals with the process of supporting,
rejecting, or validating a hypothesis to get insight
into the cause and effect of something when certain
factors are being manipulated. For example,
someone may carry out a basic experiment to
understand the existence of gravity while others
basically scientists carry out experiment for years
depending on the subject matter to be
experimented.
Causal-Comparative or Ex Post
Facto
According to Gay (1976), Ex post facto implies "from after the fact” which
means ex-post facto research, where the researcher investigates a
problem by studying the variables in survey. It is research in which the
dependent variable is immediately observable and now the main concern
is to find out the backgrounds that gave rise to this consequence. – In
addition, a causal-comparative study is a form of study that tries to
identify and determine the cause and effect of the relationship between
two or more groups where the researcher attempts to determine the
cause, or reason, for pre-existing differences in groups of individuals.
Here are the differences and similarities between causal-
comparative and correlational studies:
The causal-comparative study looks at differences between groups
whiles correlational study looks for relationships of variables within a
single group.
• Causal-comparative and correlational studies are similar in that both
used to examine relationships among variables.
Here are the differences and
similarities between causal-
comparative and correlational studies:
Causal comparative includes categorical independent
and or dependent variable but the correlational study
only includes quantitative variables.
• Causal-comparative research provides better evidence
of cause and effect relationships than correlational
research.
Like correlational research, causal-comparative research
is sometimes treated as a type of descriptive research
since it too describes conditions that already exist.
SAMPLING METHODS
Sampling means selecting from a huge number of
respondents or participants to answer your research
questions. The entire population is involved but for your
research study, you need to select only apart from the
whole because it is doubtful that researcher should be
able to collect data from all cases. Thus, there is a need to
select a sample. The entire set of cases from which
researcher sample is drawn in called the population.
Since, researchers neither have time nor the resources to
analysis the entire population so they apply sampling
technique to reduce the number of cases. (Taherdoost,
Hamed. 2016)
Figure 1 illustrates
the stages that are
likely to go
through when
conducting
sampling in your
research.
Sampling Process Steps
Stage 1: Clearly Define Target Population
• The first stage in the sampling process is to clearly
define target population. Population is commonly
related to the number of people living in a particular
country. In other words, this group of individuals, that
the intervention intends to conduct research in and
draw conclusions from.
Sampling Process Steps
A sampling frame is a list of the actual cases from which sample will be drawn. The
sampling frame must be representative of the population. The 'list' may be an actual
listing of units, as in a phone book from which phone numbers will be sampled, or some
other description of the population, such as a map from which areas will be sampled.
Stage2: Select Sampling Frame
Sampling Process Steps
Stage 3: Choose Sampling Technique
Before examining the different types of sampling method, it is important to note on what is meant by sampling
besides with reasons why researchers are likely to select a sample. Taking a division from chosen sampling frame or
entire population is called sampling. Sampling can be used to make inference about a population or to make
generalization in relation to existing theory. In essence, this depends on choice of sampling technique.
Sampling techniques can be divided into two types: The Probability or random sampling and the Non- probability or
non- random sampling. This was clearly discussed in the previous modules in the Practical Research 1 in the First
Semester.
Shows the
Sampling
Techniques
Sampling Process Steps
• Stage 4: Determine Sample Size
In order to simplify from a random sample and avoid sampling errors or
biases, a random sample needs to be of suitable size. What is suitable
depends on several issues which often confuse people doing surveys
for the first time. This is because what is important here is not the
proportion of the research population that gets sampled, but the
absolute size of the sample selected relative to the complexity of the
population, the aims of the researcher and the kinds of statistical
manipulation that will be used in data analysis.
Stage 5:
Collect Data
After having a target population, sampling frame, sampling
technique and sample size have been established, the next
step is to collect data coming from the subjects of your
research study.
Stage 6:
Assess
Response Rate
Response rate is the number of cases agreeing to take part in
the study. These cases are taken from original sample. In
reality, most researchers never achieve a 100 percent
response rate. Reasons for this might include refusal to
respond, ineligibility to respond, inability to respond, or the
respondent has been located but researchers are unable to
make contact. In sum, response rate is important because
each nonresponse is liable to bias the final sample. Clearly
defining sample, employing the right sampling technique,
and generating a large sample, in some respects can help to
reduce the likelihood of sample bias.
Developing an Instrument to Measure Research Skills
The main objective in conducting research for all students is to develop them as competent
researchers and acquired the knowledge and skills of conducting and disseminating his or
her research in a particular field of research. This has been the focus in most of the
programmes by research (Dodani & LaPorte (2008), Murtonen (2005) & Sveiby (2001).
The following are the five-phase model for
development of questionnaire:
Step I
A review of literature on the development of ability to conduct research was
carried out in this step. Therefore, researchers must be equipped with competence
in providing and selecting evidence on the components or construct of research to
be used in his/her study.
The review revealed that there were many components of research skills involved.
A few of the studies do develop their own instruments to measure the skills
(Gilmore & Feldon (2010), Kardash (2000), Powers & Enright (1987)). It is serious for
this study to measure adequately the knowledge and skills to conduct research, so
open ended items may not be suitable to adapt for the study.
The following are the five-phase model for
development of questionnaire:
Step I
Similarly instruments that are to be completed by an external observer to measure
the student research abilities were also felt not appropriate. This is because an
instrument that require student themselves to evaluate or self-Since none is found
suitable for the study, the researchers decided to develop one. A review was
carried out to identify the constructs of research skills that are deemed important
to conduct research. There were a range of skills necessary for research and there
were different labels being used for similar constructs.
Step II
After identifying the concept, and defining it operationally,
items were developed for each construct. Some of the items
from existing instruments which are available in the literature
were adapted. The rest of the items were developed by the
researchers based on the operational definition of the
construct. A Liker-type of scale was preferred where students
were asked to tick against each item.
Step III
The draft items were then reviewed by the researcher
and place the items according to the constructs it belongs
based using the operational definitions and sent to the
subject teacher for validation.
Step IV
The next phase, involved item analysis, using and the
output of the analysis on inter-correlations between
the items and its constructs. A few items were
deleted if it is not in line with the construct.
Step V
The reliability for each construct was again computed
to see the reliabilities of the constructs were
sufficiently high, the instrument is ready for use.
Research intervention is the heart of the study where strategies employed to minimize the problem handled by the researcher.
It is the treatment for the problem tackled by the researcher/s. It is characterized by both the design and development of
interventions. Design involves the specification of an intervention. This includes determining the extent to which an intervention
is daefined by explicit practice principles, goals, and activities needed for enhancement of the research conducted. Some
interventions are highly responsive to dialogue and the hermeneutics of exchange between intervention agents and participants
(Wolpe 1969).
What is Research
Intervention?
What is Research
Intervention?
The development of intervention is generally
coming from the interest of the researcher/s to
stop or help the problem to be solved.
Data Collection & Analysis
Procedure
Data collection is the process of gathering and
measuring information on variables of interest, in an
established systematic fashion that enables one to
answer stated research questions, test hypotheses, and
evaluate outcomes. The goal for all data collection is to
capture quality evidence that then translates to rich
data analysis and allows the building of a convincing
and credible answer to questions that have been
posed. An accurate data collection is essential to
maintaining the integrity of research (Kabir 2016).
Data Collection
& Analysis
Procedure
Quantitative data is numerical in nature and can be mathematically computed.
It measures the uses of different scales, which can be classified as nominal
scale, ordinal scale, interval scale and ratio scale. Quantitative approaches
address the ‘what’ of the program. They use a systematic standardized
approach and employ methods such as surveys and ask questions. These
approaches have an advantage that they are cheaper to implement and
consistent so comparisons can be easily made, and the size of the effect can
usually be measured. However, it is limited in the capacity for the investigation
and explanation of similarities and unexpected differences.
Data Collection & Analysis Procedure
The Quantitative data collection methods trust on random sampling and structured data
collection instruments that fit diverse experiences into programmed response categories.
They produce results that are easy to summarize, compare, and generalize. If the intent is to
generalize from the research participants to a larger population, the researcher will employ
probability sampling to select participants.
Ethical Norms
in data
collection
There are several reasons why it is
important to obey to ethical norms in
research.
1. Promote the aims of research, such as
knowledge, truth, and avoidance of error.
Example: Prohibitions against fabricating,
falsifying, or misrepresenting research
data promote the truth and avoid error.
Ethical Norms
in data
collection
2. Since research often involves a great deal of cooperation
and coordination among many different people in different
disciplines and institutions, ethical standards promote the
values that are essential to collaborative work, such as trust,
accountability, mutual respect, and fairness.
Example: Many ethical norms in research, such as guidelines
for authorship, copyright and patenting policies, data sharing
policies, and confidentiality rules in peer review, are
designed to protect intellectual property interests while
encouraging collaboration. Most researchers want to receive
credit for their contributions and do not want to have their
ideas stolen or disclosed prematurely.
Ethical Norms in data collection
3. Many of the ethical norms
help to ensure that researchers
can be held accountable to the
public.
4. Ethical norms in research also
help to build public support for
research. People more likely to
fund research project if they
can trust the quality and
integrity of research.
Ethical Norms in data collection
5. Many of the norms of research promote a variety of other important moral
and social values, such as social responsibility, human rights, animal welfare,
compliance with the law, and health and safety. Ethical lapses in research can
significantly harm human and animal subjects, students, and the public.
Example: A researcher who constructs data in a clinical trial may harm or even
kill patients and a researcher who fails to abide by regulations and guidelines
relating to radiation or biological safety may jeopardize his health and safety
or the health and safety of staff and students.
Guidelines in Writing Research Methodology
it is measured on how the researchers plan to tackle the research
problem.
It will provide a work plan and describe the activities necessary for
the completion of the project
explains what the researcher did and how you did it, allowing
readers to evaluate the reliability and validity of the research.
WHAT IS METHODOLOGY?
Research methodology is a set of systematic technique used in research. This
simply means a guide to research and how it is conducted. It describes and
analysis methods, throws more light on their limitations and resources,
clarify their pre-suppositions and consequences, relating their potentialities
to the twilight zone at the frontiers of knowledge (Igwenagu, Chinelo2016).
For quantitative studies, the method section
typically consists of the following sections:
1. Study design -Is it a questionnaire study or a laboratory experiment? What
kind of design do you choose (descriptive, cross-sectional, case-control)?
2. Selection of research location - (Where was the study conducted?)
3. Subjects or participants - Who will take part in your study? What kind of
sampling method / procedure do you use? You will need to decide on the
inclusion and exclusion criteria?
For quantitative studies, the method section typically
consists of the following sections:
4. Sample size – you need to calculate your sample size based on the
type of study you are conducting. There are several formulas for
sample size calculation.
5. Study instruments - What kind of measuring instruments or
questionnaires do you use? Why do you choose them? Are they valid
and reliable?
For quantitative studies, the
method section typically consists
of the following sections:
• 6. Data collection - How do you plan to carry out your study?
What activities are involved? How long does it take?
• 7. Data analysis and interpretation – this includes plans for
processing and coding data, computer software to be used
(eg Statistical Package for Social Sciences / SPSS, EPI-INFO,
etc), choice of statistical methods, confidence levels,
significance levels etc. It is also convenient to provide even
not final tables for the data you plan to analyze from your
study.
• 8. Ethical considerations – It is necessary to have a thorough
review of your work if it is in line with the ethics on research.
THE END

More Related Content

Similar to PR 2, WEEK 2.pptx

Rch 7301, critical thinking for doctoral learners 1
  Rch 7301, critical thinking for doctoral learners 1   Rch 7301, critical thinking for doctoral learners 1
Rch 7301, critical thinking for doctoral learners 1
ssuserfa5723
 
·IntroductionQuantitative research methodology uses a dedu.docx
·IntroductionQuantitative research methodology uses a dedu.docx·IntroductionQuantitative research methodology uses a dedu.docx
·IntroductionQuantitative research methodology uses a dedu.docx
lanagore871
 
Research Design and Sampling
Research Design and SamplingResearch Design and Sampling
Research Design and Sampling
Don Bosco College Sulthan Bathery
 
Research Design and Sampling
Research Design and SamplingResearch Design and Sampling
Research Design and Sampling
Don Bosco College Sulthan Bathery
 
Unit 2 types of research
Unit 2 types of researchUnit 2 types of research
Unit 2 types of research
Asima shahzadi
 
pengajian malaysia
pengajian malaysiapengajian malaysia
pengajian malaysia
Gowri Owshika
 
Coursework answers phd
Coursework answers phdCoursework answers phd
Coursework answers phd
coolhs03
 
phd course work answers
phd course work answersphd course work answers
phd course work answers
coolhs03
 
Experimental ProceduresThe specific experimental design procedur.docx
Experimental ProceduresThe specific experimental design procedur.docxExperimental ProceduresThe specific experimental design procedur.docx
Experimental ProceduresThe specific experimental design procedur.docx
gitagrimston
 
Research methodology
Research methodologyResearch methodology
Research methodology
ANCYBS
 
Causalcomparativeresearch 150312133324-conversion-gate01-converted
Causalcomparativeresearch 150312133324-conversion-gate01-convertedCausalcomparativeresearch 150312133324-conversion-gate01-converted
Causalcomparativeresearch 150312133324-conversion-gate01-converted
Dr. Hina Kaynat
 
#1 Characteristics, Strengths, Weaknesses, Kinds of.pptx
#1 Characteristics, Strengths, Weaknesses, Kinds of.pptx#1 Characteristics, Strengths, Weaknesses, Kinds of.pptx
#1 Characteristics, Strengths, Weaknesses, Kinds of.pptx
JessaMaeGastar1
 
Research methodology
Research methodologyResearch methodology
Research methodology
Devika Manulal
 
LESSON 11 and PR2.pptx
LESSON 11 and PR2.pptxLESSON 11 and PR2.pptx
LESSON 11 and PR2.pptx
JamaBustamante2
 
3. Research Methodologies
3. Research Methodologies3. Research Methodologies
3. Research Methodologies
Centro Escolar University
 
Reasrch methodology for MBA
Reasrch methodology for MBAReasrch methodology for MBA
Reasrch methodology for MBA
Rahul Rajan
 
CHAPTER 8 QUANTITATIVE METHODSWe turn now from the introductio
CHAPTER 8 QUANTITATIVE METHODSWe turn now from the introductioCHAPTER 8 QUANTITATIVE METHODSWe turn now from the introductio
CHAPTER 8 QUANTITATIVE METHODSWe turn now from the introductio
JinElias52
 
Chapter 3 research design
Chapter 3 research designChapter 3 research design
Chapter 3 research design
NiranjanHN3
 
Planning A Study: Spirit Week Survey
Planning A Study: Spirit Week SurveyPlanning A Study: Spirit Week Survey
Planning A Study: Spirit Week Survey
guesta957af1
 
Planning A Study - Spirit Week Survey
Planning A Study - Spirit Week SurveyPlanning A Study - Spirit Week Survey
Planning A Study - Spirit Week Survey
guesta957af1
 

Similar to PR 2, WEEK 2.pptx (20)

Rch 7301, critical thinking for doctoral learners 1
  Rch 7301, critical thinking for doctoral learners 1   Rch 7301, critical thinking for doctoral learners 1
Rch 7301, critical thinking for doctoral learners 1
 
·IntroductionQuantitative research methodology uses a dedu.docx
·IntroductionQuantitative research methodology uses a dedu.docx·IntroductionQuantitative research methodology uses a dedu.docx
·IntroductionQuantitative research methodology uses a dedu.docx
 
Research Design and Sampling
Research Design and SamplingResearch Design and Sampling
Research Design and Sampling
 
Research Design and Sampling
Research Design and SamplingResearch Design and Sampling
Research Design and Sampling
 
Unit 2 types of research
Unit 2 types of researchUnit 2 types of research
Unit 2 types of research
 
pengajian malaysia
pengajian malaysiapengajian malaysia
pengajian malaysia
 
Coursework answers phd
Coursework answers phdCoursework answers phd
Coursework answers phd
 
phd course work answers
phd course work answersphd course work answers
phd course work answers
 
Experimental ProceduresThe specific experimental design procedur.docx
Experimental ProceduresThe specific experimental design procedur.docxExperimental ProceduresThe specific experimental design procedur.docx
Experimental ProceduresThe specific experimental design procedur.docx
 
Research methodology
Research methodologyResearch methodology
Research methodology
 
Causalcomparativeresearch 150312133324-conversion-gate01-converted
Causalcomparativeresearch 150312133324-conversion-gate01-convertedCausalcomparativeresearch 150312133324-conversion-gate01-converted
Causalcomparativeresearch 150312133324-conversion-gate01-converted
 
#1 Characteristics, Strengths, Weaknesses, Kinds of.pptx
#1 Characteristics, Strengths, Weaknesses, Kinds of.pptx#1 Characteristics, Strengths, Weaknesses, Kinds of.pptx
#1 Characteristics, Strengths, Weaknesses, Kinds of.pptx
 
Research methodology
Research methodologyResearch methodology
Research methodology
 
LESSON 11 and PR2.pptx
LESSON 11 and PR2.pptxLESSON 11 and PR2.pptx
LESSON 11 and PR2.pptx
 
3. Research Methodologies
3. Research Methodologies3. Research Methodologies
3. Research Methodologies
 
Reasrch methodology for MBA
Reasrch methodology for MBAReasrch methodology for MBA
Reasrch methodology for MBA
 
CHAPTER 8 QUANTITATIVE METHODSWe turn now from the introductio
CHAPTER 8 QUANTITATIVE METHODSWe turn now from the introductioCHAPTER 8 QUANTITATIVE METHODSWe turn now from the introductio
CHAPTER 8 QUANTITATIVE METHODSWe turn now from the introductio
 
Chapter 3 research design
Chapter 3 research designChapter 3 research design
Chapter 3 research design
 
Planning A Study: Spirit Week Survey
Planning A Study: Spirit Week SurveyPlanning A Study: Spirit Week Survey
Planning A Study: Spirit Week Survey
 
Planning A Study - Spirit Week Survey
Planning A Study - Spirit Week SurveyPlanning A Study - Spirit Week Survey
Planning A Study - Spirit Week Survey
 

More from allandavecastrosibba

bri.pptx
bri.pptxbri.pptx
Lesson Week 1.pptx
Lesson Week 1.pptxLesson Week 1.pptx
Lesson Week 1.pptx
allandavecastrosibba
 
The-Standard-Trade-Model.pptx
The-Standard-Trade-Model.pptxThe-Standard-Trade-Model.pptx
The-Standard-Trade-Model.pptx
allandavecastrosibba
 
IE Presentation
IE PresentationIE Presentation
IE Presentation
allandavecastrosibba
 
I.E week 1.pptx
I.E week 1.pptxI.E week 1.pptx
I.E week 1.pptx
allandavecastrosibba
 
Exchange Rate Determination.pptx
Exchange Rate Determination.pptxExchange Rate Determination.pptx
Exchange Rate Determination.pptx
allandavecastrosibba
 
FACTORS AFFECTING DEMAND.pptx
FACTORS AFFECTING DEMAND.pptxFACTORS AFFECTING DEMAND.pptx
FACTORS AFFECTING DEMAND.pptx
allandavecastrosibba
 
identifyingtheinquiry.pptx
identifyingtheinquiry.pptxidentifyingtheinquiry.pptx
identifyingtheinquiry.pptx
allandavecastrosibba
 
Chapter 2 identyfying problem.pptx
Chapter 2 identyfying problem.pptxChapter 2 identyfying problem.pptx
Chapter 2 identyfying problem.pptx
allandavecastrosibba
 
Chapter 2 identyfying problem.pptx
Chapter 2 identyfying problem.pptxChapter 2 identyfying problem.pptx
Chapter 2 identyfying problem.pptx
allandavecastrosibba
 
SELECTING RESEARCH PROBLEM.pptx
SELECTING RESEARCH PROBLEM.pptxSELECTING RESEARCH PROBLEM.pptx
SELECTING RESEARCH PROBLEM.pptx
allandavecastrosibba
 
SELECTING RESEARCH PROBLEM.pptx
SELECTING RESEARCH PROBLEM.pptxSELECTING RESEARCH PROBLEM.pptx
SELECTING RESEARCH PROBLEM.pptx
allandavecastrosibba
 
qualitative vs.quanti.pptx
qualitative vs.quanti.pptxqualitative vs.quanti.pptx
qualitative vs.quanti.pptx
allandavecastrosibba
 
Introduction PR1 lesson.pptx
Introduction PR1 lesson.pptxIntroduction PR1 lesson.pptx
Introduction PR1 lesson.pptx
allandavecastrosibba
 
FACTORS AFFECTING DEMAND.pptx
FACTORS AFFECTING DEMAND.pptxFACTORS AFFECTING DEMAND.pptx
FACTORS AFFECTING DEMAND.pptx
allandavecastrosibba
 
TRENDS- Democratic Interventions.pptx
TRENDS- Democratic Interventions.pptxTRENDS- Democratic Interventions.pptx
TRENDS- Democratic Interventions.pptx
allandavecastrosibba
 

More from allandavecastrosibba (16)

bri.pptx
bri.pptxbri.pptx
bri.pptx
 
Lesson Week 1.pptx
Lesson Week 1.pptxLesson Week 1.pptx
Lesson Week 1.pptx
 
The-Standard-Trade-Model.pptx
The-Standard-Trade-Model.pptxThe-Standard-Trade-Model.pptx
The-Standard-Trade-Model.pptx
 
IE Presentation
IE PresentationIE Presentation
IE Presentation
 
I.E week 1.pptx
I.E week 1.pptxI.E week 1.pptx
I.E week 1.pptx
 
Exchange Rate Determination.pptx
Exchange Rate Determination.pptxExchange Rate Determination.pptx
Exchange Rate Determination.pptx
 
FACTORS AFFECTING DEMAND.pptx
FACTORS AFFECTING DEMAND.pptxFACTORS AFFECTING DEMAND.pptx
FACTORS AFFECTING DEMAND.pptx
 
identifyingtheinquiry.pptx
identifyingtheinquiry.pptxidentifyingtheinquiry.pptx
identifyingtheinquiry.pptx
 
Chapter 2 identyfying problem.pptx
Chapter 2 identyfying problem.pptxChapter 2 identyfying problem.pptx
Chapter 2 identyfying problem.pptx
 
Chapter 2 identyfying problem.pptx
Chapter 2 identyfying problem.pptxChapter 2 identyfying problem.pptx
Chapter 2 identyfying problem.pptx
 
SELECTING RESEARCH PROBLEM.pptx
SELECTING RESEARCH PROBLEM.pptxSELECTING RESEARCH PROBLEM.pptx
SELECTING RESEARCH PROBLEM.pptx
 
SELECTING RESEARCH PROBLEM.pptx
SELECTING RESEARCH PROBLEM.pptxSELECTING RESEARCH PROBLEM.pptx
SELECTING RESEARCH PROBLEM.pptx
 
qualitative vs.quanti.pptx
qualitative vs.quanti.pptxqualitative vs.quanti.pptx
qualitative vs.quanti.pptx
 
Introduction PR1 lesson.pptx
Introduction PR1 lesson.pptxIntroduction PR1 lesson.pptx
Introduction PR1 lesson.pptx
 
FACTORS AFFECTING DEMAND.pptx
FACTORS AFFECTING DEMAND.pptxFACTORS AFFECTING DEMAND.pptx
FACTORS AFFECTING DEMAND.pptx
 
TRENDS- Democratic Interventions.pptx
TRENDS- Democratic Interventions.pptxTRENDS- Democratic Interventions.pptx
TRENDS- Democratic Interventions.pptx
 

Recently uploaded

How to Fix the Import Error in the Odoo 17
How to Fix the Import Error in the Odoo 17How to Fix the Import Error in the Odoo 17
How to Fix the Import Error in the Odoo 17
Celine George
 
The History of Stoke Newington Street Names
The History of Stoke Newington Street NamesThe History of Stoke Newington Street Names
The History of Stoke Newington Street Names
History of Stoke Newington
 
BÀI TẬP BỔ TRỢ TIẾNG ANH 8 CẢ NĂM - GLOBAL SUCCESS - NĂM HỌC 2023-2024 (CÓ FI...
BÀI TẬP BỔ TRỢ TIẾNG ANH 8 CẢ NĂM - GLOBAL SUCCESS - NĂM HỌC 2023-2024 (CÓ FI...BÀI TẬP BỔ TRỢ TIẾNG ANH 8 CẢ NĂM - GLOBAL SUCCESS - NĂM HỌC 2023-2024 (CÓ FI...
BÀI TẬP BỔ TRỢ TIẾNG ANH 8 CẢ NĂM - GLOBAL SUCCESS - NĂM HỌC 2023-2024 (CÓ FI...
Nguyen Thanh Tu Collection
 
Smart-Money for SMC traders good time and ICT
Smart-Money for SMC traders good time and ICTSmart-Money for SMC traders good time and ICT
Smart-Money for SMC traders good time and ICT
simonomuemu
 
S1-Introduction-Biopesticides in ICM.pptx
S1-Introduction-Biopesticides in ICM.pptxS1-Introduction-Biopesticides in ICM.pptx
S1-Introduction-Biopesticides in ICM.pptx
tarandeep35
 
How to Build a Module in Odoo 17 Using the Scaffold Method
How to Build a Module in Odoo 17 Using the Scaffold MethodHow to Build a Module in Odoo 17 Using the Scaffold Method
How to Build a Module in Odoo 17 Using the Scaffold Method
Celine George
 
Advanced Java[Extra Concepts, Not Difficult].docx
Advanced Java[Extra Concepts, Not Difficult].docxAdvanced Java[Extra Concepts, Not Difficult].docx
Advanced Java[Extra Concepts, Not Difficult].docx
adhitya5119
 
C1 Rubenstein AP HuG xxxxxxxxxxxxxx.pptx
C1 Rubenstein AP HuG xxxxxxxxxxxxxx.pptxC1 Rubenstein AP HuG xxxxxxxxxxxxxx.pptx
C1 Rubenstein AP HuG xxxxxxxxxxxxxx.pptx
mulvey2
 
clinical examination of hip joint (1).pdf
clinical examination of hip joint (1).pdfclinical examination of hip joint (1).pdf
clinical examination of hip joint (1).pdf
Priyankaranawat4
 
ISO/IEC 27001, ISO/IEC 42001, and GDPR: Best Practices for Implementation and...
ISO/IEC 27001, ISO/IEC 42001, and GDPR: Best Practices for Implementation and...ISO/IEC 27001, ISO/IEC 42001, and GDPR: Best Practices for Implementation and...
ISO/IEC 27001, ISO/IEC 42001, and GDPR: Best Practices for Implementation and...
PECB
 
Life upper-Intermediate B2 Workbook for student
Life upper-Intermediate B2 Workbook for studentLife upper-Intermediate B2 Workbook for student
Life upper-Intermediate B2 Workbook for student
NgcHiNguyn25
 
Pengantar Penggunaan Flutter - Dart programming language1.pptx
Pengantar Penggunaan Flutter - Dart programming language1.pptxPengantar Penggunaan Flutter - Dart programming language1.pptx
Pengantar Penggunaan Flutter - Dart programming language1.pptx
Fajar Baskoro
 
বাংলাদেশ অর্থনৈতিক সমীক্ষা (Economic Review) ২০২৪ UJS App.pdf
বাংলাদেশ অর্থনৈতিক সমীক্ষা (Economic Review) ২০২৪ UJS App.pdfবাংলাদেশ অর্থনৈতিক সমীক্ষা (Economic Review) ২০২৪ UJS App.pdf
বাংলাদেশ অর্থনৈতিক সমীক্ষা (Economic Review) ২০২৪ UJS App.pdf
eBook.com.bd (প্রয়োজনীয় বাংলা বই)
 
MARY JANE WILSON, A “BOA MÃE” .
MARY JANE WILSON, A “BOA MÃE”           .MARY JANE WILSON, A “BOA MÃE”           .
MARY JANE WILSON, A “BOA MÃE” .
Colégio Santa Teresinha
 
Your Skill Boost Masterclass: Strategies for Effective Upskilling
Your Skill Boost Masterclass: Strategies for Effective UpskillingYour Skill Boost Masterclass: Strategies for Effective Upskilling
Your Skill Boost Masterclass: Strategies for Effective Upskilling
Excellence Foundation for South Sudan
 
LAND USE LAND COVER AND NDVI OF MIRZAPUR DISTRICT, UP
LAND USE LAND COVER AND NDVI OF MIRZAPUR DISTRICT, UPLAND USE LAND COVER AND NDVI OF MIRZAPUR DISTRICT, UP
LAND USE LAND COVER AND NDVI OF MIRZAPUR DISTRICT, UP
RAHUL
 
The Diamonds of 2023-2024 in the IGRA collection
The Diamonds of 2023-2024 in the IGRA collectionThe Diamonds of 2023-2024 in the IGRA collection
The Diamonds of 2023-2024 in the IGRA collection
Israel Genealogy Research Association
 
How to Add Chatter in the odoo 17 ERP Module
How to Add Chatter in the odoo 17 ERP ModuleHow to Add Chatter in the odoo 17 ERP Module
How to Add Chatter in the odoo 17 ERP Module
Celine George
 
How to Manage Your Lost Opportunities in Odoo 17 CRM
How to Manage Your Lost Opportunities in Odoo 17 CRMHow to Manage Your Lost Opportunities in Odoo 17 CRM
How to Manage Your Lost Opportunities in Odoo 17 CRM
Celine George
 
Film vocab for eal 3 students: Australia the movie
Film vocab for eal 3 students: Australia the movieFilm vocab for eal 3 students: Australia the movie
Film vocab for eal 3 students: Australia the movie
Nicholas Montgomery
 

Recently uploaded (20)

How to Fix the Import Error in the Odoo 17
How to Fix the Import Error in the Odoo 17How to Fix the Import Error in the Odoo 17
How to Fix the Import Error in the Odoo 17
 
The History of Stoke Newington Street Names
The History of Stoke Newington Street NamesThe History of Stoke Newington Street Names
The History of Stoke Newington Street Names
 
BÀI TẬP BỔ TRỢ TIẾNG ANH 8 CẢ NĂM - GLOBAL SUCCESS - NĂM HỌC 2023-2024 (CÓ FI...
BÀI TẬP BỔ TRỢ TIẾNG ANH 8 CẢ NĂM - GLOBAL SUCCESS - NĂM HỌC 2023-2024 (CÓ FI...BÀI TẬP BỔ TRỢ TIẾNG ANH 8 CẢ NĂM - GLOBAL SUCCESS - NĂM HỌC 2023-2024 (CÓ FI...
BÀI TẬP BỔ TRỢ TIẾNG ANH 8 CẢ NĂM - GLOBAL SUCCESS - NĂM HỌC 2023-2024 (CÓ FI...
 
Smart-Money for SMC traders good time and ICT
Smart-Money for SMC traders good time and ICTSmart-Money for SMC traders good time and ICT
Smart-Money for SMC traders good time and ICT
 
S1-Introduction-Biopesticides in ICM.pptx
S1-Introduction-Biopesticides in ICM.pptxS1-Introduction-Biopesticides in ICM.pptx
S1-Introduction-Biopesticides in ICM.pptx
 
How to Build a Module in Odoo 17 Using the Scaffold Method
How to Build a Module in Odoo 17 Using the Scaffold MethodHow to Build a Module in Odoo 17 Using the Scaffold Method
How to Build a Module in Odoo 17 Using the Scaffold Method
 
Advanced Java[Extra Concepts, Not Difficult].docx
Advanced Java[Extra Concepts, Not Difficult].docxAdvanced Java[Extra Concepts, Not Difficult].docx
Advanced Java[Extra Concepts, Not Difficult].docx
 
C1 Rubenstein AP HuG xxxxxxxxxxxxxx.pptx
C1 Rubenstein AP HuG xxxxxxxxxxxxxx.pptxC1 Rubenstein AP HuG xxxxxxxxxxxxxx.pptx
C1 Rubenstein AP HuG xxxxxxxxxxxxxx.pptx
 
clinical examination of hip joint (1).pdf
clinical examination of hip joint (1).pdfclinical examination of hip joint (1).pdf
clinical examination of hip joint (1).pdf
 
ISO/IEC 27001, ISO/IEC 42001, and GDPR: Best Practices for Implementation and...
ISO/IEC 27001, ISO/IEC 42001, and GDPR: Best Practices for Implementation and...ISO/IEC 27001, ISO/IEC 42001, and GDPR: Best Practices for Implementation and...
ISO/IEC 27001, ISO/IEC 42001, and GDPR: Best Practices for Implementation and...
 
Life upper-Intermediate B2 Workbook for student
Life upper-Intermediate B2 Workbook for studentLife upper-Intermediate B2 Workbook for student
Life upper-Intermediate B2 Workbook for student
 
Pengantar Penggunaan Flutter - Dart programming language1.pptx
Pengantar Penggunaan Flutter - Dart programming language1.pptxPengantar Penggunaan Flutter - Dart programming language1.pptx
Pengantar Penggunaan Flutter - Dart programming language1.pptx
 
বাংলাদেশ অর্থনৈতিক সমীক্ষা (Economic Review) ২০২৪ UJS App.pdf
বাংলাদেশ অর্থনৈতিক সমীক্ষা (Economic Review) ২০২৪ UJS App.pdfবাংলাদেশ অর্থনৈতিক সমীক্ষা (Economic Review) ২০২৪ UJS App.pdf
বাংলাদেশ অর্থনৈতিক সমীক্ষা (Economic Review) ২০২৪ UJS App.pdf
 
MARY JANE WILSON, A “BOA MÃE” .
MARY JANE WILSON, A “BOA MÃE”           .MARY JANE WILSON, A “BOA MÃE”           .
MARY JANE WILSON, A “BOA MÃE” .
 
Your Skill Boost Masterclass: Strategies for Effective Upskilling
Your Skill Boost Masterclass: Strategies for Effective UpskillingYour Skill Boost Masterclass: Strategies for Effective Upskilling
Your Skill Boost Masterclass: Strategies for Effective Upskilling
 
LAND USE LAND COVER AND NDVI OF MIRZAPUR DISTRICT, UP
LAND USE LAND COVER AND NDVI OF MIRZAPUR DISTRICT, UPLAND USE LAND COVER AND NDVI OF MIRZAPUR DISTRICT, UP
LAND USE LAND COVER AND NDVI OF MIRZAPUR DISTRICT, UP
 
The Diamonds of 2023-2024 in the IGRA collection
The Diamonds of 2023-2024 in the IGRA collectionThe Diamonds of 2023-2024 in the IGRA collection
The Diamonds of 2023-2024 in the IGRA collection
 
How to Add Chatter in the odoo 17 ERP Module
How to Add Chatter in the odoo 17 ERP ModuleHow to Add Chatter in the odoo 17 ERP Module
How to Add Chatter in the odoo 17 ERP Module
 
How to Manage Your Lost Opportunities in Odoo 17 CRM
How to Manage Your Lost Opportunities in Odoo 17 CRMHow to Manage Your Lost Opportunities in Odoo 17 CRM
How to Manage Your Lost Opportunities in Odoo 17 CRM
 
Film vocab for eal 3 students: Australia the movie
Film vocab for eal 3 students: Australia the movieFilm vocab for eal 3 students: Australia the movie
Film vocab for eal 3 students: Australia the movie
 

PR 2, WEEK 2.pptx

  • 1. The Methods in Quantitative Research Practical Research 2
  • 2. Research Methodology Research methodology simply refers to the practical “how” of any given topic of research. More specifically, it is about how a researcher systematically designs a study to ensure valid and reliable results that address the research aims and objectives.
  • 3. For example, how did the researcher go about deciding: WHAT DATA TO COLLECT (AND WHAT DATA TO IGNORE) WHO TO COLLECT IT FROM (IN RESEARCH, THIS IS CALLED “SAMPLING DESIGN”) HOW TO COLLECT IT (THIS IS CALLED “DATA COLLECTION METHODS”) HOW TO ANALYZE IT (THIS IS CALLED “DATA ANALYSIS METHODS”)
  • 4. What are the Methods of Quantitative Research? The methods and techniques used in writing research paper gauge to answer the research questions and in collecting data. Realizing the appropriate design of your research is an initial act of your study.
  • 5. According to Sukamolson, (2007), Survey research includes the use of scientific sampling method with a designed questionnaire to quantify a given population's characteristics using statistical methods.
  • 6. Survey More concisely Sukamolson, (2007) further describes survey as a form of quantitative research that is concerned with ‘sampling questionnaire, questionnaire design, questionnaire administration’ for the sake of gathering information from the group/population under study, and then make analysis to better understand their behavior and characteristics. In addition, Kraemer (1991) outline three basic beliefs in survey research, such as survey which is used to describe quantitatively a sectional aspect of a given populations that involves studying the relationship, in survey research method, data are obtained from people , and lastly, survey sample a part of population which is later used to generalize the whole population, i.e a section of a population is sampled to represent the whole population characteristics, viewpoint as well as opinion as the case maybe.
  • 7. Correlational A quantitative methodology used to determine whether, and to what degree, a relationship exists between two or more variables within a population (or a sample). The degree of relationships is expressed by correlation coefficients. Coefficients range from +1.00 to -1.00. Higher correlations (coefficients closer to +1.00 or -1.00) indicate stronger relationships. Positive correlations indicate that as the values associated with one variable go up, so do the values associated with the other. Negative correlations indicate that as the values associated with one variable go up, the values associated with the other go down.
  • 8. Correlational But tracing on this, Leedy & Ormrod (2010) remark that correlation method of research deals with the creating relationship amid two or more variables in the same population. “The first type of correlational design, explanatory design, is conducted when researchers want to explore the extents to which two or more variables co-vary, that is, where changes in one variable are reflected in changes in the other (Creswell, 2008, p. 358). The second type of correlational design, prediction design, is used by researchers when the purpose of the study is to predict certain outcomes in one variable from another variable that serves as the predictor.
  • 9. Experimental In the experimental research, the researcher investigates the treatment of an intervention into the study group and then measures the outcomes of the treatment. There are three types of exploratory approaches: a. pre-experimental b. true experimental c. quasi-experimental
  • 10. Experimental According to Leedy & Ormrod, (2001). The pre-experimental design involves an independent variable that does not vary or a control group that is not randomly selected. Campbell and Stanley (1963) endorsed the true experimental design, which provides a higher degree of control in the experiment and produces a higher degree of validity. The true experimental designs result in a systemic approach to quantitative data collection involving mathematical models in the analyses.
  • 11. Experimental Whereas the quasi-experimental design involves nonrandom selection of study participants. Therefore, control is limited, and true experimentation is not possible. Since the variable cannot be controlled, validity may be sacrificed. The factorial design focuses on two or more categories with the independent variables as compared to the dependent variable (Vogt, 1999). Key, (1997) describes experimental research as a form of research whereby a researcher takes control and maintains the basic elements that might affect the result of an experiment, by so doing; the researcher predicts the outcome of an experiment. While experimental design is the synopsis that guides a researcher while testing his hypothesis inorder to reach a tangible conclusion on the relationship concerning an independent variable and a dependent variable.
  • 12. Experimental Experiment deals with the process of supporting, rejecting, or validating a hypothesis to get insight into the cause and effect of something when certain factors are being manipulated. For example, someone may carry out a basic experiment to understand the existence of gravity while others basically scientists carry out experiment for years depending on the subject matter to be experimented.
  • 13. Causal-Comparative or Ex Post Facto According to Gay (1976), Ex post facto implies "from after the fact” which means ex-post facto research, where the researcher investigates a problem by studying the variables in survey. It is research in which the dependent variable is immediately observable and now the main concern is to find out the backgrounds that gave rise to this consequence. – In addition, a causal-comparative study is a form of study that tries to identify and determine the cause and effect of the relationship between two or more groups where the researcher attempts to determine the cause, or reason, for pre-existing differences in groups of individuals.
  • 14. Here are the differences and similarities between causal- comparative and correlational studies: The causal-comparative study looks at differences between groups whiles correlational study looks for relationships of variables within a single group. • Causal-comparative and correlational studies are similar in that both used to examine relationships among variables.
  • 15. Here are the differences and similarities between causal- comparative and correlational studies: Causal comparative includes categorical independent and or dependent variable but the correlational study only includes quantitative variables. • Causal-comparative research provides better evidence of cause and effect relationships than correlational research. Like correlational research, causal-comparative research is sometimes treated as a type of descriptive research since it too describes conditions that already exist.
  • 16. SAMPLING METHODS Sampling means selecting from a huge number of respondents or participants to answer your research questions. The entire population is involved but for your research study, you need to select only apart from the whole because it is doubtful that researcher should be able to collect data from all cases. Thus, there is a need to select a sample. The entire set of cases from which researcher sample is drawn in called the population. Since, researchers neither have time nor the resources to analysis the entire population so they apply sampling technique to reduce the number of cases. (Taherdoost, Hamed. 2016)
  • 17. Figure 1 illustrates the stages that are likely to go through when conducting sampling in your research.
  • 18. Sampling Process Steps Stage 1: Clearly Define Target Population • The first stage in the sampling process is to clearly define target population. Population is commonly related to the number of people living in a particular country. In other words, this group of individuals, that the intervention intends to conduct research in and draw conclusions from.
  • 19. Sampling Process Steps A sampling frame is a list of the actual cases from which sample will be drawn. The sampling frame must be representative of the population. The 'list' may be an actual listing of units, as in a phone book from which phone numbers will be sampled, or some other description of the population, such as a map from which areas will be sampled. Stage2: Select Sampling Frame
  • 20. Sampling Process Steps Stage 3: Choose Sampling Technique Before examining the different types of sampling method, it is important to note on what is meant by sampling besides with reasons why researchers are likely to select a sample. Taking a division from chosen sampling frame or entire population is called sampling. Sampling can be used to make inference about a population or to make generalization in relation to existing theory. In essence, this depends on choice of sampling technique. Sampling techniques can be divided into two types: The Probability or random sampling and the Non- probability or non- random sampling. This was clearly discussed in the previous modules in the Practical Research 1 in the First Semester.
  • 22. Sampling Process Steps • Stage 4: Determine Sample Size In order to simplify from a random sample and avoid sampling errors or biases, a random sample needs to be of suitable size. What is suitable depends on several issues which often confuse people doing surveys for the first time. This is because what is important here is not the proportion of the research population that gets sampled, but the absolute size of the sample selected relative to the complexity of the population, the aims of the researcher and the kinds of statistical manipulation that will be used in data analysis.
  • 23.
  • 24.
  • 25. Stage 5: Collect Data After having a target population, sampling frame, sampling technique and sample size have been established, the next step is to collect data coming from the subjects of your research study.
  • 26. Stage 6: Assess Response Rate Response rate is the number of cases agreeing to take part in the study. These cases are taken from original sample. In reality, most researchers never achieve a 100 percent response rate. Reasons for this might include refusal to respond, ineligibility to respond, inability to respond, or the respondent has been located but researchers are unable to make contact. In sum, response rate is important because each nonresponse is liable to bias the final sample. Clearly defining sample, employing the right sampling technique, and generating a large sample, in some respects can help to reduce the likelihood of sample bias.
  • 27. Developing an Instrument to Measure Research Skills The main objective in conducting research for all students is to develop them as competent researchers and acquired the knowledge and skills of conducting and disseminating his or her research in a particular field of research. This has been the focus in most of the programmes by research (Dodani & LaPorte (2008), Murtonen (2005) & Sveiby (2001).
  • 28. The following are the five-phase model for development of questionnaire: Step I A review of literature on the development of ability to conduct research was carried out in this step. Therefore, researchers must be equipped with competence in providing and selecting evidence on the components or construct of research to be used in his/her study. The review revealed that there were many components of research skills involved. A few of the studies do develop their own instruments to measure the skills (Gilmore & Feldon (2010), Kardash (2000), Powers & Enright (1987)). It is serious for this study to measure adequately the knowledge and skills to conduct research, so open ended items may not be suitable to adapt for the study.
  • 29. The following are the five-phase model for development of questionnaire: Step I Similarly instruments that are to be completed by an external observer to measure the student research abilities were also felt not appropriate. This is because an instrument that require student themselves to evaluate or self-Since none is found suitable for the study, the researchers decided to develop one. A review was carried out to identify the constructs of research skills that are deemed important to conduct research. There were a range of skills necessary for research and there were different labels being used for similar constructs.
  • 30. Step II After identifying the concept, and defining it operationally, items were developed for each construct. Some of the items from existing instruments which are available in the literature were adapted. The rest of the items were developed by the researchers based on the operational definition of the construct. A Liker-type of scale was preferred where students were asked to tick against each item.
  • 31. Step III The draft items were then reviewed by the researcher and place the items according to the constructs it belongs based using the operational definitions and sent to the subject teacher for validation.
  • 32. Step IV The next phase, involved item analysis, using and the output of the analysis on inter-correlations between the items and its constructs. A few items were deleted if it is not in line with the construct.
  • 33. Step V The reliability for each construct was again computed to see the reliabilities of the constructs were sufficiently high, the instrument is ready for use.
  • 34. Research intervention is the heart of the study where strategies employed to minimize the problem handled by the researcher. It is the treatment for the problem tackled by the researcher/s. It is characterized by both the design and development of interventions. Design involves the specification of an intervention. This includes determining the extent to which an intervention is daefined by explicit practice principles, goals, and activities needed for enhancement of the research conducted. Some interventions are highly responsive to dialogue and the hermeneutics of exchange between intervention agents and participants (Wolpe 1969). What is Research Intervention?
  • 35. What is Research Intervention? The development of intervention is generally coming from the interest of the researcher/s to stop or help the problem to be solved.
  • 36. Data Collection & Analysis Procedure Data collection is the process of gathering and measuring information on variables of interest, in an established systematic fashion that enables one to answer stated research questions, test hypotheses, and evaluate outcomes. The goal for all data collection is to capture quality evidence that then translates to rich data analysis and allows the building of a convincing and credible answer to questions that have been posed. An accurate data collection is essential to maintaining the integrity of research (Kabir 2016).
  • 37. Data Collection & Analysis Procedure Quantitative data is numerical in nature and can be mathematically computed. It measures the uses of different scales, which can be classified as nominal scale, ordinal scale, interval scale and ratio scale. Quantitative approaches address the ‘what’ of the program. They use a systematic standardized approach and employ methods such as surveys and ask questions. These approaches have an advantage that they are cheaper to implement and consistent so comparisons can be easily made, and the size of the effect can usually be measured. However, it is limited in the capacity for the investigation and explanation of similarities and unexpected differences.
  • 38. Data Collection & Analysis Procedure The Quantitative data collection methods trust on random sampling and structured data collection instruments that fit diverse experiences into programmed response categories. They produce results that are easy to summarize, compare, and generalize. If the intent is to generalize from the research participants to a larger population, the researcher will employ probability sampling to select participants.
  • 39. Ethical Norms in data collection There are several reasons why it is important to obey to ethical norms in research. 1. Promote the aims of research, such as knowledge, truth, and avoidance of error. Example: Prohibitions against fabricating, falsifying, or misrepresenting research data promote the truth and avoid error.
  • 40. Ethical Norms in data collection 2. Since research often involves a great deal of cooperation and coordination among many different people in different disciplines and institutions, ethical standards promote the values that are essential to collaborative work, such as trust, accountability, mutual respect, and fairness. Example: Many ethical norms in research, such as guidelines for authorship, copyright and patenting policies, data sharing policies, and confidentiality rules in peer review, are designed to protect intellectual property interests while encouraging collaboration. Most researchers want to receive credit for their contributions and do not want to have their ideas stolen or disclosed prematurely.
  • 41. Ethical Norms in data collection 3. Many of the ethical norms help to ensure that researchers can be held accountable to the public. 4. Ethical norms in research also help to build public support for research. People more likely to fund research project if they can trust the quality and integrity of research.
  • 42. Ethical Norms in data collection 5. Many of the norms of research promote a variety of other important moral and social values, such as social responsibility, human rights, animal welfare, compliance with the law, and health and safety. Ethical lapses in research can significantly harm human and animal subjects, students, and the public. Example: A researcher who constructs data in a clinical trial may harm or even kill patients and a researcher who fails to abide by regulations and guidelines relating to radiation or biological safety may jeopardize his health and safety or the health and safety of staff and students.
  • 43. Guidelines in Writing Research Methodology it is measured on how the researchers plan to tackle the research problem. It will provide a work plan and describe the activities necessary for the completion of the project explains what the researcher did and how you did it, allowing readers to evaluate the reliability and validity of the research.
  • 44. WHAT IS METHODOLOGY? Research methodology is a set of systematic technique used in research. This simply means a guide to research and how it is conducted. It describes and analysis methods, throws more light on their limitations and resources, clarify their pre-suppositions and consequences, relating their potentialities to the twilight zone at the frontiers of knowledge (Igwenagu, Chinelo2016).
  • 45. For quantitative studies, the method section typically consists of the following sections: 1. Study design -Is it a questionnaire study or a laboratory experiment? What kind of design do you choose (descriptive, cross-sectional, case-control)? 2. Selection of research location - (Where was the study conducted?) 3. Subjects or participants - Who will take part in your study? What kind of sampling method / procedure do you use? You will need to decide on the inclusion and exclusion criteria?
  • 46. For quantitative studies, the method section typically consists of the following sections: 4. Sample size – you need to calculate your sample size based on the type of study you are conducting. There are several formulas for sample size calculation. 5. Study instruments - What kind of measuring instruments or questionnaires do you use? Why do you choose them? Are they valid and reliable?
  • 47. For quantitative studies, the method section typically consists of the following sections: • 6. Data collection - How do you plan to carry out your study? What activities are involved? How long does it take? • 7. Data analysis and interpretation – this includes plans for processing and coding data, computer software to be used (eg Statistical Package for Social Sciences / SPSS, EPI-INFO, etc), choice of statistical methods, confidence levels, significance levels etc. It is also convenient to provide even not final tables for the data you plan to analyze from your study. • 8. Ethical considerations – It is necessary to have a thorough review of your work if it is in line with the ethics on research.