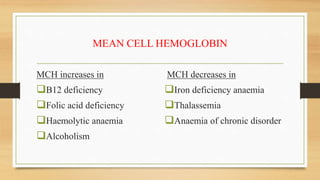
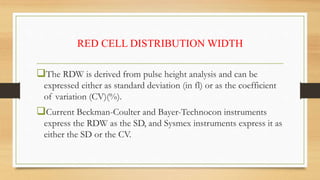
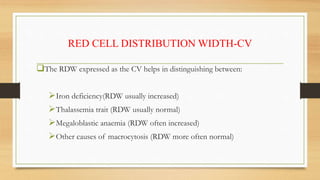
 RBC INDICES
Presented by- Dr. Sangita Jha
Moderator- Dr. Sheetal mam
CONTENT
INTRODUCTION
RBC INDICES-DEFINITION AND CALCULATION
APPLICATION OF RBC INDICES IN VARIOUS DISORDERS
SUMMARY
REFERENCE
OBJECTIVES
To define and calculate the RBC Indices.
To describe the application of RBC Indices in diagnosing
various disorders.
RBC INDEX
• It is a quantitative measurement of red blood cell, the amount and
concentration of haemoglobin in them.
• They were first introduced by Wintrobe in 1929 to define the size
(MCV) and haemoglobin content (MCH & MCHC) of red blood
cells.
• More recently Red cell Distribution Width (RDW) has been included
DEFINITION:
MEAN CELL VOLUME (MCV)
It is the measure of average volume of RBCs
MEAN CELL HEMOGLOBIN (MCH)
It is a measurement of the average weight of haemoglobin in individual
erythrocytes
DEFINITION:
MEAN CELL HEMOGLOBIN CONCENTRATION (MCHC)
It is the average concentration of haemoglobin in erythrocytes in a decilitre
of erythrocytes.
RED CELL DISTRIBUTION WIDTH (RDW)
It is a measure of variability of erythrocyte size.
WHY RBC INDICES ARE REQUIRED?
To classify the erythrocytes by their volume and Haemoglobin content.
The indices suggest how the RBC would look microscopically and provide
significant information. (Most commonly for Anaemia diagnosis)
Laboratory professionals correlate the indices with haematocrit (Hct),
haemoglobin levels and RBC count to ensure that technical problems are
identified when they occur.
MEAN CELL VOLUME
It is the average size of the red cells.
MCV = PCV in % X 10 .
RBC count ( 1012/L ) in million/cmm
MCV is expressed in femtoliters or fl (10 -15 of a liter).
MCV is a measurement of volume whereas estimation of size of
flattened cells is a measurement of cell diameter. Cell diameter and
volume are not same.
Normocytic : 80-100 fl
Microcytic : Red cells with reduced volume (< 80 fl)
Macrocytic: Red cells with an increased volume ( >100 fl)
Thus eg, if the PCV is 0.45(i.e. 0.45 litres of red cells per
litre of blood) and the RBC is 5 x 10 12 = 90 femtolitres(fl)
Volume of 1 cell =0.45 /5 x 1012 = 90 femtolitres
MEAN CELL VOLUME
MCV VALUES AND DIFFERENT TYPES OF
ANAEMIA
Decreased (microcytic;
low MCV)
Normal(normocytic;
normal MCV)
Increased(macrocytic;
high MCV)
Iron deficiency anaemia Acute blood loss Megaloblastic anaemia
Lead poisoning Anaemia of chronic disease Hypothyroidism
Sideroblastic anaemia Enzyme defects(eg.G6PD
deficiency)
Liver disease
Thalassemia Acute haemolysis Folic acid deficiency
MEAN CELL HAEMOGLOBIN(MCH)
Average amount of haemoglobin in a single red cell.
MCH= Haemoglobin in grams/dl X 10
 Red cell count in millions/cmm
MCH is expressed in picograms or pg.
Reference range is 27-32 pg.
MEAN CELL HEMOGLOBIN
MCH increases in
B12 deficiency
Folic acid deficiency
Haemolytic anaemia
Alcoholism
MCH decreases in
Iron deficiency anaemia
Thalassemia
Anaemia of chronic disorder
MEAN CELL HAEMOGLOBIN
CONCENTRATION(MCHC)
Concentration of haemoglobin in 1 dl or 1 litre of packed red cells
Expressed in grams/dl or grams /litre
MCHC= Haemoglobin in grams/dl
PCV in %
Reference range is 30-35 grams/dl
MEAN CELL HAEMOGLOBIN
CONCENTRATION(MCHC)
MCHC corresponds with degree of haemoglobinization of red
cells on a blood smear
If MCHC is normal, red cell is normochromic
If low, red cell is hypochromic
MCHC is raised in HEREDITARY SPHEROCYTOSIS and is
decreased in hypochromic anaemia.
RED CELL DISTRIBUTION WIDTH
The RDW is derived from pulse height analysis and can be
expressed either as standard deviation (in fl) or as the coefficient
of variation (CV)(%).
Current Beckman-Coulter and Bayer-Technocon instruments
express the RDW as the SD, and Sysmex instruments express it as
either the SD or the CV.
RED CELL DISTRIBUTION WIDTH-CV
The RDW expressed as the CV helps in distinguishing between:
Iron deficiency(RDW usually increased)
Thalassemia trait (RDW usually normal)
Megaloblastic anaemia (RDW often increased)
Other causes of macrocytosis (RDW more often normal)
RED CELL DISTRIBUTION WIDTH-CV
Normal value : 11.5 – 14.5 %
Increased value indicates ANISOCYTOSIS.
Combination of low MCV and high RDW is one of the best
screening test for the Iron deficiency anaemia
RED CELL
DISTRIBUTION
WIDTH-SD
The determination of RDW-SD is an
actual measurement of the width of
the erythrocyte distribution curve.
This measurement is performed at a
relative height of 20% above the
baseline.
The wider the curve is spread by
erythrocytes of different sizes, the
higher the RDW-SD value will be.
Reference values-35-45fl.
APPLICATION OF RED CELL DISTRIBUTION
WIDTH
The RDW is a red cell measurement that quantitates cellular
volume heterogeneity reflecting the range of red cell sizes within a
sample
RDW is proposed to be useful in early classification of anaemias
as it becomes abnormal earlier in nutrition deficiency anaemias
especially iron deficiency anaemia
APPLICATIONS OF RED CELL DISTRIBUTION
WIDTH
RDW is also useful in identifying red cell fragmentation,
agglutination or dimorphic cell populations(including patients
who have had transfusions, sideroblastic anaemias or have been
recently treated for a nutritional deficiency)
DIFFERENTIAL DIAGNOSIS OF ANAEMIAS BASED ON MCV AND RDW
MCV RDW CAUSES
1.NORMAL HIGH Early Iron Deficiency Anaemia
2. LOW HIGH Iron deficiency anaemia
3.LOW NORMAL Thalassemia
4. NORMAL NORMAL Anaemia of chronic disease, hereditary spherocytosis
5. HIGH HIGH Megaloblastic anaemia , Immune haemolytic anaemia
LIMITATIONS OF RBC INDICES
Though the test for RBC INDICES is cost effective and simple, it has its
own limitations. Such as,
 It is a screening test not a diagnostic test.
 MCV is not reliable when Anisocytosis is present.
 In dimorphic anaemia again MCV is not reliable.
 MCV does not reflect the diameter of the RBC, it is a volume of RBC.
 False high or false low value which should be evaluated further.
LIMITATIONS OF RBC INDICES
• RDW as a major variable has limited utility as they are not specific
in separating heterozygous thalassemia from iron deficiency
anaemia alone , since to conclude parameters like iron and
haemoglobin studies would still be needed.
SUMMARY
RBC index (MCV , MCH, MCHC) and RBC count helps in
diagnosis of anaemia.
Combination of various RBC indices (MCV , MCH, and
MCHC) especially with RDW is useful in differential diagnosis
of anaemia.
REFERENCES
• Mc Kenzie SB, Williams JL.Clinical laboratory haematology.3rd
edition.New jersey:Pearson education inc;2015
• Lippincott Williams & Wilkins,Wintrobe’s clinical
haematology.Twelfth edition,2009
• Frank Firkin,Colin Chesterman, David Penington & Brian Rush. De
Gruchy’s clinical haematology.5th edition, Australia, 2003
• Bain BJ,Bates I,Laffan MA,Dacie and Lewis SM,Practical
haematology.11th edition.Netherlands:Elsevier;2012
RBC INDICES final.pptx

RBC INDICES final.pptx

  • 1.
     RBC INDICES Presentedby- Dr. Sangita Jha Moderator- Dr. Sheetal mam
  • 2.
    CONTENT INTRODUCTION RBC INDICES-DEFINITION ANDCALCULATION APPLICATION OF RBC INDICES IN VARIOUS DISORDERS SUMMARY REFERENCE
  • 3.
    OBJECTIVES To define andcalculate the RBC Indices. To describe the application of RBC Indices in diagnosing various disorders.
  • 4.
    RBC INDEX • Itis a quantitative measurement of red blood cell, the amount and concentration of haemoglobin in them. • They were first introduced by Wintrobe in 1929 to define the size (MCV) and haemoglobin content (MCH & MCHC) of red blood cells. • More recently Red cell Distribution Width (RDW) has been included
  • 5.
    DEFINITION: MEAN CELL VOLUME(MCV) It is the measure of average volume of RBCs MEAN CELL HEMOGLOBIN (MCH) It is a measurement of the average weight of haemoglobin in individual erythrocytes
  • 6.
    DEFINITION: MEAN CELL HEMOGLOBINCONCENTRATION (MCHC) It is the average concentration of haemoglobin in erythrocytes in a decilitre of erythrocytes. RED CELL DISTRIBUTION WIDTH (RDW) It is a measure of variability of erythrocyte size.
  • 7.
    WHY RBC INDICESARE REQUIRED? To classify the erythrocytes by their volume and Haemoglobin content. The indices suggest how the RBC would look microscopically and provide significant information. (Most commonly for Anaemia diagnosis) Laboratory professionals correlate the indices with haematocrit (Hct), haemoglobin levels and RBC count to ensure that technical problems are identified when they occur.
  • 8.
    MEAN CELL VOLUME Itis the average size of the red cells. MCV = PCV in % X 10 . RBC count ( 1012/L ) in million/cmm MCV is expressed in femtoliters or fl (10 -15 of a liter). MCV is a measurement of volume whereas estimation of size of flattened cells is a measurement of cell diameter. Cell diameter and volume are not same.
  • 9.
    Normocytic : 80-100fl Microcytic : Red cells with reduced volume (< 80 fl) Macrocytic: Red cells with an increased volume ( >100 fl) Thus eg, if the PCV is 0.45(i.e. 0.45 litres of red cells per litre of blood) and the RBC is 5 x 10 12 = 90 femtolitres(fl) Volume of 1 cell =0.45 /5 x 1012 = 90 femtolitres MEAN CELL VOLUME
  • 11.
    MCV VALUES ANDDIFFERENT TYPES OF ANAEMIA Decreased (microcytic; low MCV) Normal(normocytic; normal MCV) Increased(macrocytic; high MCV) Iron deficiency anaemia Acute blood loss Megaloblastic anaemia Lead poisoning Anaemia of chronic disease Hypothyroidism Sideroblastic anaemia Enzyme defects(eg.G6PD deficiency) Liver disease Thalassemia Acute haemolysis Folic acid deficiency
  • 12.
    MEAN CELL HAEMOGLOBIN(MCH) Averageamount of haemoglobin in a single red cell. MCH= Haemoglobin in grams/dl X 10  Red cell count in millions/cmm MCH is expressed in picograms or pg. Reference range is 27-32 pg.
  • 13.
    MEAN CELL HEMOGLOBIN MCHincreases in B12 deficiency Folic acid deficiency Haemolytic anaemia Alcoholism MCH decreases in Iron deficiency anaemia Thalassemia Anaemia of chronic disorder
  • 14.
    MEAN CELL HAEMOGLOBIN CONCENTRATION(MCHC) Concentrationof haemoglobin in 1 dl or 1 litre of packed red cells Expressed in grams/dl or grams /litre MCHC= Haemoglobin in grams/dl PCV in % Reference range is 30-35 grams/dl
  • 16.
    MEAN CELL HAEMOGLOBIN CONCENTRATION(MCHC) MCHCcorresponds with degree of haemoglobinization of red cells on a blood smear If MCHC is normal, red cell is normochromic If low, red cell is hypochromic MCHC is raised in HEREDITARY SPHEROCYTOSIS and is decreased in hypochromic anaemia.
  • 17.
    RED CELL DISTRIBUTIONWIDTH The RDW is derived from pulse height analysis and can be expressed either as standard deviation (in fl) or as the coefficient of variation (CV)(%). Current Beckman-Coulter and Bayer-Technocon instruments express the RDW as the SD, and Sysmex instruments express it as either the SD or the CV.
  • 18.
    RED CELL DISTRIBUTIONWIDTH-CV The RDW expressed as the CV helps in distinguishing between: Iron deficiency(RDW usually increased) Thalassemia trait (RDW usually normal) Megaloblastic anaemia (RDW often increased) Other causes of macrocytosis (RDW more often normal)
  • 19.
    RED CELL DISTRIBUTIONWIDTH-CV Normal value : 11.5 – 14.5 % Increased value indicates ANISOCYTOSIS. Combination of low MCV and high RDW is one of the best screening test for the Iron deficiency anaemia
  • 20.
    RED CELL DISTRIBUTION WIDTH-SD The determinationof RDW-SD is an actual measurement of the width of the erythrocyte distribution curve. This measurement is performed at a relative height of 20% above the baseline. The wider the curve is spread by erythrocytes of different sizes, the higher the RDW-SD value will be. Reference values-35-45fl.
  • 21.
    APPLICATION OF REDCELL DISTRIBUTION WIDTH The RDW is a red cell measurement that quantitates cellular volume heterogeneity reflecting the range of red cell sizes within a sample RDW is proposed to be useful in early classification of anaemias as it becomes abnormal earlier in nutrition deficiency anaemias especially iron deficiency anaemia
  • 22.
    APPLICATIONS OF REDCELL DISTRIBUTION WIDTH RDW is also useful in identifying red cell fragmentation, agglutination or dimorphic cell populations(including patients who have had transfusions, sideroblastic anaemias or have been recently treated for a nutritional deficiency)
  • 23.
    DIFFERENTIAL DIAGNOSIS OFANAEMIAS BASED ON MCV AND RDW MCV RDW CAUSES 1.NORMAL HIGH Early Iron Deficiency Anaemia 2. LOW HIGH Iron deficiency anaemia 3.LOW NORMAL Thalassemia 4. NORMAL NORMAL Anaemia of chronic disease, hereditary spherocytosis 5. HIGH HIGH Megaloblastic anaemia , Immune haemolytic anaemia
  • 24.
    LIMITATIONS OF RBCINDICES Though the test for RBC INDICES is cost effective and simple, it has its own limitations. Such as,  It is a screening test not a diagnostic test.  MCV is not reliable when Anisocytosis is present.  In dimorphic anaemia again MCV is not reliable.  MCV does not reflect the diameter of the RBC, it is a volume of RBC.  False high or false low value which should be evaluated further.
  • 25.
    LIMITATIONS OF RBCINDICES • RDW as a major variable has limited utility as they are not specific in separating heterozygous thalassemia from iron deficiency anaemia alone , since to conclude parameters like iron and haemoglobin studies would still be needed.
  • 26.
    SUMMARY RBC index (MCV, MCH, MCHC) and RBC count helps in diagnosis of anaemia. Combination of various RBC indices (MCV , MCH, and MCHC) especially with RDW is useful in differential diagnosis of anaemia.
  • 27.
    REFERENCES • Mc KenzieSB, Williams JL.Clinical laboratory haematology.3rd edition.New jersey:Pearson education inc;2015 • Lippincott Williams & Wilkins,Wintrobe’s clinical haematology.Twelfth edition,2009 • Frank Firkin,Colin Chesterman, David Penington & Brian Rush. De Gruchy’s clinical haematology.5th edition, Australia, 2003 • Bain BJ,Bates I,Laffan MA,Dacie and Lewis SM,Practical haematology.11th edition.Netherlands:Elsevier;2012

Editor's Notes

  • #18 of the measurements of the red cell volume.