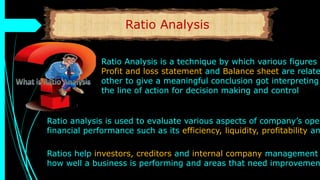
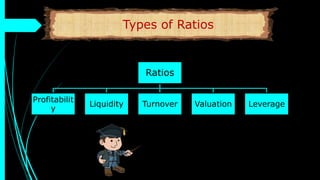
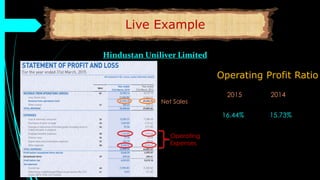
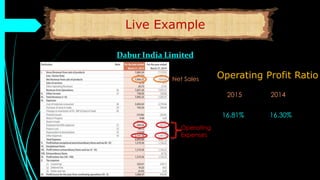
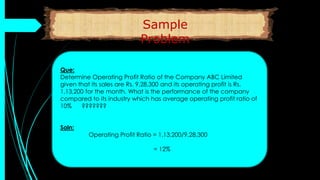
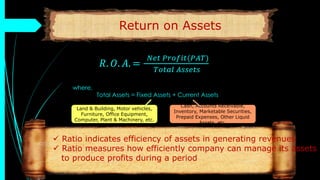
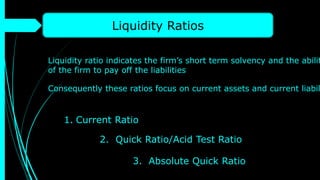
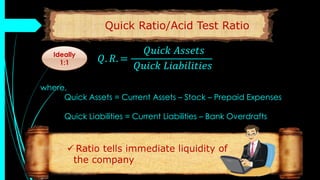
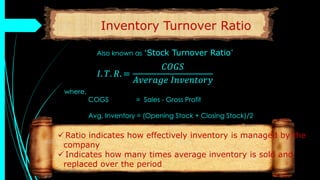
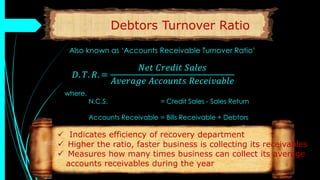
Ratio Analysis
Ratio Analysis is a technique by which various figures i
Profit and loss statement and Balance sheet are relate
other to give a meaningful conclusion got interpreting
the line of action for decision making and control
Ratio analysis is used to evaluate various aspects of company’s oper
financial performance such as its efficiency, liquidity, profitability an
Ratios help investors, creditors and internal company management
how well a business is performing and areas that need improvemen
Types of Ratios
Ratios
Profitabilit
y
Liquidity Turnover Valuation Leverage
Profitability Ratios
 Ratio communicates profitability of the event that
have already taken place
 Ratio shows how well a company can achieve
profits from its operations
 It gives insight on company’s ability to
generate income
Operations
Profitability Ratios
Gross Profit Ratio
Net Profit Ratio
Operating Ratio
Return on Assets
Return on Capital Employed
Return on Equity
Let’s discuss the ratios
one by one
G. P. 𝑅. =
𝐺𝑟𝑜𝑠𝑠 𝑃𝑟𝑜𝑓𝑖𝑡
𝑁𝑒𝑡 𝑆𝑎𝑙𝑒𝑠
 Ratio indicates efficiency of production department
 One of the popular tool to evaluate the operational
performance of the business
where,
Gross Profit = Net Sales - COGS
Raw Material Cost, Direct Labour Cost, Purchase of
Finished Goods
Factory Overhead Expenses, Increase/Decrease in
Inventory, etc.
Gross Profit
Ratio
Live Example
Hindustan Uniliver Limited
Gross Profit Ratio
2015 2014
15.97% 15.04%
COGS
Net Sales
Live Example
Dabur India Limited
Net Sales
COGS
Gross Profit Ratio
2015 2014
16.06% 15.84%
Analysis
Company/Year 2015 2014 2013 2012
HUL 15.97% 15.04% 14.59% 13.89%
DABUR 16.06% 15.84% 15.66% 15.72%
Year wise Gross Profit Ratio of the Companies
Gross Profit Ratio of FMCG sector for year 2015 is 16.72%
GPR
HUL 19.80%
INDUSTRY 17%
Check IF(F5>F6,TRUE,FALSE)
Excel
ABC limited is a small manufacturing company. Compute the
Gross Profit Ratio (GP Ratio) of the Company.
Gross Sales Rs. 10,00,000
Sales Returns 90,000
Opening Stock 2,00,000
Purchases 5,90,000
Purchases Returns 70,000
Closing Stock 45,000
Sample
Problem
Soln:
Sample
Problem
Net Profit Ratio
N. P. 𝑅. =
𝑁𝑒𝑡 𝑃𝑟𝑜𝑓𝑖𝑡
𝑁𝑒𝑡 𝑆𝑎𝑙𝑒𝑠
where,
Net Profit = Gross Profit – Total Expenses
 Shows overall efficiency of the business
 All non-operating revenues and expenses are not taken into acco
because the purpose of this ratio is to evaluate the profitability of
the business from its primary operation.
Total Revenue –
COGS
Operating Exp.
+ Interest Exp. +
Taxes
Live Example
Hindustan Uniliver Limited
Net Profit Ratio
2015 2014
Net Sales
Net Profit
13.39% 13.23%
Live Example
Dabur India Limited
Net Profit Ratio
Net Sales
Net Profit
2015 2014
13.61% 12.88%
Analysis
Company/Year 2015 2014 2013 2012
HUL 13.40% 13.23% 13.90% 11.77%
DABUR 13.61% 12.88% 12.17% 12.02%
Year wise Net Profit Ratio of the Companies
Net Profit Ratio of FMCG sector for year 2015 is 15.07%
Compute Net Profit Ratio for ABC Limited.
Sales Rs. 2,10,000
Returns Inward 10,000
Gross Profit 80,000
Admin. Expenses 15,000
Selling Expenses 15,000
Interest on Investment 8,000
Loss on Account of Fire 6,000
Income Tax 5,000
Sample
Problem
Soln:
Sample
Problem
Operating Profit Ratio
O. P. 𝑅. =
𝑂𝑝𝑒𝑟𝑎𝑡𝑖𝑛𝑔 𝑃𝑟𝑜𝑓𝑖𝑡
𝑁𝑒𝑡 𝑆𝑎𝑙𝑒𝑠
where,
Operating Profit = Gross Profit – Operating Expenses
Accounting E,
License E, Office
E,
Advertising,
Supplies,
Utilities,
Insurance,
Property Taxes,
etc.
Indicates pure profit generated by operations, i.e., how
businesses are supporting their operations
Live Example
Hindustan Uniliver Limited
Operating
Expenses
Net Sales
Operating Profit Ratio
2015 2014
16.44% 15.73%
Live Example
Dabur India Limited
Operating
Expenses
Net Sales Operating Profit Ratio
2015 2014
16.81% 16.30%
Analysis
Company/Year 2015 2014 2013 2012
HUL 16.44% 15.73% 15.18% 14.40%
DABUR 16.81% 16.30% 16.67% 16.77%
Year wise Operating Profit Ratio of the Companies
Operating Profit Ratio for FMCG sector 2015 is 19.09%
Que:
Determine Operating Profit Ratio of the Company ABC Limited
given that its sales are Rs. 9,28,300 and its operating profit is Rs.
1,13,200 for the month. What is the performance of the company
compared to its industry which has average operating profit ratio of
10% ???????
Soln:
Operating Profit Ratio = 1,13,200/9,28,300
= 12%
Sample
Problem
Return on Assets
𝑅. 𝑂. 𝐴. =
𝑁𝑒𝑡 𝑃𝑟𝑜𝑓𝑖𝑡(𝑃𝐴𝑇)
𝑇𝑜𝑡𝑎𝑙 𝐴𝑠𝑠𝑒𝑡𝑠
where,
Total Assets = Fixed Assets + Current Assets
 Ratio indicates efficiency of assets in generating revenues
 Ratio measures how efficiently company can manage its assets
to produce profits during a period
Land & Building, Motor vehicles,
Furniture, Office Equipment,
Computer, Plant & Machinery, etc.
Cash, Accounts Receivable,
Inventory, Marketable Securities,
Prepaid Expenses, Other Liquid
Assets, etc.
Live Example
Hindustan Uniliver Limited
ROA
2015 2014
32.85% 32.04%
Net Profit Total Assets
Live Example
Dabur India Limited
ROA
2015 2014
18.96% 19.61%
Net Profit Total Assets
Analysis
Company/Year 2015 2014 2013 2012
HUL 32.85% 32.04% 34.43% 26.01%
DABUR 18.96% 19.61% 19.70% 17.65%
Year wise Return on Assets Ratio of the Companies
Return on Assets Ratio for FMCG sector 2015 is 26.82%
Que:
Total assets of the Company ABC Limited on April 1, 2014 and
March 31, 2015 were Rs. 21,32,000 and Rs. 24,34,000 respectively.
During the year ended March 31, 2015 it earned net income of Rs.
2,13,000. Calculate its return on assets ratio ?????
Soln:
Average Total Assets = (21,32,000+24,34,000)/2
= 22,83,000
Return on Assets = 2,13,000/22,83,000
= 0.09
= 9%
Sample
Problem
𝑅. 𝑂. 𝐸. =
𝑁𝑒𝑡 𝑃𝑟𝑜𝑓𝑖𝑡
𝑆ℎ𝑎𝑟𝑒ℎ𝑜𝑙𝑑𝑒𝑟′ 𝑠 𝐸𝑞𝑢𝑖𝑡𝑦
where,
Shareholder’s Equity = Share Capital
+ Reserves and Surplus
 Ratio is an indicator of how effective management is at using
equity financing to fund operations and grow the company
Return on Equity
Live Example
Hindustan Uniliver Limited
Net Profit
S E
ROE
2015 2014
131.2% 124.8%
Live Example
Dabur India Limited
Net Profit
S E
ROE
2015 2014
37.22% 40.68%
Analysis
Company/Year 2015 2014 2013 2012
HUL 131.20% 124.80% 124.25% 88.14%
DABUR 37.22% 40.68% 44.87% 45.31%
Year wise Return on Equity Ratio of the Companies
Return on Equity Ratio for FMCG sector 2015 is 58.87%
Sample
Problem
Que:
ABC Limited have assets and liabilities of Rs. 23,42,000 and Rs.
13,83,000. During the year end it made a profit of Rs. 2,42,000.
Calculate ROE of the Company.
Soln:
Shareholder’s Equity = 23,42,000-13,83,000
= 9,59,000
Return on Equity = 2,42,000/9,59,000
= 25.23%
Liquidity Ratios
Liquidity ratio indicates the firm’s short term solvency and the abilit
of the firm to pay off the liabilities
Consequently these ratios focus on current assets and current liabil
1. Current Ratio
2. Quick Ratio/Acid Test Ratio
3. Absolute Quick Ratio
Current Ratio
𝐶. 𝑅. =
𝐶𝑢𝑟𝑟𝑒𝑛𝑡 𝐴𝑠𝑠𝑒𝑡𝑠
𝐶𝑢𝑟𝑟𝑒𝑛𝑡 𝐿𝑖𝑎𝑏𝑖𝑙𝑖𝑡𝑖𝑒𝑠
where,
Current Assets
S. Debtors, Cash or Bank, Bills Receivable,
Prepaid Expenses, Closing Stock, Advances,
Marketable Securities
S. Creditors, Bills Payable, Outstanding
Expenses, Bank Overdraft
Current Liabilities
 Ratio tells capabilities of the company to
discharge short term liabilities
Ideally
2:1
Quick Ratio/Acid Test Ratio
𝑄. 𝑅. =
𝑄𝑢𝑖𝑐𝑘 𝐴𝑠𝑠𝑒𝑡𝑠
𝑄𝑢𝑖𝑐𝑘 𝐿𝑖𝑎𝑏𝑖𝑙𝑖𝑡𝑖𝑒𝑠
where,
Quick Assets = Current Assets – Stock – Prepaid Expenses
Quick Liabilities = Current Liabilities – Bank Overdrafts
 Ratio tells immediate liquidity of
the company
Ideally
1:1
Absolute Quick Ratio
𝐴. 𝐶. 𝑅. =
𝐴𝑏𝑠𝑜𝑙𝑢𝑡𝑒 𝐿𝑖𝑞𝑢𝑖𝑑 𝐴𝑠𝑠𝑒𝑡𝑠
𝐶𝑢𝑟𝑟𝑒𝑛𝑡 𝐿𝑖𝑎𝑏𝑖𝑙𝑖𝑡𝑖𝑒𝑠
where,
Absolute Liquid Assets = Cash + Bank + Marketable Securities
Ideally
1:2
 Ratio extends the logic further and eliminates
accounts receivable(sundry debtors and bills
receivable).
Turnover Ratios
Ratios measures the effectiveness with which the firm uses its reso
It indicates how efficiently and effectively assets of the firm being u
1. Working Capital Turnover Ratio
2. Inventory/Stock Turnover Ratio
3. Debtors/Accounts Receivable Turnover Ratio
4. Creditors/Accounts Payable Turnover Rati
5.Total Assets Turnover Ratio
6. Capital Turnover Ratio
Working Capital Turnover Ratio
𝐴 = 𝜋𝑟2
= 𝜋𝑟2
𝑊. 𝐶. 𝑇. 𝑅. =
𝑁𝑒𝑡 𝑆𝑎𝑙𝑒𝑠
𝑊𝑜𝑟𝑘𝑖𝑛𝑔 𝐶𝑎𝑝𝑖𝑡𝑎𝑙
where,
Net Sales = Sales – Sales Return
Working Capital = Current Assets – Current Liabilities
 Ratio indicates working capital management of the company
 Indicates how efficiently company is using capital to generate sale
 Higher WCTR shows company is generating lot of sales compared
to the money it uses to fund the sales
Cash, Accounts Receivable,
Inventory, Marketable Securities,
Prepaid Expenses, Other Liquid
Assets, etc.
Short Term Debt, Accounts
payable, Accrued Liabilities Other
Debts, etc.
Inventory Turnover Ratio
Also known as ‘Stock Turnover Ratio’
where,
COGS = Sales - Gross Profit
Avg. Inventory = (Opening Stock + Closing Stock)/2
 Ratio indicates how effectively inventory is managed by the
company
 Indicates how many times average inventory is sold and
replaced over the period
𝐼. 𝑇. 𝑅. =
𝐶𝑂𝐺𝑆
𝐴𝑣𝑒𝑟𝑎𝑔𝑒 𝐼𝑛𝑣𝑒𝑛𝑡𝑜𝑟𝑦
Debtors Turnover Ratio
Also known as ‘Accounts Receivable Turnover Ratio’
𝐷. 𝑇. 𝑅. =
𝑁𝑒𝑡 𝐶𝑟𝑒𝑑𝑖𝑡 𝑆𝑎𝑙𝑒𝑠
𝐴𝑣𝑒𝑟𝑎𝑔𝑒 𝐴𝑐𝑐𝑜𝑢𝑛𝑡𝑠 𝑅𝑒𝑐𝑒𝑖𝑣𝑎𝑏𝑙𝑒
where,
N.C.S. = Credit Sales - Sales Return
Accounts Receivable = Bills Receivable + Debtors
 Indicates efficiency of recovery department
 Higher the ratio, faster business is collecting its receivables
 Measures how many times business can collect its average
accounts receivables during the year
Creditors Turnover Ratio
Also known as ‘Accounts Payable Turnover Ratio’
𝐶. 𝑇. 𝑅. =
𝑁𝑒𝑡 𝐶𝑟𝑒𝑑𝑖𝑡 𝑃𝑢𝑟𝑐ℎ𝑎𝑠𝑒
𝐴𝑣𝑒𝑟𝑎𝑔𝑒 𝐴𝑐𝑐𝑜𝑢𝑛𝑡𝑠 𝑃𝑎𝑦𝑎𝑏𝑙𝑒
where,
N.C.P. = Credit Purchase - Purchase Return
Accounts Payable = Bills Payable + Creditors
 Indicates credit given by suppliers
 Higher ratio means company paying to creditors quickly
 Measures how many times company can pay off its average
accounts payable balance during the year
Assets Turnover Ratio
𝐴. 𝑇. 𝑅. =
𝑁𝑒𝑡 𝑆𝑎𝑙𝑒𝑠
𝑇𝑜𝑡𝑎𝑙 𝐴𝑠𝑠𝑒𝑡𝑠
where,
Net Sales = Sales - Sales Return
Total Assets = Fixed Assets + Current Assets
Ratio indicates how efficiently a company
can use its assets to generate sales
Land & Building, Motor vehicles,
Furniture, Office Equipment,
Computer, Plant & Machinery, etc.
Cash, Accounts Receivable,
Inventory, Marketable Securities,
Prepaid Expenses, Other Liquid
Assets, etc.
Capital Turnover Ratio
C. 𝑇. 𝑅. =
𝑁𝑒𝑡 𝑆𝑎𝑙𝑒𝑠
𝐶𝑎𝑝𝑖𝑡𝑎𝑙 𝐸𝑚𝑝𝑙𝑜𝑦𝑒𝑑
where,
Net Sales = Sales - Sales Return
Capital Employed = Share Capital + Reserves & Surplus
+ Long Term Loans + Debentures
+ Working Capital
Indicates efficiency of the organization with which
capital employed is being utilized to generate revenue
Valuation Ratios
It is a measure of how cheap or expensive a business is, compared t
some measures of profit or value
1. Earning Per Share
2. Price Earning Ratio
3. Price Sale Ratio
4. Dividend Payout Ratio
Let’s discuss the ratios
one by one
Earning Per Share
E. P. 𝑆. =
𝑁𝑒𝑡 𝐼𝑛𝑐𝑜𝑚𝑒−𝑃𝑟𝑒𝑓𝑒𝑟𝑟𝑒𝑑 𝐷𝑖𝑣𝑖𝑑𝑒𝑛𝑑𝑠
𝑁𝑜. 𝑜𝑓 𝑆ℎ𝑎𝑟𝑒𝑠 𝑂𝑢𝑡𝑠𝑡𝑎𝑛𝑑𝑖𝑛𝑔
Indicates amount of money each share of stock would
receive if all of the profits were distributed to the
outstanding shares at the end of the year
Price Earning Ratio
P. 𝐸. 𝑅. =
𝑀𝑎𝑟𝑘𝑒𝑡 𝑃𝑟𝑖𝑐𝑒 𝑃𝑒𝑟 𝑆ℎ𝑎𝑟𝑒
𝐸𝑎𝑟𝑛𝑖𝑛𝑔 𝑃𝑒𝑟 𝑆ℎ𝑎𝑟𝑒
Shows how much a market is willing to pay
for a stock based on its current earnings
Dividend Payout Ratio
Explains the relationship between earnings belongs to
the shareholders and the amount finally paid to them
in the form of dividend
𝐷. 𝑃. 𝑅. =
𝐷𝑖𝑣𝑖𝑑𝑒𝑛𝑑 𝑃𝑒𝑟 𝑆ℎ𝑎𝑟𝑒
𝐸𝑎𝑟𝑛𝑖𝑛𝑔 𝑃𝑒𝑟 𝑆ℎ𝑎𝑟𝑒
Price Sale Ratio
P. 𝑆. 𝑅. =
𝑆𝑡𝑜𝑐𝑘 𝑃𝑟𝑖𝑐𝑒
𝑆𝑎𝑙𝑒𝑠 𝑝𝑒𝑟 𝑆ℎ𝑎𝑟𝑒
 Compares company’s stock price with revenue
 More relevant comparing companies of same sector
 It is initiated when earnings of the company are
negative
 Low ratio indicates undervaluation while overvalued
above the average
Leverage/Solvency Ratios
Ability of the firm to use fixed costs to magnify the returns to the shareh
Debt-Equity Ratio
Interest Coverage Ratio
Fixed Charge Coverage Ratio
Total Debt Ratio
Let’s discuss the ratios
one by one
Debt-Equity Ratio
𝐷. 𝐸. 𝑅. =
𝑇𝑜𝑡𝑎𝑙 𝐿𝑖𝑎𝑏𝑖𝑙𝑖𝑡𝑖𝑒𝑠
𝑇𝑜𝑡𝑎𝑙 𝐸𝑞𝑢𝑖𝑡𝑦
 Ratio shows the percentage of the company financing that come
from the creditors and investors.
 Higher ratio indicates that more creditors financing(bank loans)
is used than investors financing(shareholders).
Interest Coverage Ratio
𝐼. 𝐶. 𝑅. =
𝑃𝐵𝐼𝑇
𝐼𝑛𝑡𝑒𝑟𝑒𝑠𝑡 𝐶ℎ𝑎𝑟𝑔𝑒𝑠
 The ability of the company to pay of its interest on its outstandin
debt
 Higher ratio shows that a company can pay of its interest expens
several times over
 Lower ratio is a strong indicator that a company may default on
its loan payments
Fixed Charge Coverage Ratio
𝐹. 𝐶. 𝐶. 𝑅. =
𝐸𝐵𝐼𝑇 + 𝐹𝑖𝑥𝑒𝑑 𝐶ℎ𝑎𝑟𝑔𝑒𝑠 𝐵𝑒𝑓𝑜𝑟𝑒 𝑇𝑎𝑥𝑒𝑠
𝐹𝑖𝑥𝑒𝑑 𝐶ℎ𝑎𝑟𝑔𝑒𝑠 𝐵𝑒𝑓𝑜𝑟𝑒 𝑇𝑎𝑥𝑒𝑠 + 𝐼𝑛𝑡𝑒𝑟𝑒𝑠𝑡
 Shows firm’s ability to pay all of its fixed charges or expenses
with its income before interest and taxes
 Higher ratio indicates healthier and less risky business to invest
in or loan to
Total Debt Ratio
𝑇. 𝐷. 𝑅. =
𝑇𝑜𝑡𝑎𝑙 𝐿𝑖𝑎𝑏𝑖𝑙𝑖𝑡𝑖𝑒𝑠
𝑇𝑜𝑡𝑎𝑙 𝐴𝑠𝑠𝑒𝑡𝑠
where,
Total Liabilities = Total Debt + Current Liabilities
Total Assets = Fixed Assets + Current Assets
 Indicates company’s ability to pay of its liabilities with its assets
 Higher ratio indicates more risk to the lenders
Ratio Analysis

Ratio Analysis

  • 2.
    Ratio Analysis Ratio Analysisis a technique by which various figures i Profit and loss statement and Balance sheet are relate other to give a meaningful conclusion got interpreting the line of action for decision making and control Ratio analysis is used to evaluate various aspects of company’s oper financial performance such as its efficiency, liquidity, profitability an Ratios help investors, creditors and internal company management how well a business is performing and areas that need improvemen
  • 3.
  • 4.
    Profitability Ratios  Ratiocommunicates profitability of the event that have already taken place  Ratio shows how well a company can achieve profits from its operations  It gives insight on company’s ability to generate income Operations
  • 5.
    Profitability Ratios Gross ProfitRatio Net Profit Ratio Operating Ratio Return on Assets Return on Capital Employed Return on Equity Let’s discuss the ratios one by one
  • 6.
    G. P. 𝑅.= 𝐺𝑟𝑜𝑠𝑠 𝑃𝑟𝑜𝑓𝑖𝑡 𝑁𝑒𝑡 𝑆𝑎𝑙𝑒𝑠  Ratio indicates efficiency of production department  One of the popular tool to evaluate the operational performance of the business where, Gross Profit = Net Sales - COGS Raw Material Cost, Direct Labour Cost, Purchase of Finished Goods Factory Overhead Expenses, Increase/Decrease in Inventory, etc. Gross Profit Ratio
  • 7.
    Live Example Hindustan UniliverLimited Gross Profit Ratio 2015 2014 15.97% 15.04% COGS Net Sales
  • 8.
    Live Example Dabur IndiaLimited Net Sales COGS Gross Profit Ratio 2015 2014 16.06% 15.84%
  • 9.
    Analysis Company/Year 2015 20142013 2012 HUL 15.97% 15.04% 14.59% 13.89% DABUR 16.06% 15.84% 15.66% 15.72% Year wise Gross Profit Ratio of the Companies Gross Profit Ratio of FMCG sector for year 2015 is 16.72%
  • 10.
    GPR HUL 19.80% INDUSTRY 17% CheckIF(F5>F6,TRUE,FALSE) Excel
  • 11.
    ABC limited isa small manufacturing company. Compute the Gross Profit Ratio (GP Ratio) of the Company. Gross Sales Rs. 10,00,000 Sales Returns 90,000 Opening Stock 2,00,000 Purchases 5,90,000 Purchases Returns 70,000 Closing Stock 45,000 Sample Problem
  • 12.
  • 13.
    Net Profit Ratio N.P. 𝑅. = 𝑁𝑒𝑡 𝑃𝑟𝑜𝑓𝑖𝑡 𝑁𝑒𝑡 𝑆𝑎𝑙𝑒𝑠 where, Net Profit = Gross Profit – Total Expenses  Shows overall efficiency of the business  All non-operating revenues and expenses are not taken into acco because the purpose of this ratio is to evaluate the profitability of the business from its primary operation. Total Revenue – COGS Operating Exp. + Interest Exp. + Taxes
  • 14.
    Live Example Hindustan UniliverLimited Net Profit Ratio 2015 2014 Net Sales Net Profit 13.39% 13.23%
  • 15.
    Live Example Dabur IndiaLimited Net Profit Ratio Net Sales Net Profit 2015 2014 13.61% 12.88%
  • 16.
    Analysis Company/Year 2015 20142013 2012 HUL 13.40% 13.23% 13.90% 11.77% DABUR 13.61% 12.88% 12.17% 12.02% Year wise Net Profit Ratio of the Companies Net Profit Ratio of FMCG sector for year 2015 is 15.07%
  • 17.
    Compute Net ProfitRatio for ABC Limited. Sales Rs. 2,10,000 Returns Inward 10,000 Gross Profit 80,000 Admin. Expenses 15,000 Selling Expenses 15,000 Interest on Investment 8,000 Loss on Account of Fire 6,000 Income Tax 5,000 Sample Problem
  • 18.
  • 19.
    Operating Profit Ratio O.P. 𝑅. = 𝑂𝑝𝑒𝑟𝑎𝑡𝑖𝑛𝑔 𝑃𝑟𝑜𝑓𝑖𝑡 𝑁𝑒𝑡 𝑆𝑎𝑙𝑒𝑠 where, Operating Profit = Gross Profit – Operating Expenses Accounting E, License E, Office E, Advertising, Supplies, Utilities, Insurance, Property Taxes, etc. Indicates pure profit generated by operations, i.e., how businesses are supporting their operations
  • 20.
    Live Example Hindustan UniliverLimited Operating Expenses Net Sales Operating Profit Ratio 2015 2014 16.44% 15.73%
  • 21.
    Live Example Dabur IndiaLimited Operating Expenses Net Sales Operating Profit Ratio 2015 2014 16.81% 16.30%
  • 22.
    Analysis Company/Year 2015 20142013 2012 HUL 16.44% 15.73% 15.18% 14.40% DABUR 16.81% 16.30% 16.67% 16.77% Year wise Operating Profit Ratio of the Companies Operating Profit Ratio for FMCG sector 2015 is 19.09%
  • 23.
    Que: Determine Operating ProfitRatio of the Company ABC Limited given that its sales are Rs. 9,28,300 and its operating profit is Rs. 1,13,200 for the month. What is the performance of the company compared to its industry which has average operating profit ratio of 10% ??????? Soln: Operating Profit Ratio = 1,13,200/9,28,300 = 12% Sample Problem
  • 24.
    Return on Assets 𝑅.𝑂. 𝐴. = 𝑁𝑒𝑡 𝑃𝑟𝑜𝑓𝑖𝑡(𝑃𝐴𝑇) 𝑇𝑜𝑡𝑎𝑙 𝐴𝑠𝑠𝑒𝑡𝑠 where, Total Assets = Fixed Assets + Current Assets  Ratio indicates efficiency of assets in generating revenues  Ratio measures how efficiently company can manage its assets to produce profits during a period Land & Building, Motor vehicles, Furniture, Office Equipment, Computer, Plant & Machinery, etc. Cash, Accounts Receivable, Inventory, Marketable Securities, Prepaid Expenses, Other Liquid Assets, etc.
  • 25.
    Live Example Hindustan UniliverLimited ROA 2015 2014 32.85% 32.04% Net Profit Total Assets
  • 26.
    Live Example Dabur IndiaLimited ROA 2015 2014 18.96% 19.61% Net Profit Total Assets
  • 27.
    Analysis Company/Year 2015 20142013 2012 HUL 32.85% 32.04% 34.43% 26.01% DABUR 18.96% 19.61% 19.70% 17.65% Year wise Return on Assets Ratio of the Companies Return on Assets Ratio for FMCG sector 2015 is 26.82%
  • 28.
    Que: Total assets ofthe Company ABC Limited on April 1, 2014 and March 31, 2015 were Rs. 21,32,000 and Rs. 24,34,000 respectively. During the year ended March 31, 2015 it earned net income of Rs. 2,13,000. Calculate its return on assets ratio ????? Soln: Average Total Assets = (21,32,000+24,34,000)/2 = 22,83,000 Return on Assets = 2,13,000/22,83,000 = 0.09 = 9% Sample Problem
  • 29.
    𝑅. 𝑂. 𝐸.= 𝑁𝑒𝑡 𝑃𝑟𝑜𝑓𝑖𝑡 𝑆ℎ𝑎𝑟𝑒ℎ𝑜𝑙𝑑𝑒𝑟′ 𝑠 𝐸𝑞𝑢𝑖𝑡𝑦 where, Shareholder’s Equity = Share Capital + Reserves and Surplus  Ratio is an indicator of how effective management is at using equity financing to fund operations and grow the company Return on Equity
  • 30.
    Live Example Hindustan UniliverLimited Net Profit S E ROE 2015 2014 131.2% 124.8%
  • 31.
    Live Example Dabur IndiaLimited Net Profit S E ROE 2015 2014 37.22% 40.68%
  • 32.
    Analysis Company/Year 2015 20142013 2012 HUL 131.20% 124.80% 124.25% 88.14% DABUR 37.22% 40.68% 44.87% 45.31% Year wise Return on Equity Ratio of the Companies Return on Equity Ratio for FMCG sector 2015 is 58.87%
  • 33.
    Sample Problem Que: ABC Limited haveassets and liabilities of Rs. 23,42,000 and Rs. 13,83,000. During the year end it made a profit of Rs. 2,42,000. Calculate ROE of the Company. Soln: Shareholder’s Equity = 23,42,000-13,83,000 = 9,59,000 Return on Equity = 2,42,000/9,59,000 = 25.23%
  • 34.
    Liquidity Ratios Liquidity ratioindicates the firm’s short term solvency and the abilit of the firm to pay off the liabilities Consequently these ratios focus on current assets and current liabil 1. Current Ratio 2. Quick Ratio/Acid Test Ratio 3. Absolute Quick Ratio
  • 35.
    Current Ratio 𝐶. 𝑅.= 𝐶𝑢𝑟𝑟𝑒𝑛𝑡 𝐴𝑠𝑠𝑒𝑡𝑠 𝐶𝑢𝑟𝑟𝑒𝑛𝑡 𝐿𝑖𝑎𝑏𝑖𝑙𝑖𝑡𝑖𝑒𝑠 where, Current Assets S. Debtors, Cash or Bank, Bills Receivable, Prepaid Expenses, Closing Stock, Advances, Marketable Securities S. Creditors, Bills Payable, Outstanding Expenses, Bank Overdraft Current Liabilities  Ratio tells capabilities of the company to discharge short term liabilities Ideally 2:1
  • 36.
    Quick Ratio/Acid TestRatio 𝑄. 𝑅. = 𝑄𝑢𝑖𝑐𝑘 𝐴𝑠𝑠𝑒𝑡𝑠 𝑄𝑢𝑖𝑐𝑘 𝐿𝑖𝑎𝑏𝑖𝑙𝑖𝑡𝑖𝑒𝑠 where, Quick Assets = Current Assets – Stock – Prepaid Expenses Quick Liabilities = Current Liabilities – Bank Overdrafts  Ratio tells immediate liquidity of the company Ideally 1:1
  • 37.
    Absolute Quick Ratio 𝐴.𝐶. 𝑅. = 𝐴𝑏𝑠𝑜𝑙𝑢𝑡𝑒 𝐿𝑖𝑞𝑢𝑖𝑑 𝐴𝑠𝑠𝑒𝑡𝑠 𝐶𝑢𝑟𝑟𝑒𝑛𝑡 𝐿𝑖𝑎𝑏𝑖𝑙𝑖𝑡𝑖𝑒𝑠 where, Absolute Liquid Assets = Cash + Bank + Marketable Securities Ideally 1:2  Ratio extends the logic further and eliminates accounts receivable(sundry debtors and bills receivable).
  • 38.
    Turnover Ratios Ratios measuresthe effectiveness with which the firm uses its reso It indicates how efficiently and effectively assets of the firm being u 1. Working Capital Turnover Ratio 2. Inventory/Stock Turnover Ratio 3. Debtors/Accounts Receivable Turnover Ratio 4. Creditors/Accounts Payable Turnover Rati 5.Total Assets Turnover Ratio 6. Capital Turnover Ratio
  • 39.
    Working Capital TurnoverRatio 𝐴 = 𝜋𝑟2 = 𝜋𝑟2 𝑊. 𝐶. 𝑇. 𝑅. = 𝑁𝑒𝑡 𝑆𝑎𝑙𝑒𝑠 𝑊𝑜𝑟𝑘𝑖𝑛𝑔 𝐶𝑎𝑝𝑖𝑡𝑎𝑙 where, Net Sales = Sales – Sales Return Working Capital = Current Assets – Current Liabilities  Ratio indicates working capital management of the company  Indicates how efficiently company is using capital to generate sale  Higher WCTR shows company is generating lot of sales compared to the money it uses to fund the sales Cash, Accounts Receivable, Inventory, Marketable Securities, Prepaid Expenses, Other Liquid Assets, etc. Short Term Debt, Accounts payable, Accrued Liabilities Other Debts, etc.
  • 40.
    Inventory Turnover Ratio Alsoknown as ‘Stock Turnover Ratio’ where, COGS = Sales - Gross Profit Avg. Inventory = (Opening Stock + Closing Stock)/2  Ratio indicates how effectively inventory is managed by the company  Indicates how many times average inventory is sold and replaced over the period 𝐼. 𝑇. 𝑅. = 𝐶𝑂𝐺𝑆 𝐴𝑣𝑒𝑟𝑎𝑔𝑒 𝐼𝑛𝑣𝑒𝑛𝑡𝑜𝑟𝑦
  • 41.
    Debtors Turnover Ratio Alsoknown as ‘Accounts Receivable Turnover Ratio’ 𝐷. 𝑇. 𝑅. = 𝑁𝑒𝑡 𝐶𝑟𝑒𝑑𝑖𝑡 𝑆𝑎𝑙𝑒𝑠 𝐴𝑣𝑒𝑟𝑎𝑔𝑒 𝐴𝑐𝑐𝑜𝑢𝑛𝑡𝑠 𝑅𝑒𝑐𝑒𝑖𝑣𝑎𝑏𝑙𝑒 where, N.C.S. = Credit Sales - Sales Return Accounts Receivable = Bills Receivable + Debtors  Indicates efficiency of recovery department  Higher the ratio, faster business is collecting its receivables  Measures how many times business can collect its average accounts receivables during the year
  • 42.
    Creditors Turnover Ratio Alsoknown as ‘Accounts Payable Turnover Ratio’ 𝐶. 𝑇. 𝑅. = 𝑁𝑒𝑡 𝐶𝑟𝑒𝑑𝑖𝑡 𝑃𝑢𝑟𝑐ℎ𝑎𝑠𝑒 𝐴𝑣𝑒𝑟𝑎𝑔𝑒 𝐴𝑐𝑐𝑜𝑢𝑛𝑡𝑠 𝑃𝑎𝑦𝑎𝑏𝑙𝑒 where, N.C.P. = Credit Purchase - Purchase Return Accounts Payable = Bills Payable + Creditors  Indicates credit given by suppliers  Higher ratio means company paying to creditors quickly  Measures how many times company can pay off its average accounts payable balance during the year
  • 43.
    Assets Turnover Ratio 𝐴.𝑇. 𝑅. = 𝑁𝑒𝑡 𝑆𝑎𝑙𝑒𝑠 𝑇𝑜𝑡𝑎𝑙 𝐴𝑠𝑠𝑒𝑡𝑠 where, Net Sales = Sales - Sales Return Total Assets = Fixed Assets + Current Assets Ratio indicates how efficiently a company can use its assets to generate sales Land & Building, Motor vehicles, Furniture, Office Equipment, Computer, Plant & Machinery, etc. Cash, Accounts Receivable, Inventory, Marketable Securities, Prepaid Expenses, Other Liquid Assets, etc.
  • 44.
    Capital Turnover Ratio C.𝑇. 𝑅. = 𝑁𝑒𝑡 𝑆𝑎𝑙𝑒𝑠 𝐶𝑎𝑝𝑖𝑡𝑎𝑙 𝐸𝑚𝑝𝑙𝑜𝑦𝑒𝑑 where, Net Sales = Sales - Sales Return Capital Employed = Share Capital + Reserves & Surplus + Long Term Loans + Debentures + Working Capital Indicates efficiency of the organization with which capital employed is being utilized to generate revenue
  • 45.
    Valuation Ratios It isa measure of how cheap or expensive a business is, compared t some measures of profit or value 1. Earning Per Share 2. Price Earning Ratio 3. Price Sale Ratio 4. Dividend Payout Ratio Let’s discuss the ratios one by one
  • 46.
    Earning Per Share E.P. 𝑆. = 𝑁𝑒𝑡 𝐼𝑛𝑐𝑜𝑚𝑒−𝑃𝑟𝑒𝑓𝑒𝑟𝑟𝑒𝑑 𝐷𝑖𝑣𝑖𝑑𝑒𝑛𝑑𝑠 𝑁𝑜. 𝑜𝑓 𝑆ℎ𝑎𝑟𝑒𝑠 𝑂𝑢𝑡𝑠𝑡𝑎𝑛𝑑𝑖𝑛𝑔 Indicates amount of money each share of stock would receive if all of the profits were distributed to the outstanding shares at the end of the year
  • 47.
    Price Earning Ratio P.𝐸. 𝑅. = 𝑀𝑎𝑟𝑘𝑒𝑡 𝑃𝑟𝑖𝑐𝑒 𝑃𝑒𝑟 𝑆ℎ𝑎𝑟𝑒 𝐸𝑎𝑟𝑛𝑖𝑛𝑔 𝑃𝑒𝑟 𝑆ℎ𝑎𝑟𝑒 Shows how much a market is willing to pay for a stock based on its current earnings
  • 48.
    Dividend Payout Ratio Explainsthe relationship between earnings belongs to the shareholders and the amount finally paid to them in the form of dividend 𝐷. 𝑃. 𝑅. = 𝐷𝑖𝑣𝑖𝑑𝑒𝑛𝑑 𝑃𝑒𝑟 𝑆ℎ𝑎𝑟𝑒 𝐸𝑎𝑟𝑛𝑖𝑛𝑔 𝑃𝑒𝑟 𝑆ℎ𝑎𝑟𝑒
  • 49.
    Price Sale Ratio P.𝑆. 𝑅. = 𝑆𝑡𝑜𝑐𝑘 𝑃𝑟𝑖𝑐𝑒 𝑆𝑎𝑙𝑒𝑠 𝑝𝑒𝑟 𝑆ℎ𝑎𝑟𝑒  Compares company’s stock price with revenue  More relevant comparing companies of same sector  It is initiated when earnings of the company are negative  Low ratio indicates undervaluation while overvalued above the average
  • 50.
    Leverage/Solvency Ratios Ability ofthe firm to use fixed costs to magnify the returns to the shareh Debt-Equity Ratio Interest Coverage Ratio Fixed Charge Coverage Ratio Total Debt Ratio Let’s discuss the ratios one by one
  • 51.
    Debt-Equity Ratio 𝐷. 𝐸.𝑅. = 𝑇𝑜𝑡𝑎𝑙 𝐿𝑖𝑎𝑏𝑖𝑙𝑖𝑡𝑖𝑒𝑠 𝑇𝑜𝑡𝑎𝑙 𝐸𝑞𝑢𝑖𝑡𝑦  Ratio shows the percentage of the company financing that come from the creditors and investors.  Higher ratio indicates that more creditors financing(bank loans) is used than investors financing(shareholders).
  • 52.
    Interest Coverage Ratio 𝐼.𝐶. 𝑅. = 𝑃𝐵𝐼𝑇 𝐼𝑛𝑡𝑒𝑟𝑒𝑠𝑡 𝐶ℎ𝑎𝑟𝑔𝑒𝑠  The ability of the company to pay of its interest on its outstandin debt  Higher ratio shows that a company can pay of its interest expens several times over  Lower ratio is a strong indicator that a company may default on its loan payments
  • 53.
    Fixed Charge CoverageRatio 𝐹. 𝐶. 𝐶. 𝑅. = 𝐸𝐵𝐼𝑇 + 𝐹𝑖𝑥𝑒𝑑 𝐶ℎ𝑎𝑟𝑔𝑒𝑠 𝐵𝑒𝑓𝑜𝑟𝑒 𝑇𝑎𝑥𝑒𝑠 𝐹𝑖𝑥𝑒𝑑 𝐶ℎ𝑎𝑟𝑔𝑒𝑠 𝐵𝑒𝑓𝑜𝑟𝑒 𝑇𝑎𝑥𝑒𝑠 + 𝐼𝑛𝑡𝑒𝑟𝑒𝑠𝑡  Shows firm’s ability to pay all of its fixed charges or expenses with its income before interest and taxes  Higher ratio indicates healthier and less risky business to invest in or loan to
  • 54.
    Total Debt Ratio 𝑇.𝐷. 𝑅. = 𝑇𝑜𝑡𝑎𝑙 𝐿𝑖𝑎𝑏𝑖𝑙𝑖𝑡𝑖𝑒𝑠 𝑇𝑜𝑡𝑎𝑙 𝐴𝑠𝑠𝑒𝑡𝑠 where, Total Liabilities = Total Debt + Current Liabilities Total Assets = Fixed Assets + Current Assets  Indicates company’s ability to pay of its liabilities with its assets  Higher ratio indicates more risk to the lenders