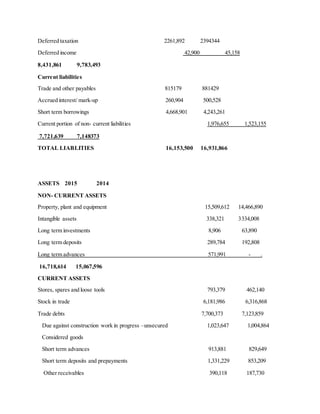
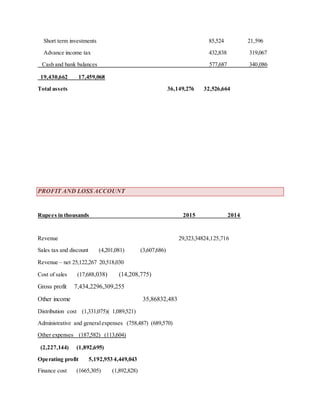
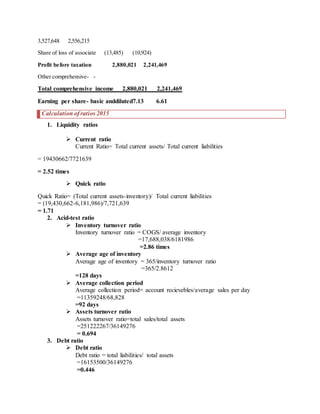
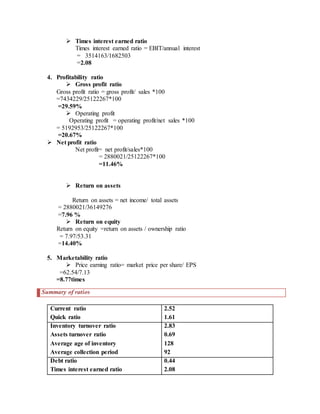
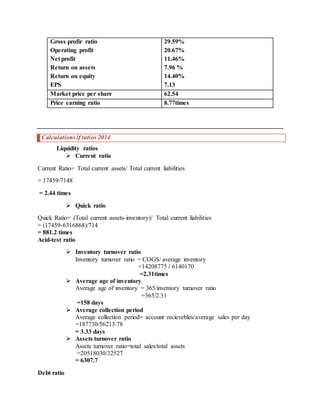
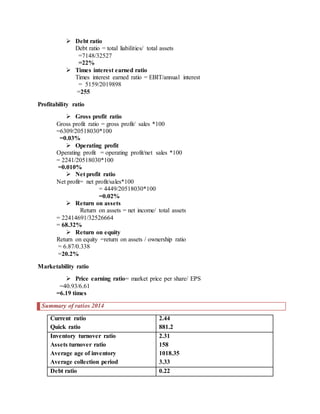
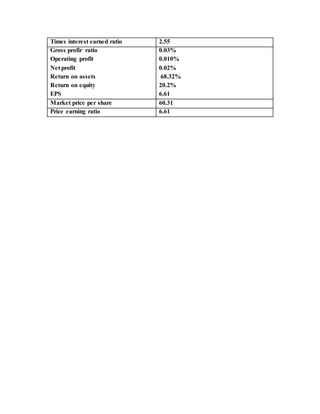
Ratio Analysis is a form of Financial Statement Analysis that is used to obtain a quick indication
of a firm's financial performance in several key areas. The ratios are categorized as Short-term
Solvency Ratios, Debt Management Ratios, Asset Management Ratios, Profitability Ratios, and
Market Value Ratios.
BALANCE SHEET
Rupees in thousands 2015 2014
EQUITYAND LIABILITIES
SHARE CAPITAL AND RESERVES
Authorized capital 6,000,000 6,000,000
Issued, subscribed and paid up 4,431,029 4,431,029
Capital reserve 1,293,858 1,293,858
Accumulated profit 7,891,437 5,301,554
TOTAL EQUITY 13,616,324 11,026,441
ADVANCES AGAINST ISSUE OF ORDINARYSHARES 1,575,252
SURPLUS ON REVALUATIONOF PROPERTY,4,804,200 4,568,357
PLANT AND EQUIPMENT
LIABILITIES
Non- current liabilities
Redeemable capital 3879209 4,826,469
Long term finances 2186,511 2442807
Liabilities against assets subject to finance lease 61,349 74,715
Deferred taxation 2261,892 2394344
Deferred income 42,900 45,158
8,431,861 9,783,493
Current liabilities
Trade and other payables 815179 881429
Accrued interest/ mark-up 260,904 500,528
Short term borrowings 4,668,901 4,243,261
Current portion of non- current liabilities 1,976,655 1,523,155
7,721,639 7,148373
TOTAL LIABLITIES 16,153,500 16,931,866
ASSETS 2015 2014
NON- CURRENT ASSETS
Property, plant and equipment 15,509,612 14,466,890
Intangible assets 338,321 3334,008
Long term investments 8,906 63,890
Long term deposits 289,784 192,808
Long term advances 571,991 - .
16,718,614 15,067,596
CURRENT ASSETS
Stores, spares and loose tools 793,379 462,140
Stock in trade 6,181,986 6,316,868
Trade debts 7,700,373 7,123,859
Due against construction work in progress –unsecured 1,023,647 1,004,864
Considered goods
Short term advances 913,881 829,649
Short term deposits and prepayments 1,331,229 853,209
Other receivables 390,118 187,730
Short term investments 85,524 21,596
Advance income tax 432,838 319,067
Cash and bank balances 577,687 340,086
19,430,662 17,459,068
Total assets 36,149,276 32,526,664
PROFIT AND LOSS ACCOUNT
Rupees in thousands 2015 2014
Revenue 29,323,34824,125,716
Sales tax and discount (4,201,081) (3,607,686)
Revenue – net 25,122,267 20,518,030
Cost of sales (17,688,038) (14,208,775)
Gross profit 7,434,2296,309,255
Other income 35,86832,483
Distribution cost (1,331,075)( 1,089,521)
Administrative and generalexpenses (758,487) (689,570)
Other expenses (187,582) (113,604)
(2,227,144) (1,892,695)
Operating profit 5,192,953 4,449,043
Finance cost (1665,305) (1,892,828)
3,527,648 2,556,215
Share of loss of associate (13,485) (10,924)
Profit before taxation 2,880,021 2,241,469
Other comprehensive- -
Total comprehensive income 2,880,021 2,241,469
Earning per share- basic anddiluted7.13 6.61
Calculation of ratios 2015
1. Liquidity ratios
 Current ratio
Current Ratio= Total current assets/ Total current liabilities
= 19430662/7721639
= 2.52 times
 Quick ratio
Quick Ratio= (Total current assets-inventory)/ Total current liabilities
= (19,430,662-6,181,986)/7,721,639
= 1.71
2. Acid-test ratio
 Inventory turnover ratio
Inventory turnover ratio = COGS/ average inventory
=17,688,038/6181986
=2.86 times
 Average age of inventory
Average age of inventory = 365/inventory turnover ratio
=365/2.8612
=128 days
 Average collection period
Average collection period= account recievebles/average sales per day
=11359248/68,828
=92 days
 Assets turnover ratio
Assets turnover ratio=total sales/total assets
=251222267/36149276
= 0.694
3. Debt ratio
 Debt ratio
Debt ratio = total liabilities/ total assets
=16153500/36149276
=0.446
 Times interest earned ratio
Times interest earned ratio = EBIT/annual interest
= 3514163/1682503
=2.08
4. Profitability ratio
 Gross profit ratio
Gross profit ratio = gross profit/ sales *100
=7434229/25122267*100
=29.59%
 Operating profit
Operating profit = operating profit/net sales *100
= 5192953/25122267*100
=20.67%
 Net profit ratio
Net profit= net profit/sales*100
= 2880021/25122267*100
=11.46%
 Return on assets
Return on assets = net income/ total assets
= 2880021/36149276
=7.96 %
 Return on equity
Return on equity =return on assets / ownership ratio
= 7.97/53.31
=14.40%
5. Marketability ratio
 Price earning ratio= market price per share/ EPS
=62.54/7.13
=8.77times
Summary of ratios
Current ratio
Quick ratio
2.52
1.61
Inventory turnover ratio
Assets turnover ratio
Average age of inventory
Average collection period
2.83
0.69
128
92
Debt ratio
Times interest earned ratio
0.44
2.08
Calculations if ratios 2014
Liquidity ratios
 Current ratio
Current Ratio= Total current assets/ Total current liabilities
= 17459/7148
= 2.44 times
 Quick ratio
Quick Ratio= (Total current assets-inventory)/ Total current liabilities
= (17459-6316868)/714
= 881.2 times
Acid-test ratio
 Inventory turnover ratio
Inventory turnover ratio = COGS/ average inventory
=14208775 / 6140170
=2.31times
 Average age of inventory
Average age of inventory = 365/inventory turnover ratio
=365/2.31
=158 days
 Average collection period
Average collection period= account recievebles/average sales per day
=187730/56213.78
= 3.33 days
 Assets turnover ratio
Assets turnover ratio=total sales/total assets
=20518030/32527
= 6307.7
Debt ratio
Gross profir ratio
Operating profit
Net profit
Return on assets
Return on equity
EPS
29.59%
20.67%
11.46%
7.96 %
14.40%
7.13
Market price per share 62.54
Price earning ratio 8.77times
 Debt ratio
Debt ratio = total liabilities/ total assets
=7148/32527
=22%
 Times interest earned ratio
Times interest earned ratio = EBIT/annual interest
= 5159/2019898
=255
Profitability ratio
 Gross profit ratio
Gross profit ratio = gross profit/ sales *100
=6309/20518030*100
=0.03%
 Operating profit
Operating profit = operating profit/net sales *100
= 2241/20518030*100
=0.010%
 Net profit ratio
Net profit= net profit/sales*100
= 4449/20518030*100
=0.02%
 Return on assets
Return on assets = net income/ total assets
= 22414691/32526664
= 68.32%
 Return on equity
Return on equity =return on assets / ownership ratio
= 6.87/0.338
=20.2%
Marketability ratio
 Price earning ratio= market price per share/ EPS
=40.93/6.61
=6.19 times
Summary of ratios 2014
Current ratio
Quick ratio
2.44
881.2
Inventory turnover ratio
Assets turnover ratio
Average age of inventory
Average collection period
2.31
158
1018.35
3.33
Debt ratio 0.22
Times interest earned ratio 2.55
Gross profir ratio
Operating profit
Net profit
Return on assets
Return on equity
EPS
0.03%
0.010%
0.02%
68.32%
20.2%
6.61
Market price per share 60.31
Price earning ratio 6.61

wasif file

  • 1.
    Ratio Analysis isa form of Financial Statement Analysis that is used to obtain a quick indication of a firm's financial performance in several key areas. The ratios are categorized as Short-term Solvency Ratios, Debt Management Ratios, Asset Management Ratios, Profitability Ratios, and Market Value Ratios. BALANCE SHEET Rupees in thousands 2015 2014 EQUITYAND LIABILITIES SHARE CAPITAL AND RESERVES Authorized capital 6,000,000 6,000,000 Issued, subscribed and paid up 4,431,029 4,431,029 Capital reserve 1,293,858 1,293,858 Accumulated profit 7,891,437 5,301,554 TOTAL EQUITY 13,616,324 11,026,441 ADVANCES AGAINST ISSUE OF ORDINARYSHARES 1,575,252 SURPLUS ON REVALUATIONOF PROPERTY,4,804,200 4,568,357 PLANT AND EQUIPMENT LIABILITIES Non- current liabilities Redeemable capital 3879209 4,826,469 Long term finances 2186,511 2442807 Liabilities against assets subject to finance lease 61,349 74,715
  • 2.
    Deferred taxation 2261,8922394344 Deferred income 42,900 45,158 8,431,861 9,783,493 Current liabilities Trade and other payables 815179 881429 Accrued interest/ mark-up 260,904 500,528 Short term borrowings 4,668,901 4,243,261 Current portion of non- current liabilities 1,976,655 1,523,155 7,721,639 7,148373 TOTAL LIABLITIES 16,153,500 16,931,866 ASSETS 2015 2014 NON- CURRENT ASSETS Property, plant and equipment 15,509,612 14,466,890 Intangible assets 338,321 3334,008 Long term investments 8,906 63,890 Long term deposits 289,784 192,808 Long term advances 571,991 - . 16,718,614 15,067,596 CURRENT ASSETS Stores, spares and loose tools 793,379 462,140 Stock in trade 6,181,986 6,316,868 Trade debts 7,700,373 7,123,859 Due against construction work in progress –unsecured 1,023,647 1,004,864 Considered goods Short term advances 913,881 829,649 Short term deposits and prepayments 1,331,229 853,209 Other receivables 390,118 187,730
  • 3.
    Short term investments85,524 21,596 Advance income tax 432,838 319,067 Cash and bank balances 577,687 340,086 19,430,662 17,459,068 Total assets 36,149,276 32,526,664 PROFIT AND LOSS ACCOUNT Rupees in thousands 2015 2014 Revenue 29,323,34824,125,716 Sales tax and discount (4,201,081) (3,607,686) Revenue – net 25,122,267 20,518,030 Cost of sales (17,688,038) (14,208,775) Gross profit 7,434,2296,309,255 Other income 35,86832,483 Distribution cost (1,331,075)( 1,089,521) Administrative and generalexpenses (758,487) (689,570) Other expenses (187,582) (113,604) (2,227,144) (1,892,695) Operating profit 5,192,953 4,449,043 Finance cost (1665,305) (1,892,828)
  • 4.
    3,527,648 2,556,215 Share ofloss of associate (13,485) (10,924) Profit before taxation 2,880,021 2,241,469 Other comprehensive- - Total comprehensive income 2,880,021 2,241,469 Earning per share- basic anddiluted7.13 6.61 Calculation of ratios 2015 1. Liquidity ratios  Current ratio Current Ratio= Total current assets/ Total current liabilities = 19430662/7721639 = 2.52 times  Quick ratio Quick Ratio= (Total current assets-inventory)/ Total current liabilities = (19,430,662-6,181,986)/7,721,639 = 1.71 2. Acid-test ratio  Inventory turnover ratio Inventory turnover ratio = COGS/ average inventory =17,688,038/6181986 =2.86 times  Average age of inventory Average age of inventory = 365/inventory turnover ratio =365/2.8612 =128 days  Average collection period Average collection period= account recievebles/average sales per day =11359248/68,828 =92 days  Assets turnover ratio Assets turnover ratio=total sales/total assets =251222267/36149276 = 0.694 3. Debt ratio  Debt ratio Debt ratio = total liabilities/ total assets =16153500/36149276 =0.446
  • 5.
     Times interestearned ratio Times interest earned ratio = EBIT/annual interest = 3514163/1682503 =2.08 4. Profitability ratio  Gross profit ratio Gross profit ratio = gross profit/ sales *100 =7434229/25122267*100 =29.59%  Operating profit Operating profit = operating profit/net sales *100 = 5192953/25122267*100 =20.67%  Net profit ratio Net profit= net profit/sales*100 = 2880021/25122267*100 =11.46%  Return on assets Return on assets = net income/ total assets = 2880021/36149276 =7.96 %  Return on equity Return on equity =return on assets / ownership ratio = 7.97/53.31 =14.40% 5. Marketability ratio  Price earning ratio= market price per share/ EPS =62.54/7.13 =8.77times Summary of ratios Current ratio Quick ratio 2.52 1.61 Inventory turnover ratio Assets turnover ratio Average age of inventory Average collection period 2.83 0.69 128 92 Debt ratio Times interest earned ratio 0.44 2.08
  • 6.
    Calculations if ratios2014 Liquidity ratios  Current ratio Current Ratio= Total current assets/ Total current liabilities = 17459/7148 = 2.44 times  Quick ratio Quick Ratio= (Total current assets-inventory)/ Total current liabilities = (17459-6316868)/714 = 881.2 times Acid-test ratio  Inventory turnover ratio Inventory turnover ratio = COGS/ average inventory =14208775 / 6140170 =2.31times  Average age of inventory Average age of inventory = 365/inventory turnover ratio =365/2.31 =158 days  Average collection period Average collection period= account recievebles/average sales per day =187730/56213.78 = 3.33 days  Assets turnover ratio Assets turnover ratio=total sales/total assets =20518030/32527 = 6307.7 Debt ratio Gross profir ratio Operating profit Net profit Return on assets Return on equity EPS 29.59% 20.67% 11.46% 7.96 % 14.40% 7.13 Market price per share 62.54 Price earning ratio 8.77times
  • 7.
     Debt ratio Debtratio = total liabilities/ total assets =7148/32527 =22%  Times interest earned ratio Times interest earned ratio = EBIT/annual interest = 5159/2019898 =255 Profitability ratio  Gross profit ratio Gross profit ratio = gross profit/ sales *100 =6309/20518030*100 =0.03%  Operating profit Operating profit = operating profit/net sales *100 = 2241/20518030*100 =0.010%  Net profit ratio Net profit= net profit/sales*100 = 4449/20518030*100 =0.02%  Return on assets Return on assets = net income/ total assets = 22414691/32526664 = 68.32%  Return on equity Return on equity =return on assets / ownership ratio = 6.87/0.338 =20.2% Marketability ratio  Price earning ratio= market price per share/ EPS =40.93/6.61 =6.19 times Summary of ratios 2014 Current ratio Quick ratio 2.44 881.2 Inventory turnover ratio Assets turnover ratio Average age of inventory Average collection period 2.31 158 1018.35 3.33 Debt ratio 0.22
  • 8.
    Times interest earnedratio 2.55 Gross profir ratio Operating profit Net profit Return on assets Return on equity EPS 0.03% 0.010% 0.02% 68.32% 20.2% 6.61 Market price per share 60.31 Price earning ratio 6.61