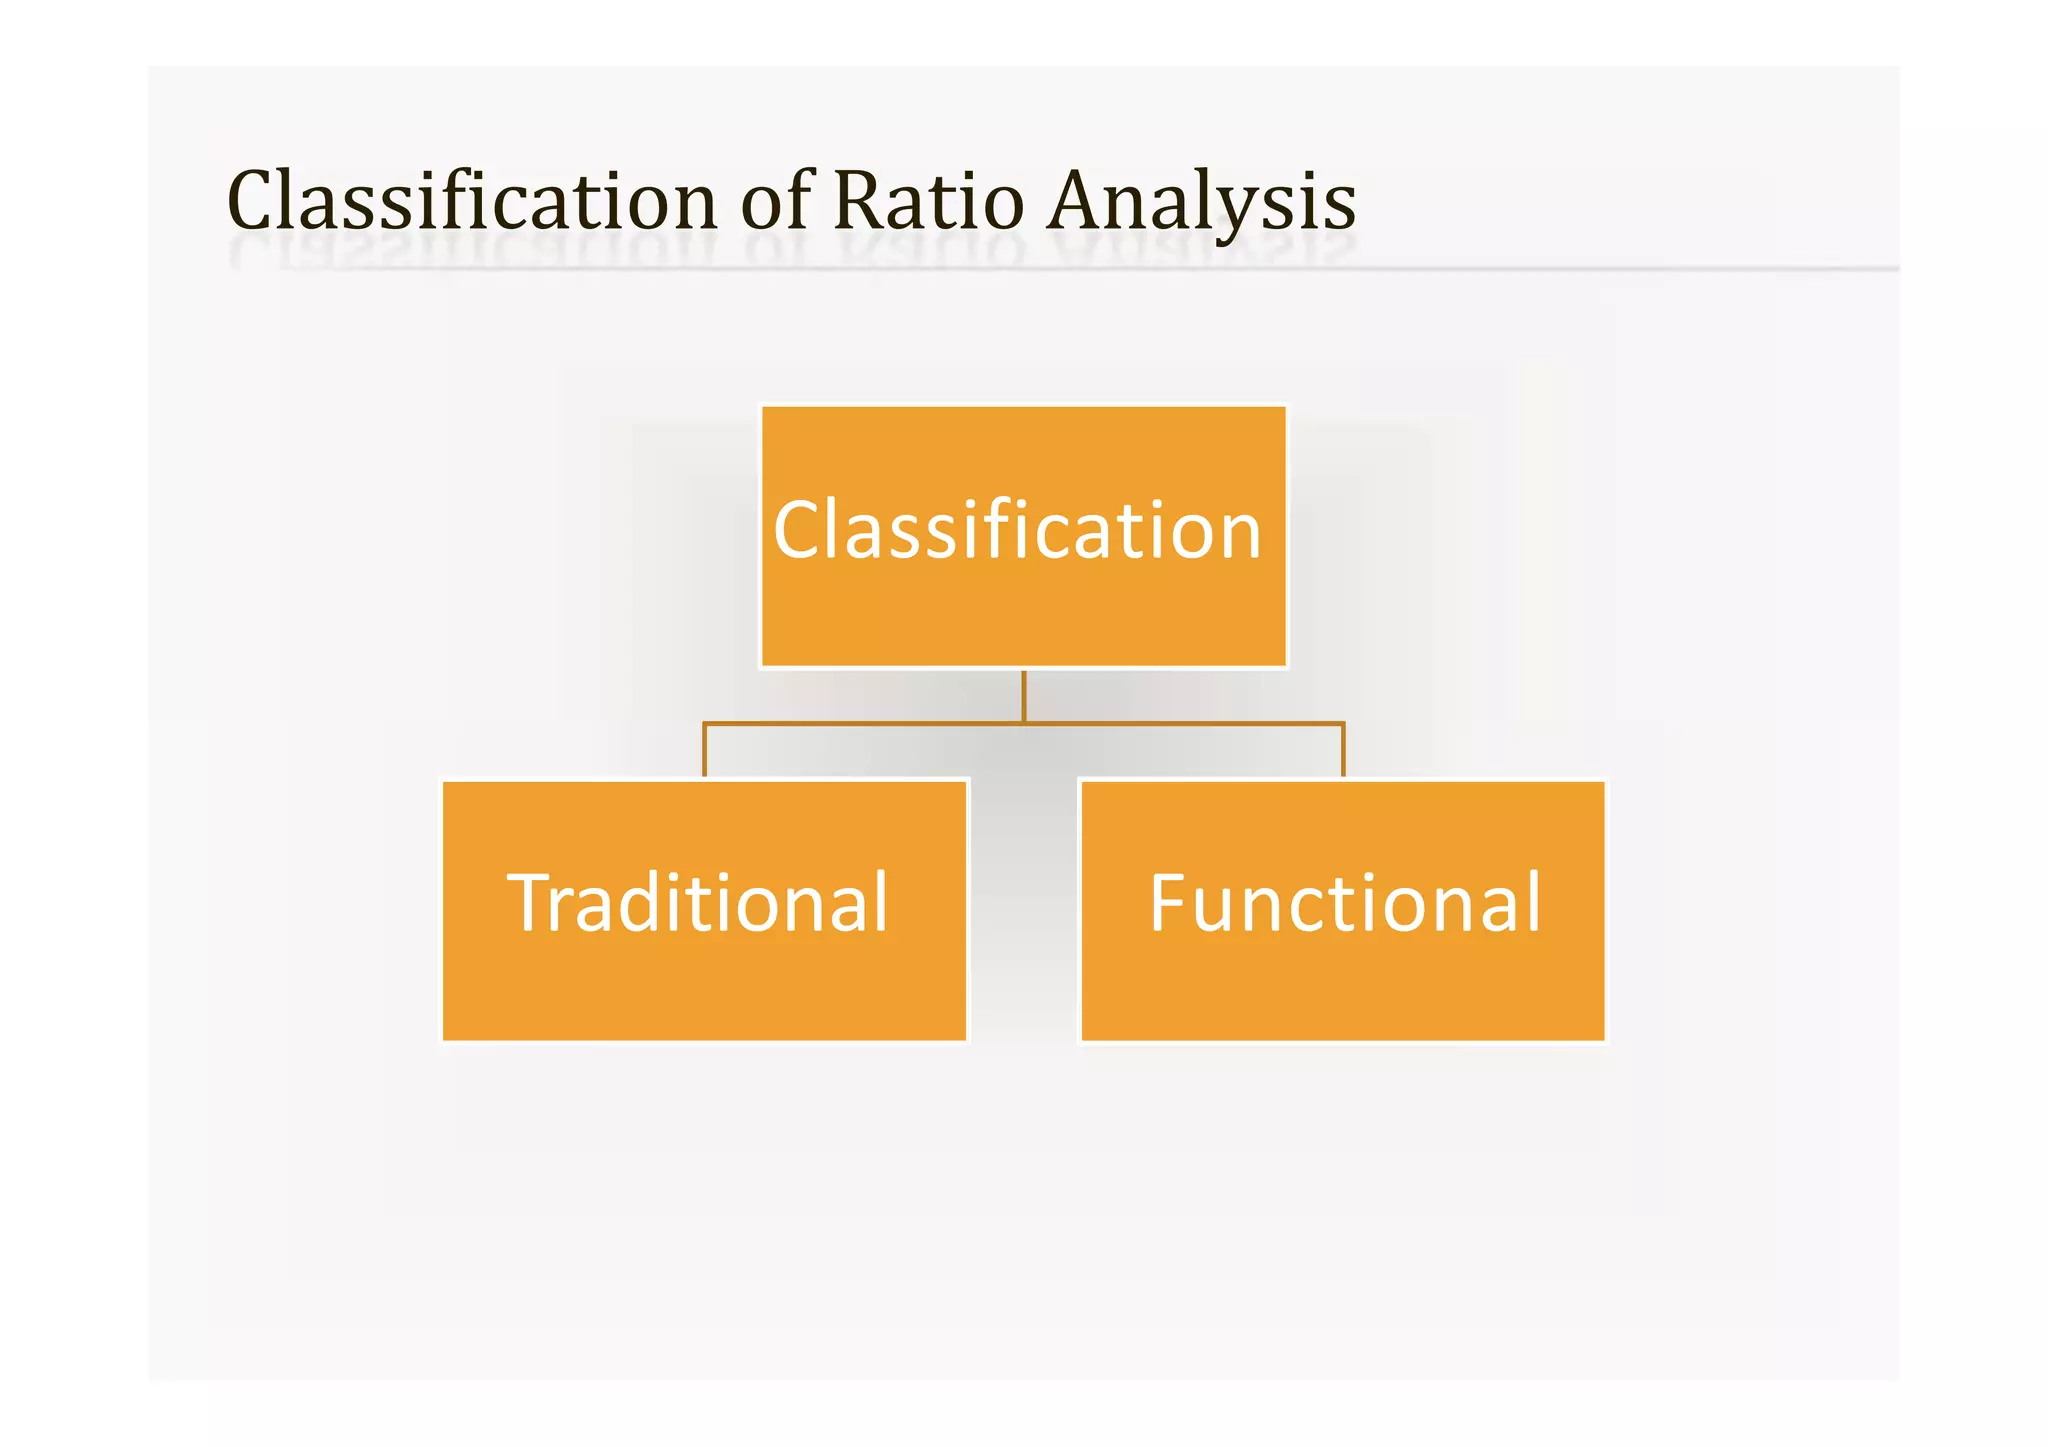
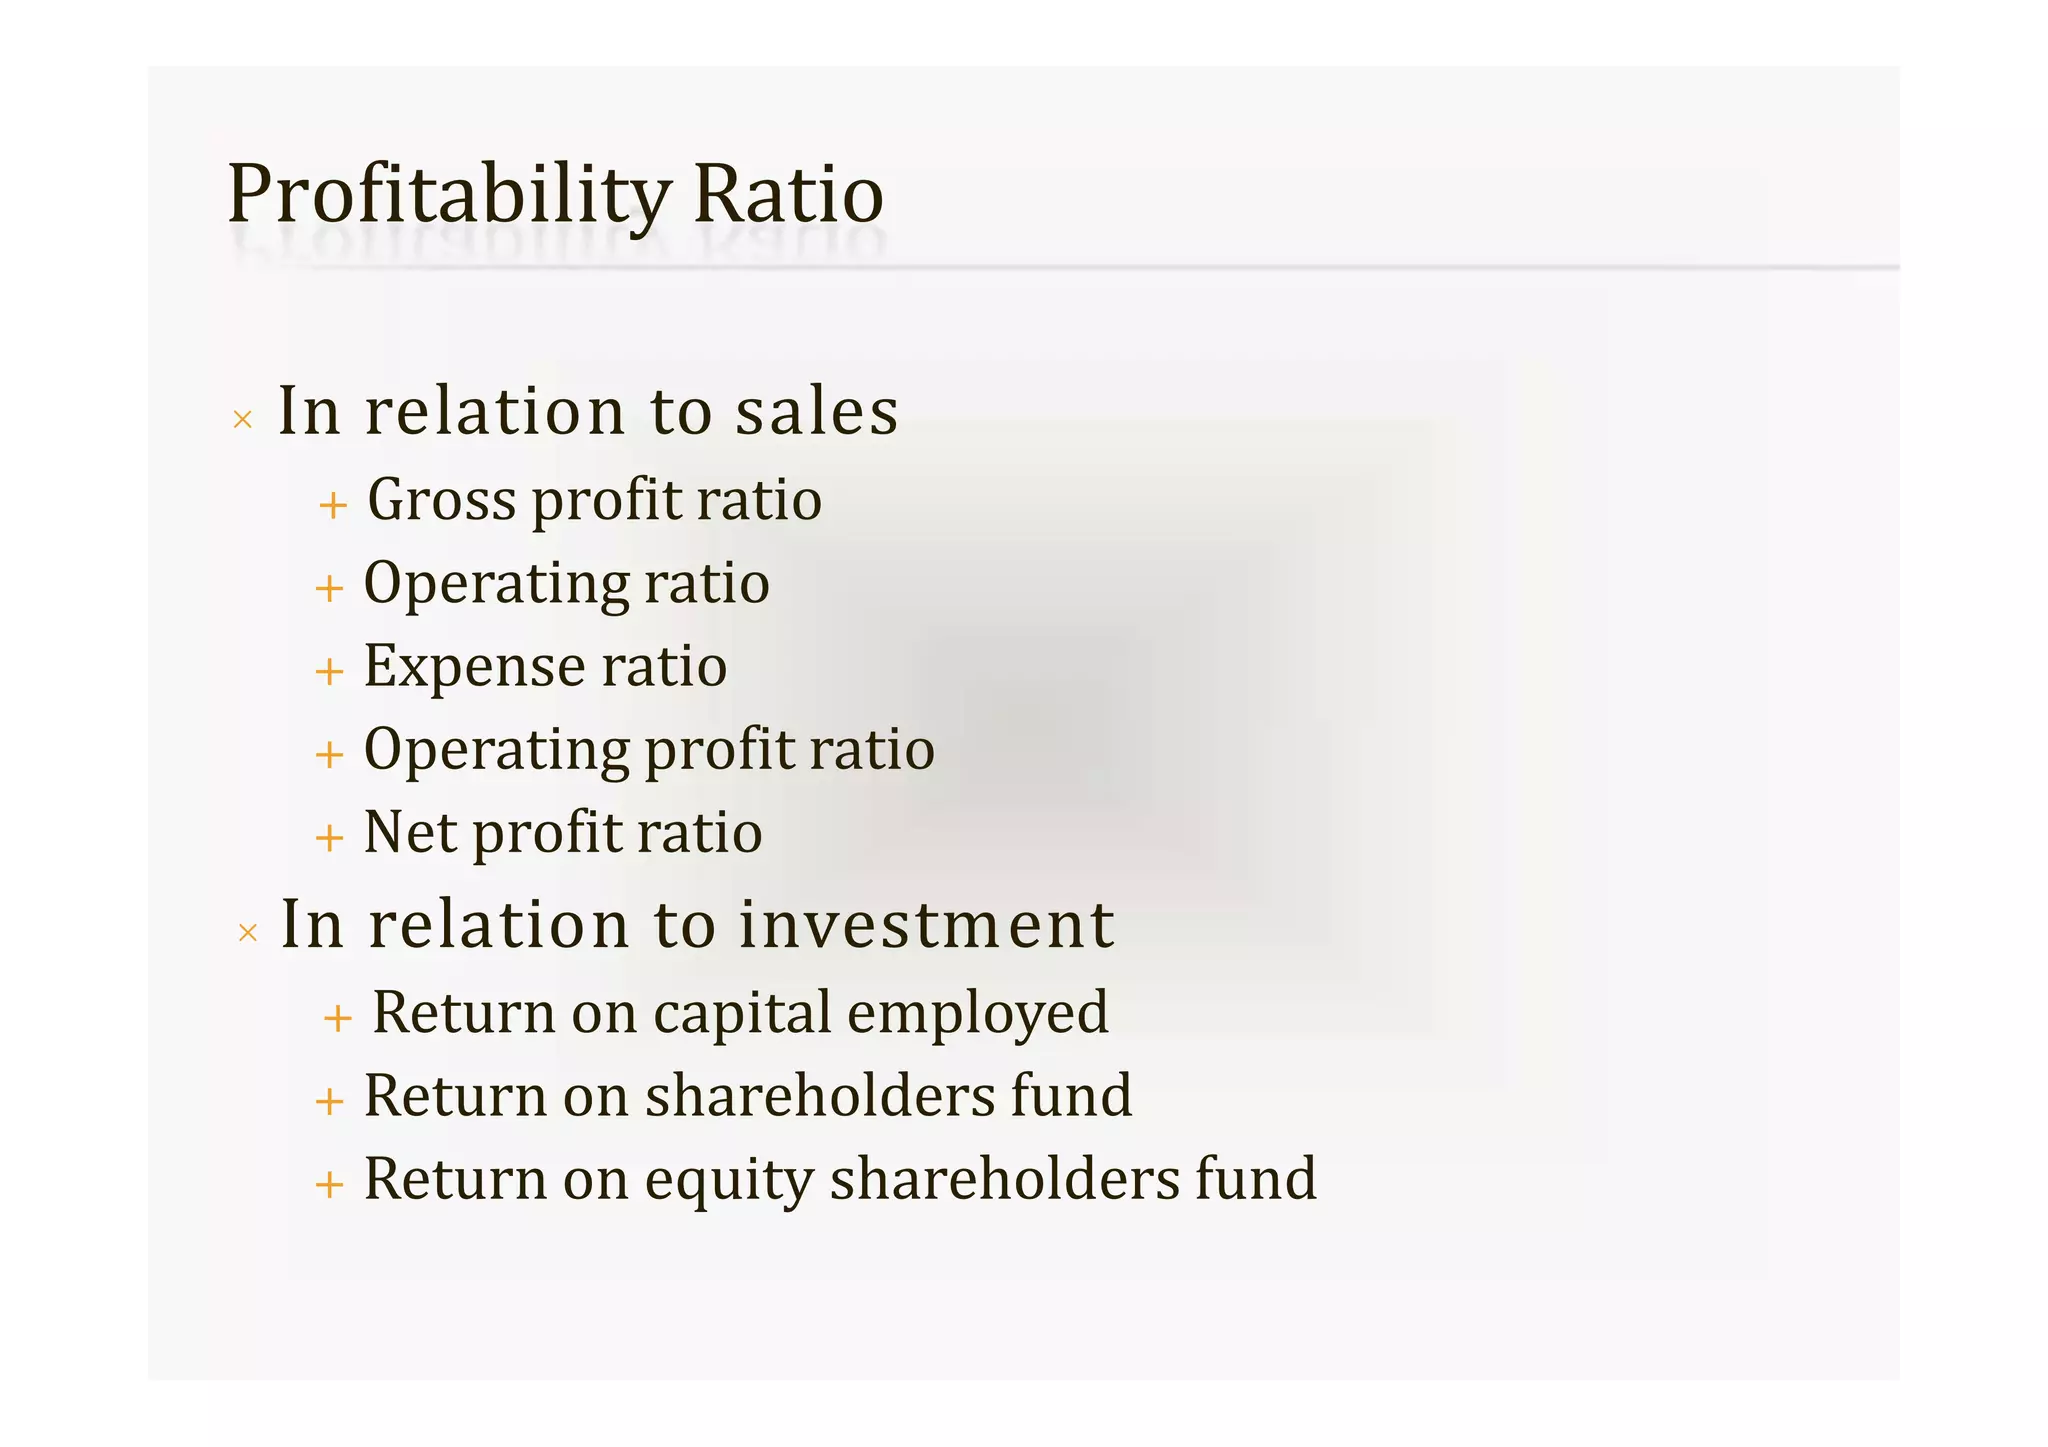
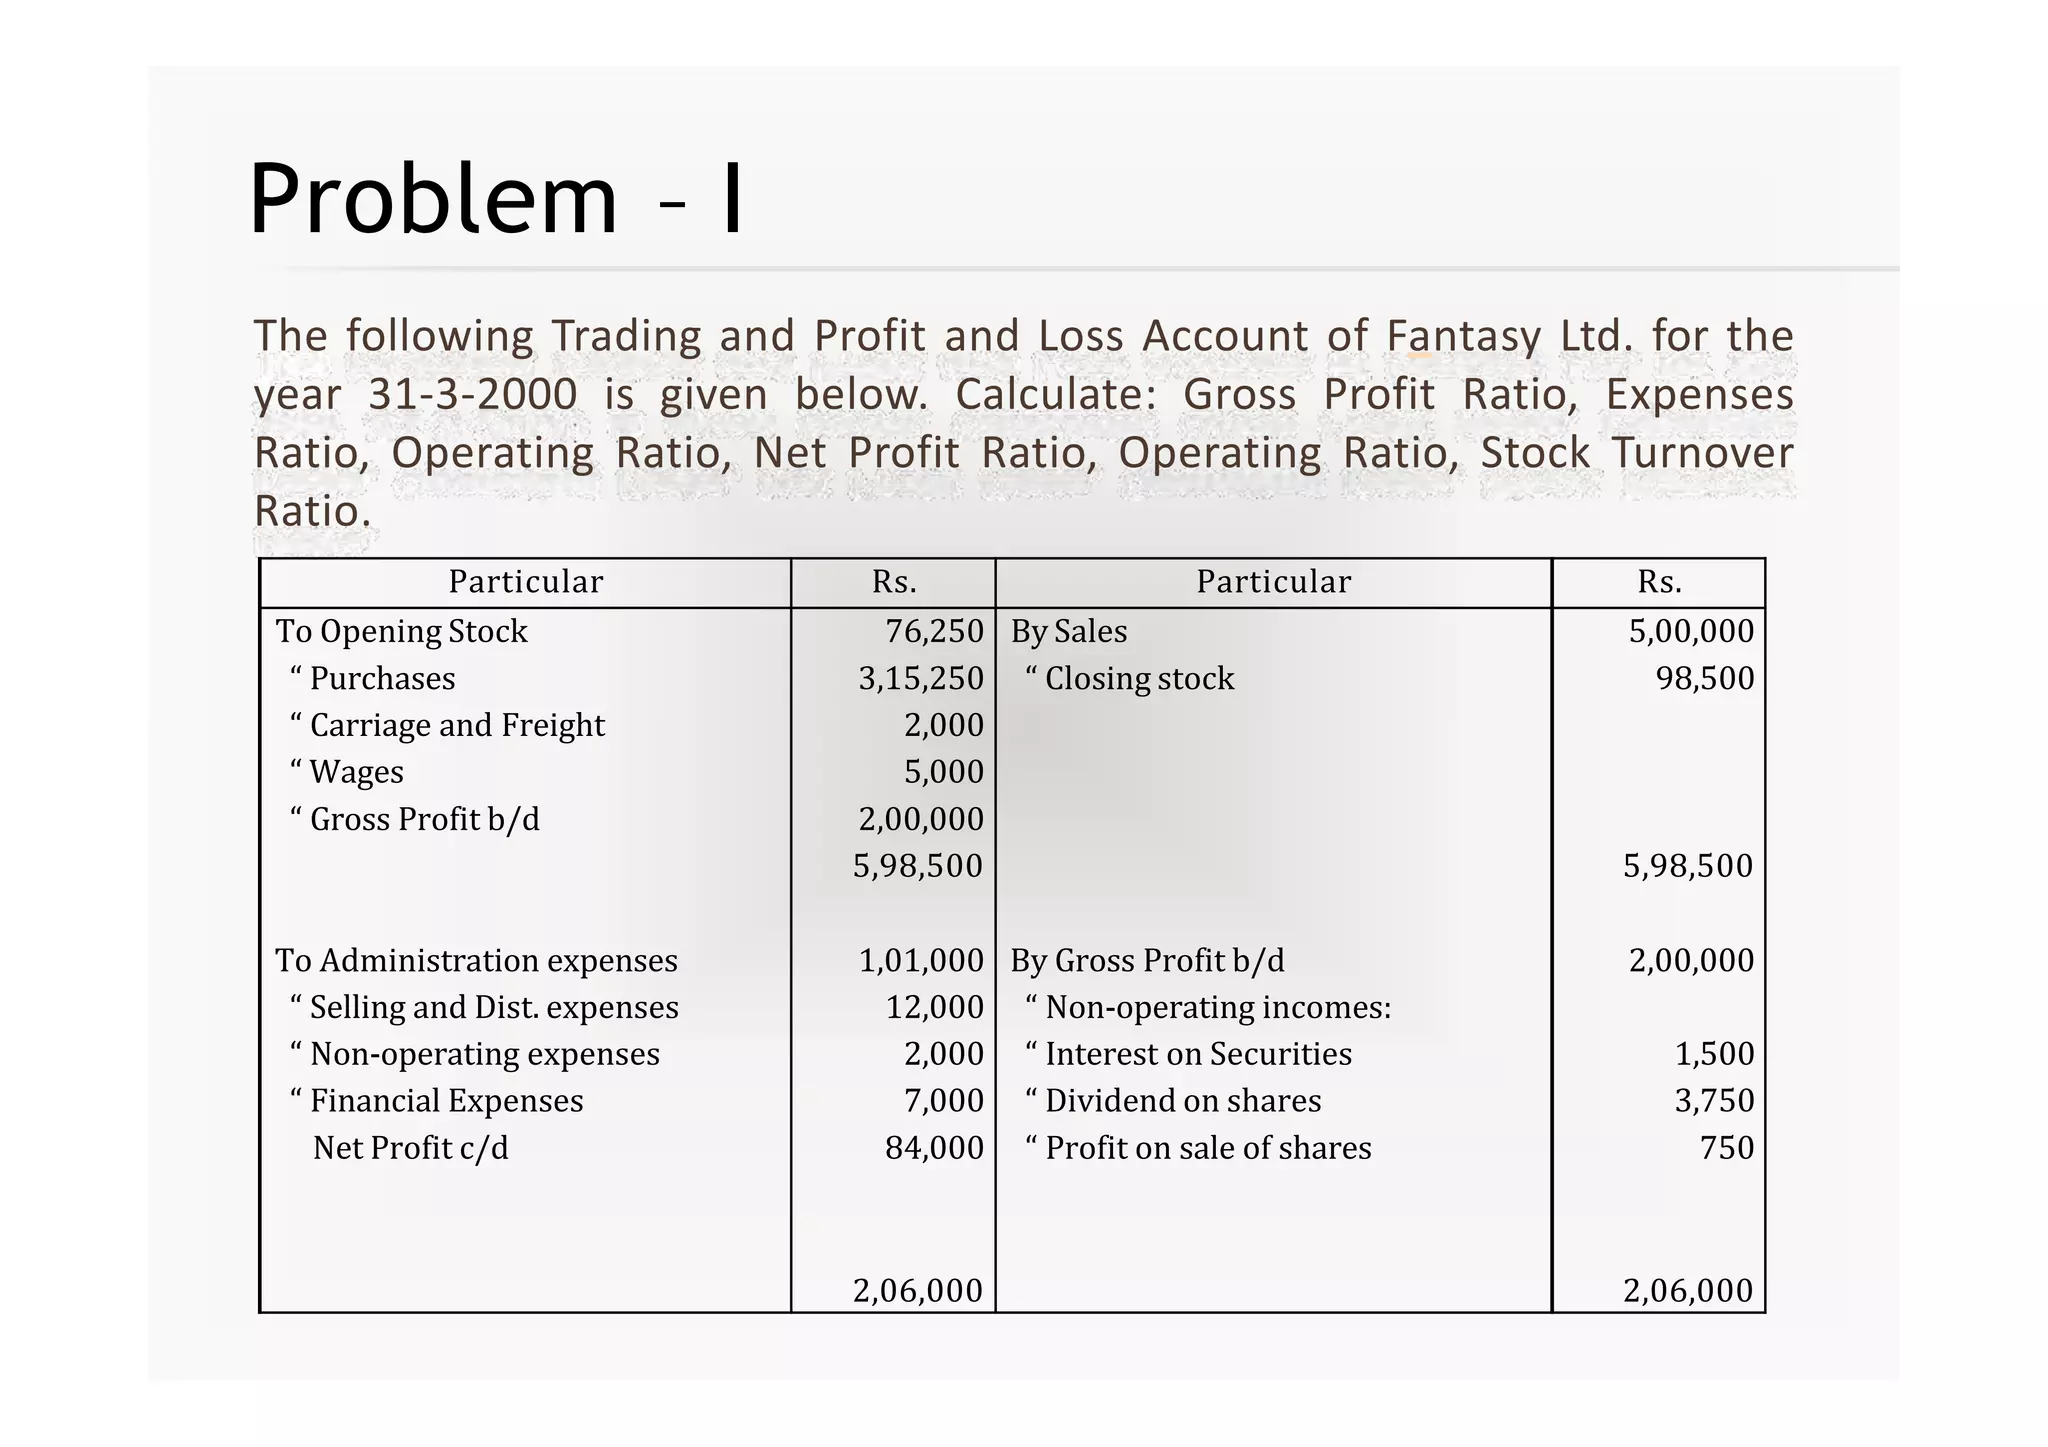
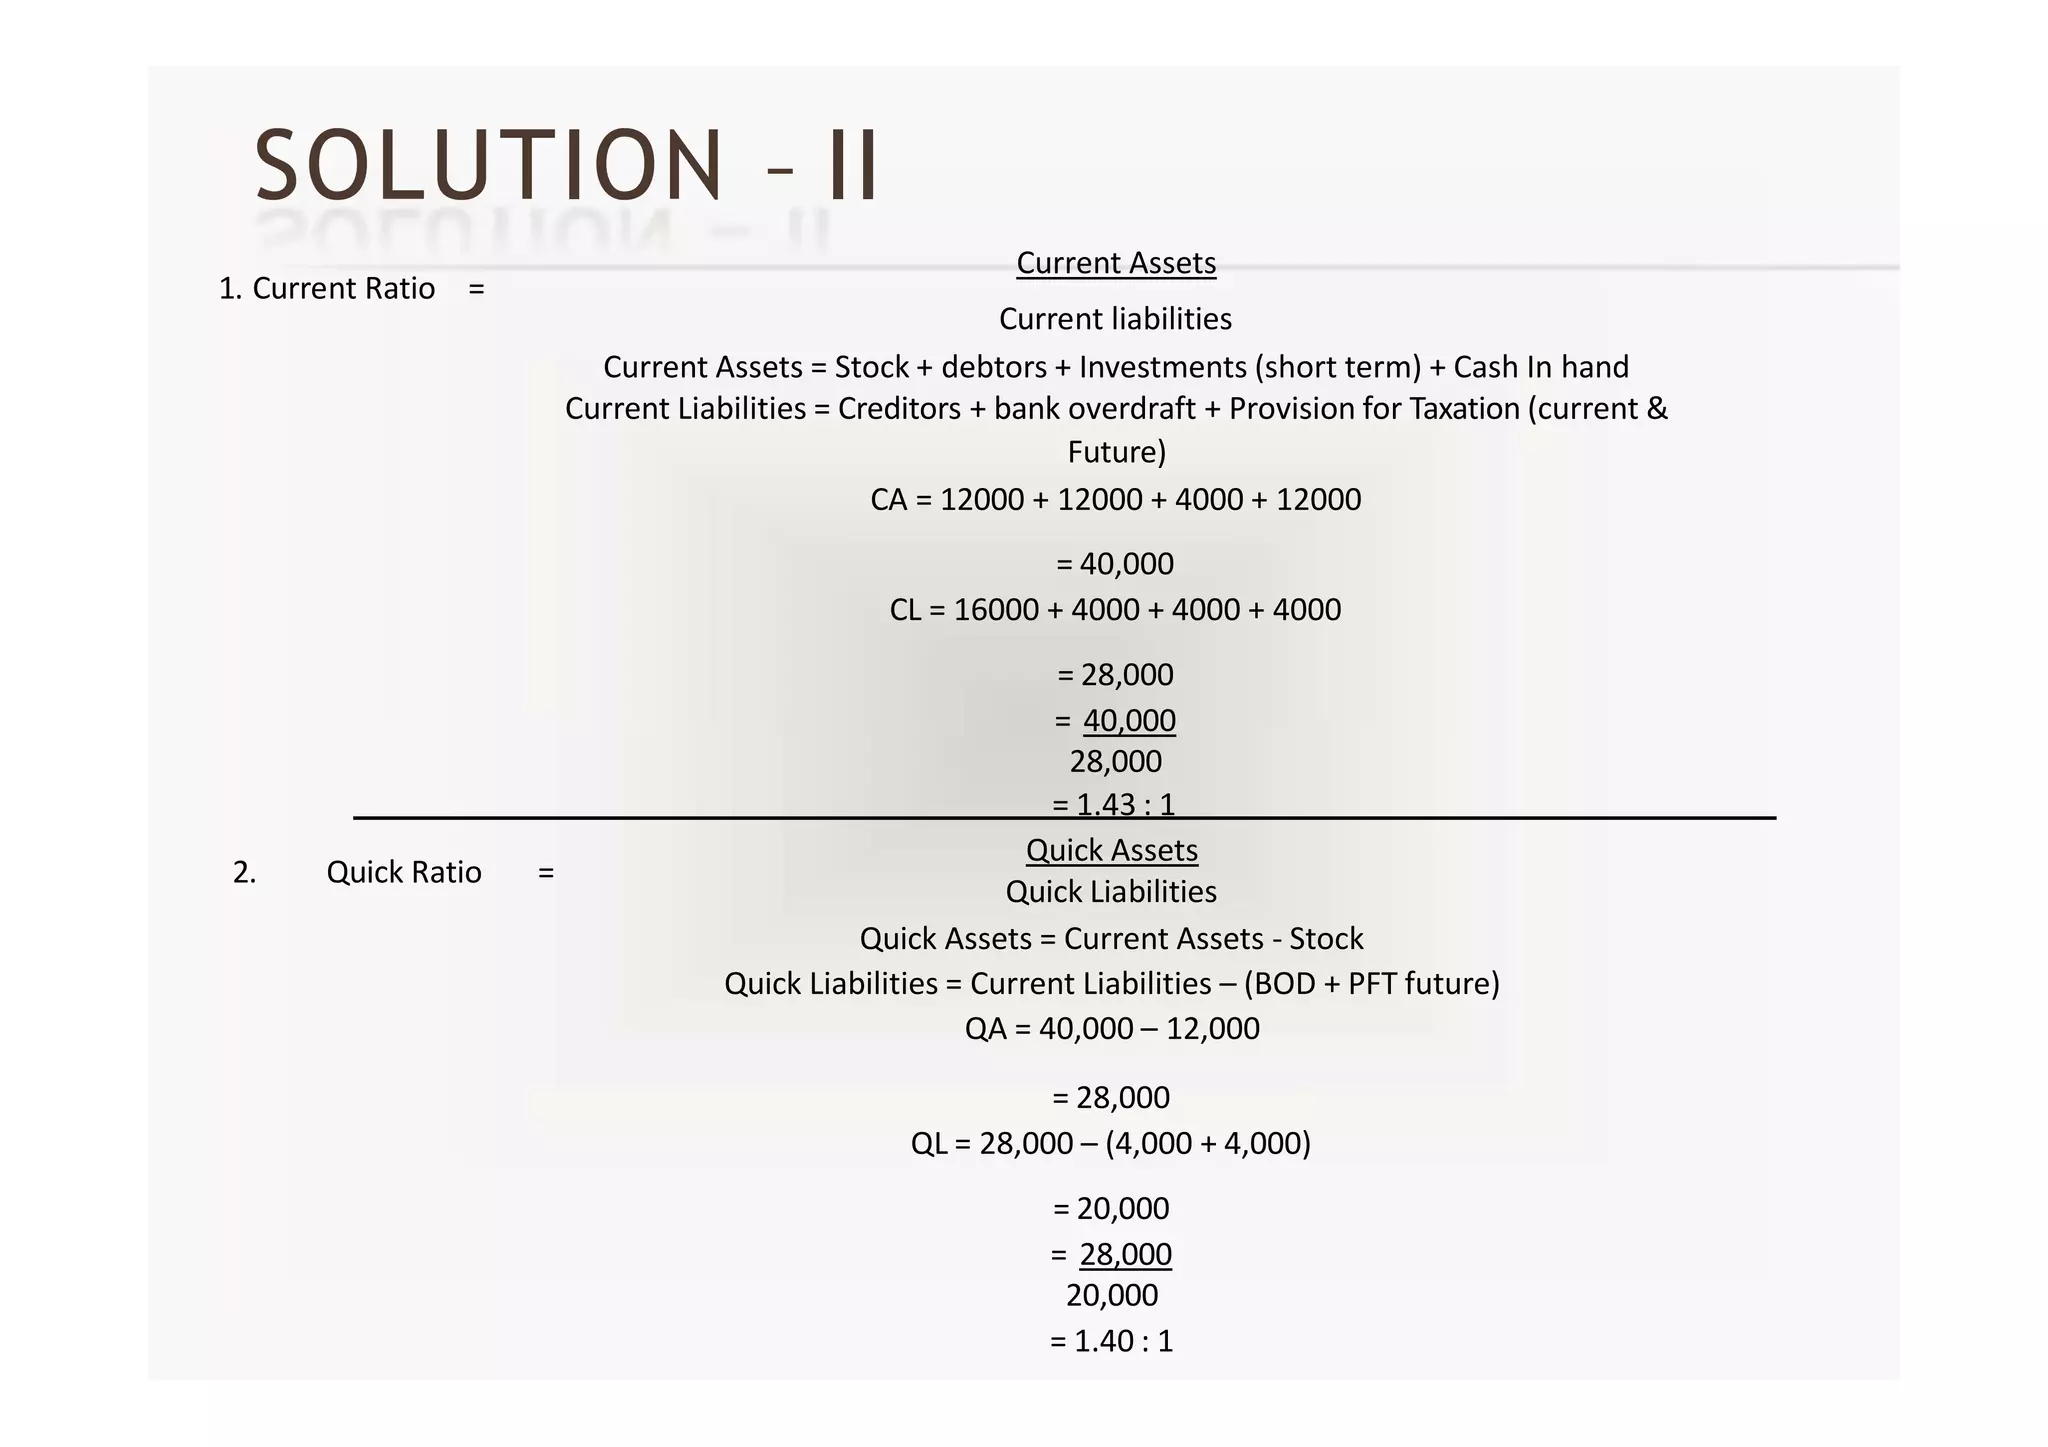
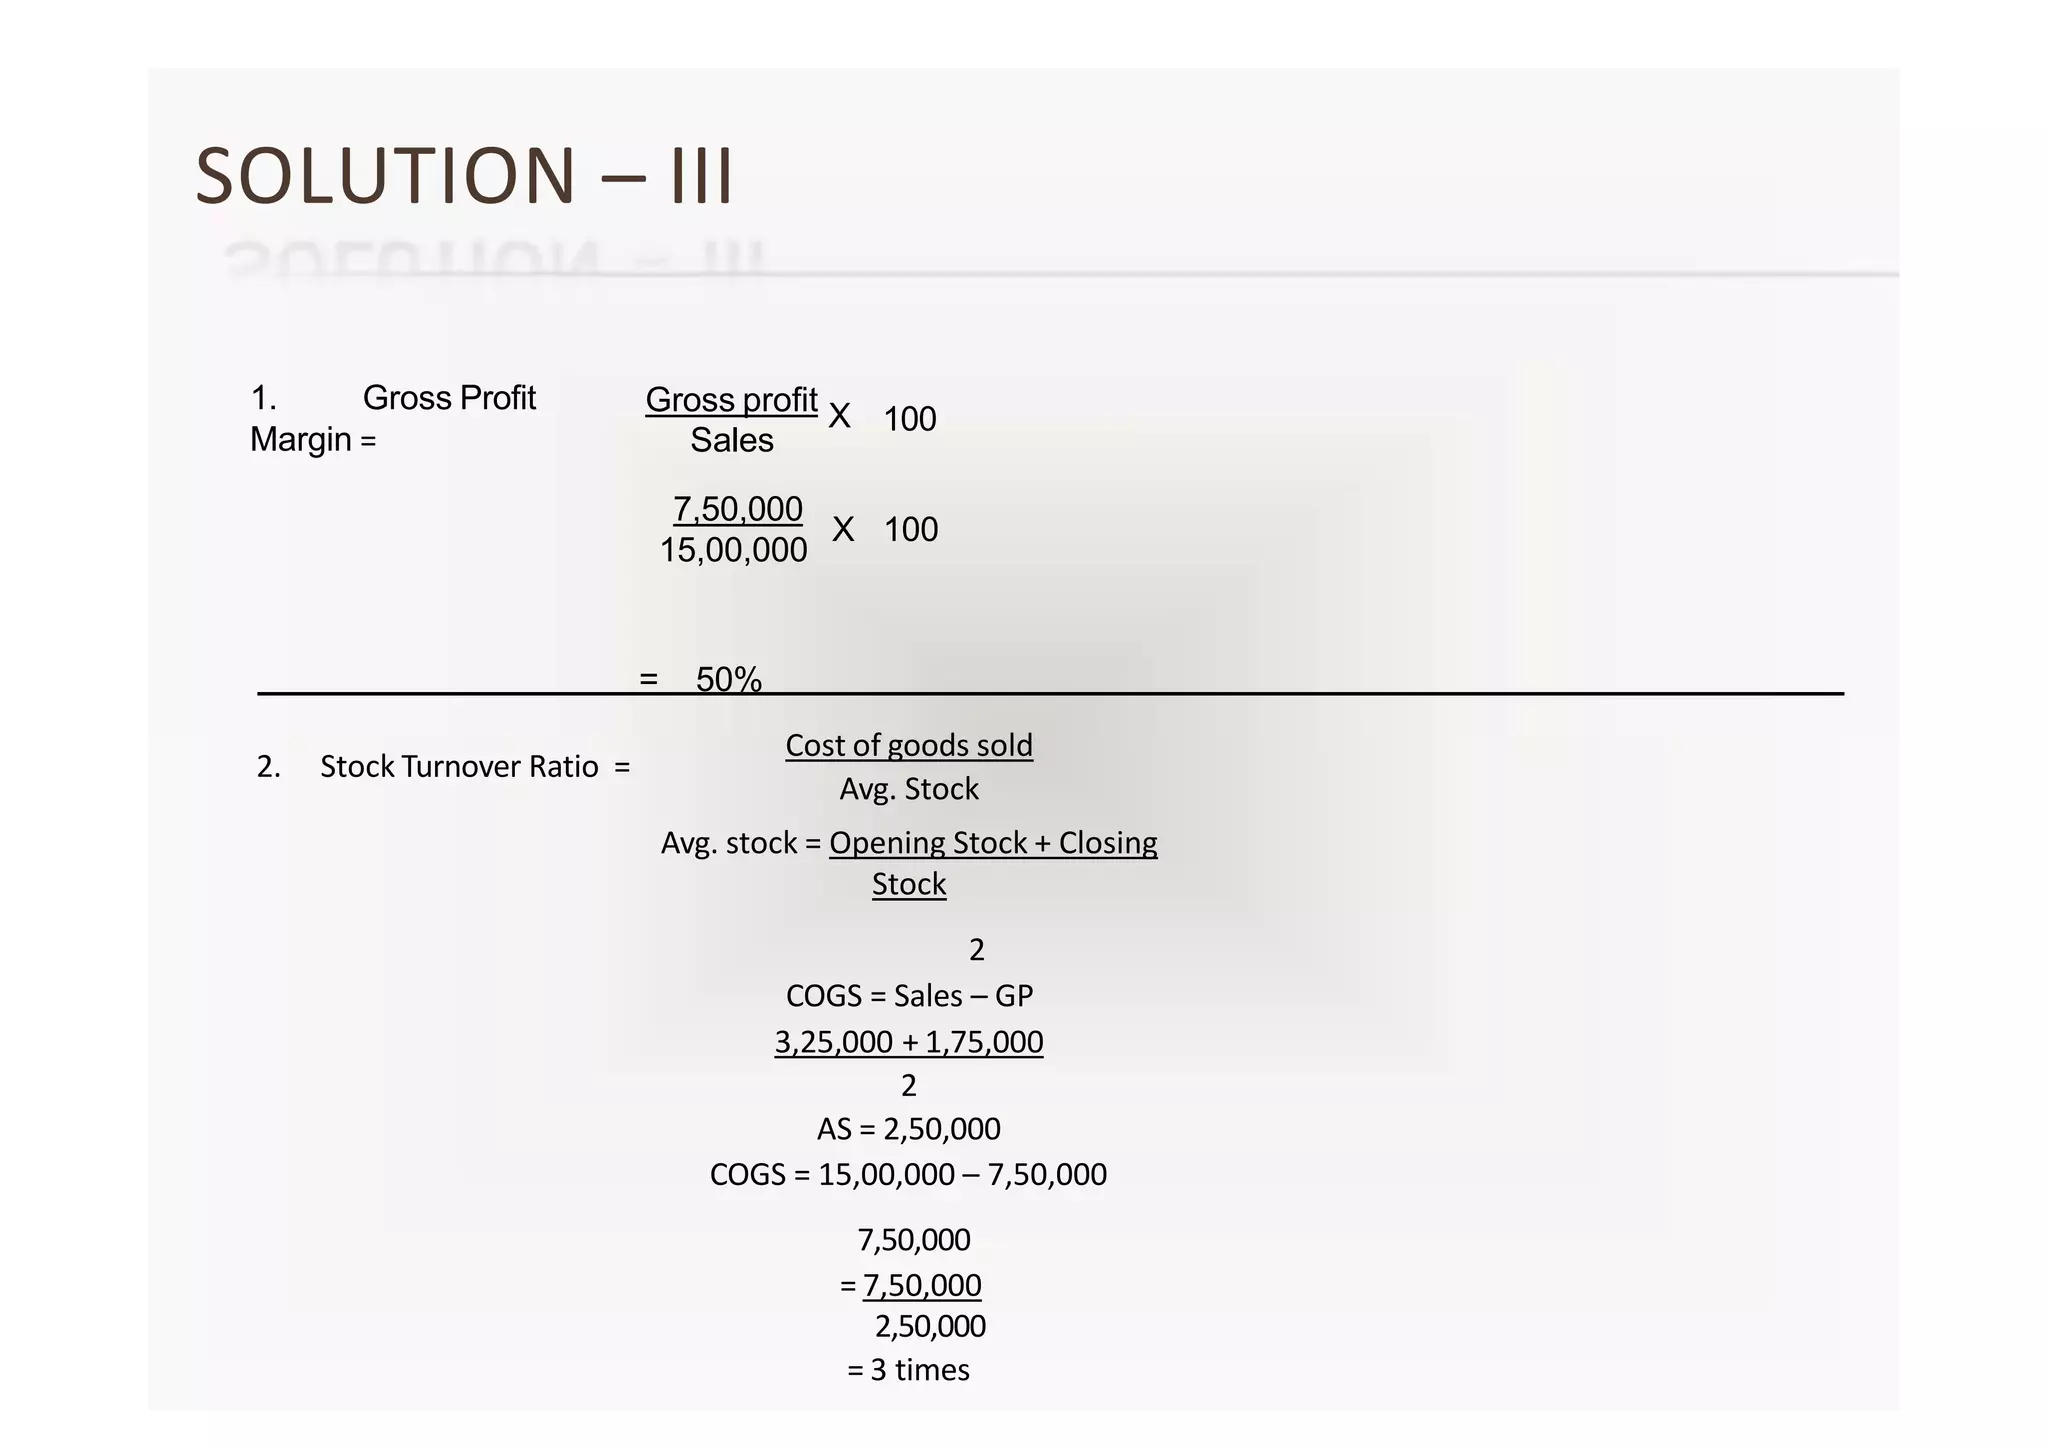
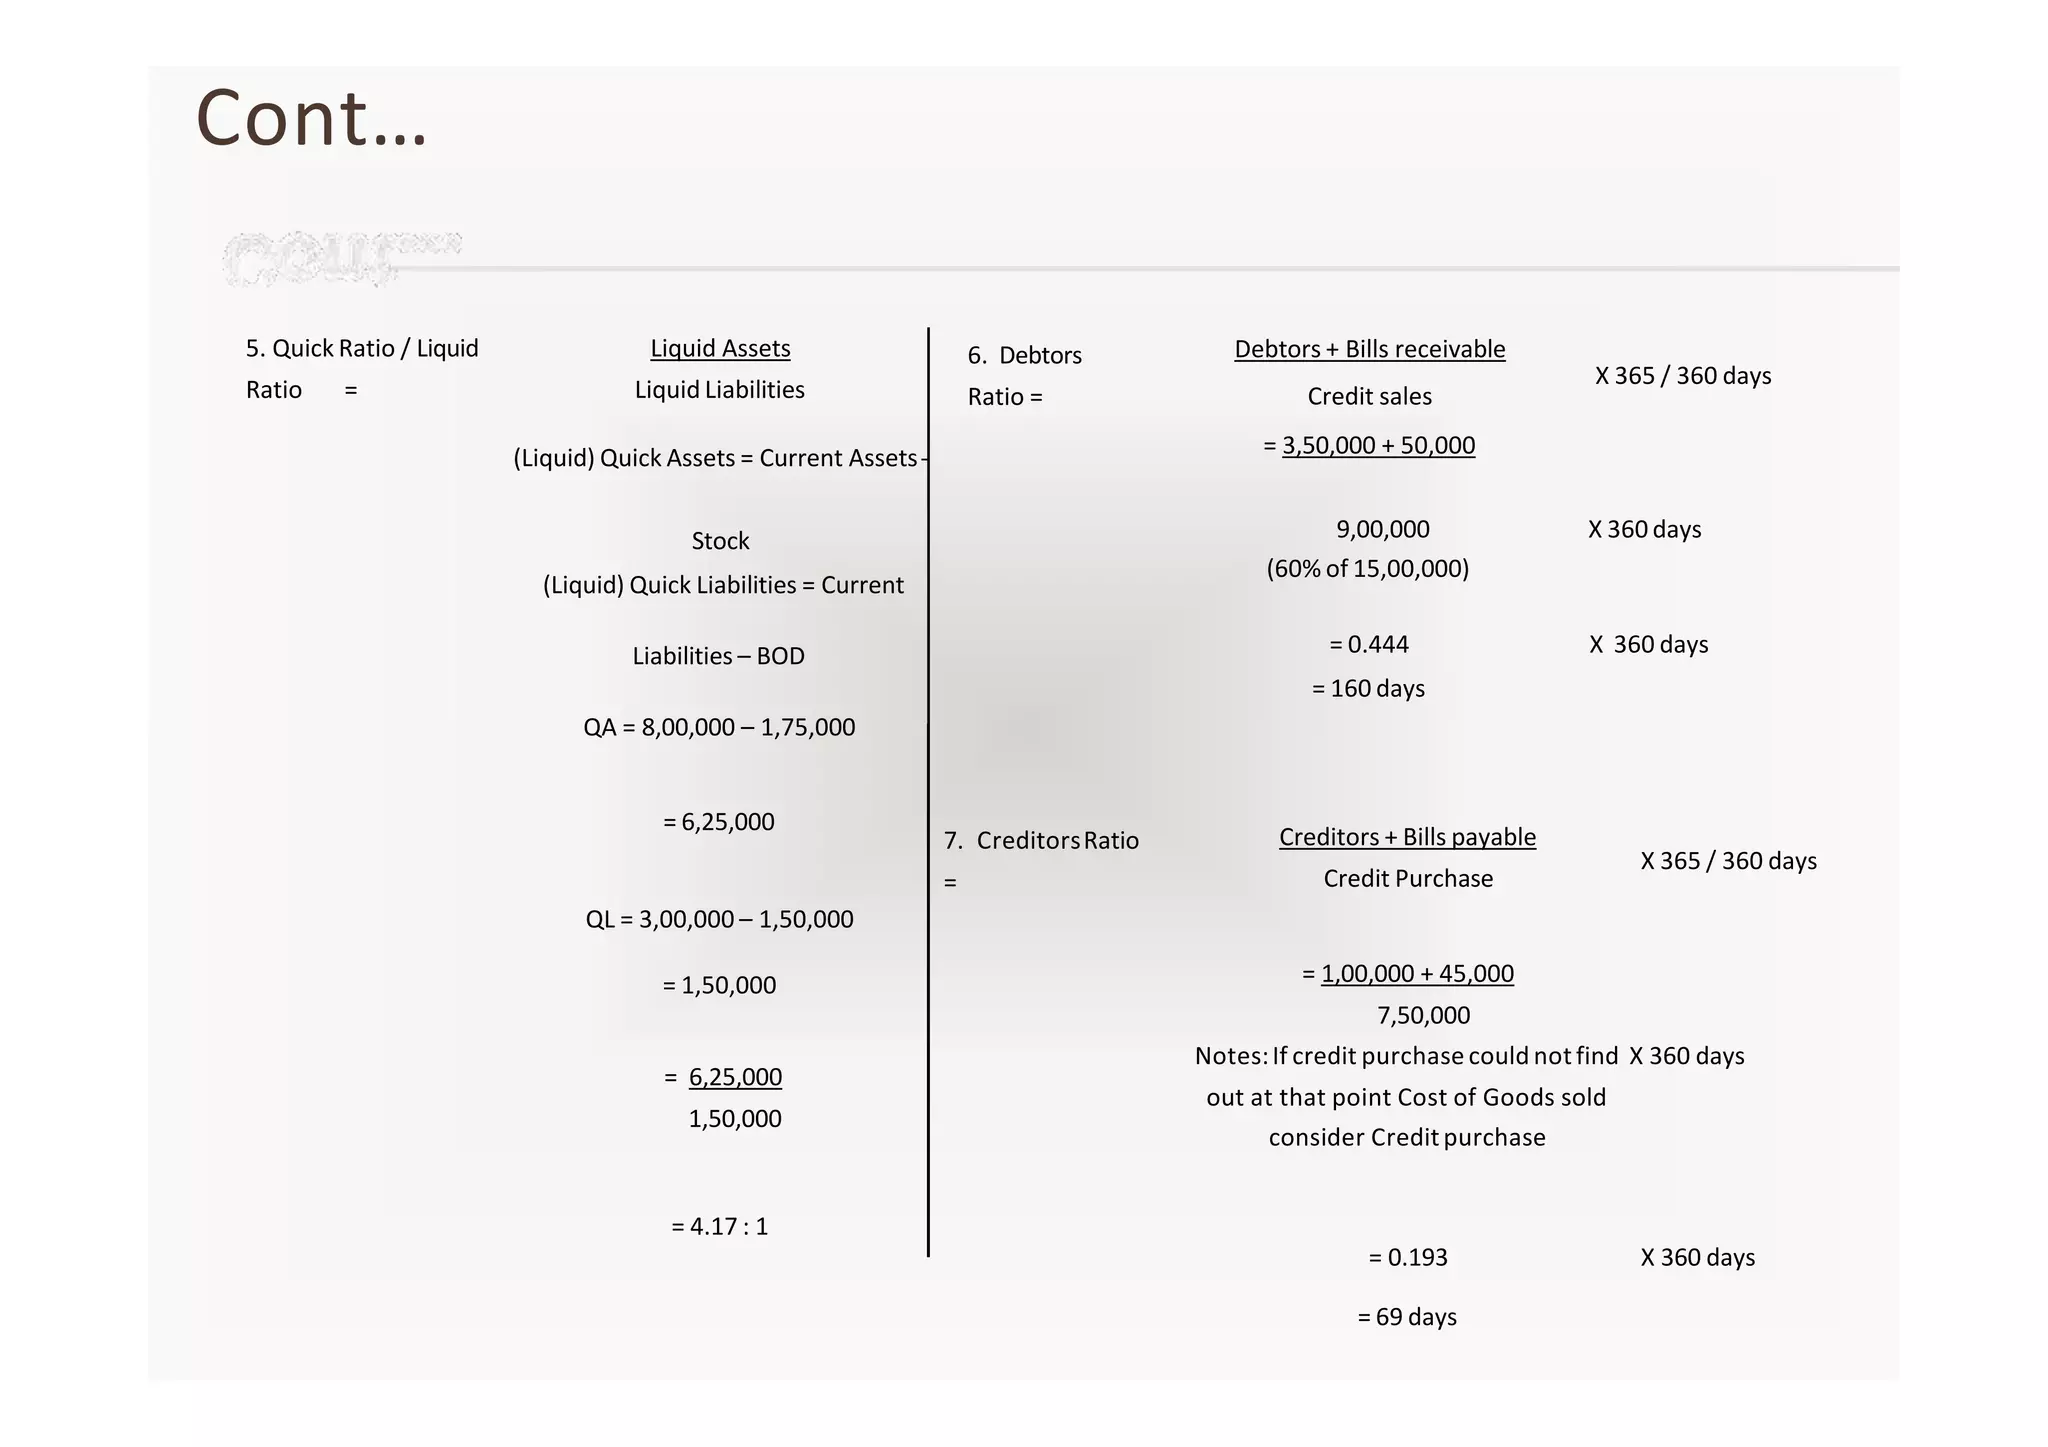
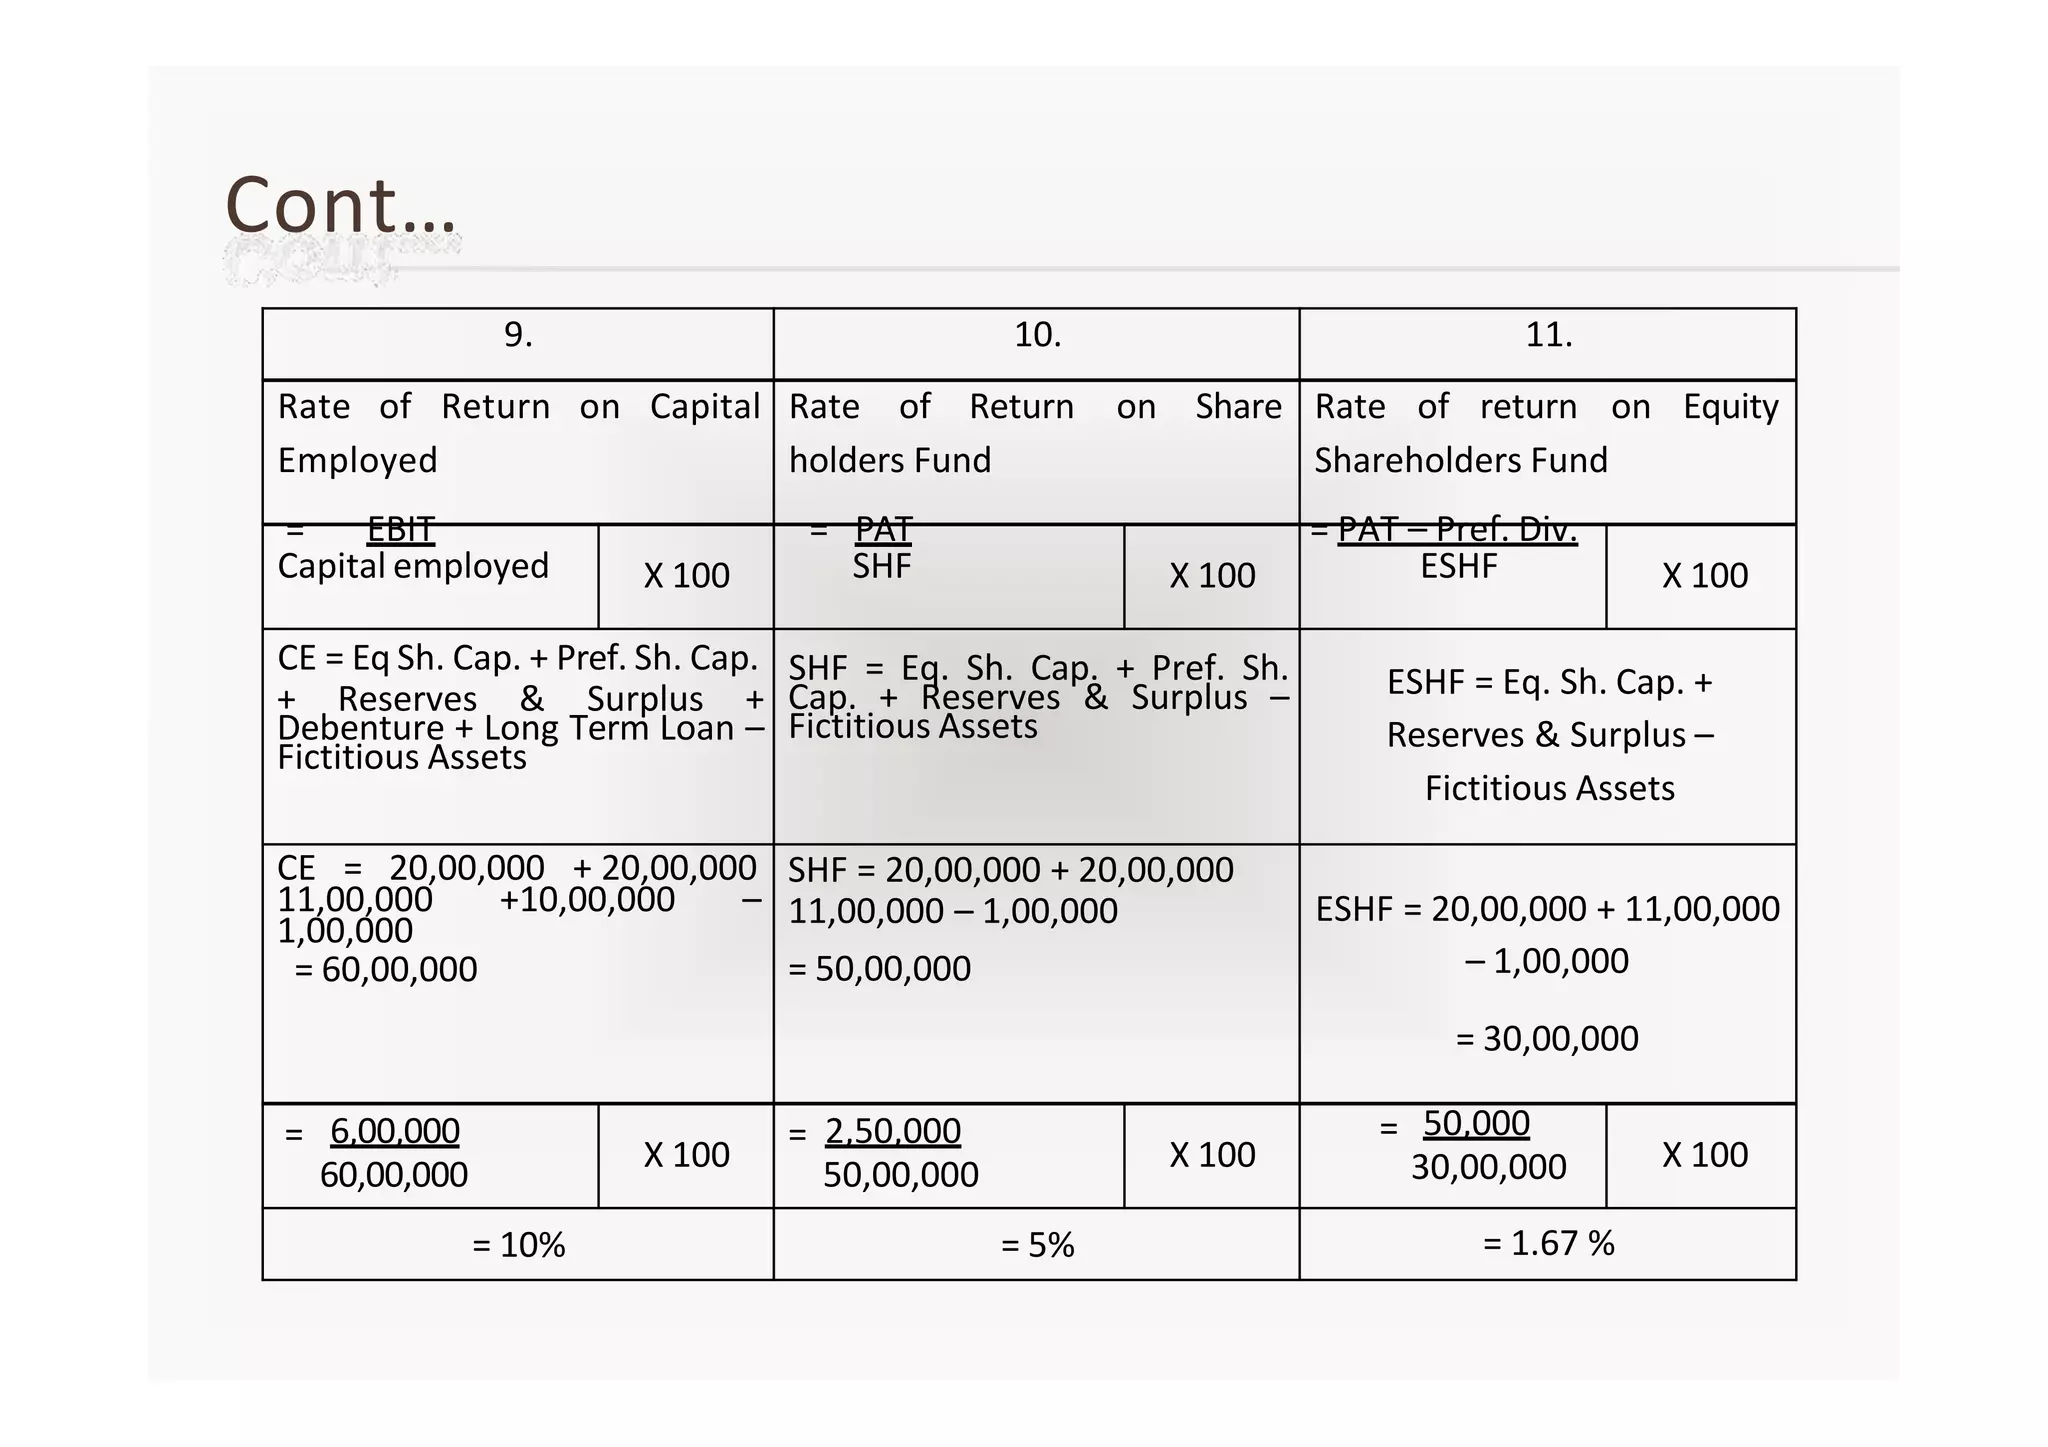
RATIO ANALYSIS
Topics to be Enlightened…
× Introduction and Meaning
× Interpretation of Ratio
× Usefulness of Ratio Analysis
× Limitations of Ratio Analysis
× Classification of Ratio Analysis
+ Traditional Classification
+ Functional Classification
× Profitability Ratio
× Turnover Ratio
× Liquidity Ratio
× Ownership/Solvency Ratio
+ Classification by Users
Introduction & Meaning
× Itis one of the tools of measuring financial performance of the
organization
× It is a comparative analysis between two factors
× Business performance can be measured by the use of ratios
× It must be interpreted against some standards
× Apart from the absolute profit figures, the management might find a
need of relative data/information about the variables, thus, at this
time, ratio analysis assists the management.
× It evaluates the financial conditions and the purpose of a firm
through various yardsticks
× This tool is useful for all the various stakeholders of the company
like, shareholders, bankers, creditors, lenders, investors,
government, etc.
× The following are four ways to analyze ratio:
Four Ways to Analyse Ratio
• It helps you
analyse the
movement of
the variables
compared
• This helps to
make
comparisons
of two
companies of
• It helps you
look into the
persistent
record of a
particular
• It helps the
firm to
determine
the group of
ratios of
across years the same
industry
variable for
detailed
analysis
variable in
various
forms, e.g.
gross profit,
net profit,
operating
profit, etc.
Usefulness of Ratio Analysis
× Simplification of data
× Helps in disclosing operational efficiency
× Benchmark for comparison
× Planning
× Managerial tool
× Analyzing financial statement
× Scanning Device
Limitations of Ratio Analysis
× It depends on the past data which in itself serves as a limiting
factor.
× It may not represent the correct picture of the business.
× Onlyaccountinginformationisusedwhileanalyzing and
interpreting the results of ratio analysis.
× In taking corrective actions, the management might concentrate
more on improving the ratio over the years rather than solving
the major reason behind such an adverse condition.
× At times, when the two items are compared, it is not necessary
that due to the items in questions leads to the changes in the
output. There could be other reasons as well which lead to the
adverse ratio.
Classification of Ratio Analysis
Classification
Traditional Functional
Traditional Classification
Traditional
Revenue
Statement
Ratios
BalanceSheet
Ratios
Composite
Ratio
Functional Classification
Classification by Users
Profitability Ratio
× In relation to sales
+ Gross profit ratio
+ Operating ratio
+ Expense ratio
+ Operating profit ratio
+ Net profit ratio
× In relation to investment
+ Return on capital employed
+ Return on shareholders fund
+ Return on equity shareholders fund
In Terms of Sales
× Gross profit ratio – It measures the gross margin of
profit over the total sales of a unit:
Gross Profit Margin =
Gross profit
Sales
X 100
× Operating ratio –Operating ratio is measured to find
out proportion of cost of goods sold and operating
expenses to sales:
Operating ratio = Cost of goods sold + Operating expenses
Net Sales
X 100
Cont…
× Expense Ratio
+ Operating expense ratio
+ Material cost ratio
+ Labor cost ratio
+ Conversion cost ratio
+ Administration cost ratio
+ Selling & distribution cost ratio
Cont…
× Operating Profit Ratio - It is calculated by
reducing administration, selling and distribution
expenses from Gross Profits:
Operating Profit ratio =
Operating Profit
Net Sales X 100
× Net Profit Ratio - It measures the margin of revenues
available to the owners of the business after satisfying
all costs, expense, and losses:
Net Profit Margin =
Net Profit
Net Sales X 100
In Terms of Investments
× Return on Capital Employed - The return on the
investment is measured by dividing the net profit or the
income by total capital invested:
ROI = X 100
Net Profit (EBIT)
Capital Employed
× Return on Shareholders Fund - This ratio indicates the
margin available for the shareholders after satisfying
all other obligations and taxes as well:
ROSF = Net Profit (PAT)
Shareholders Fund
X 100
Cont…
× Return on Equity Shareholders Fund - This
measures returns available for equity
shareholders, but it excludes preference share
capital:
ROESF =
Net Profit (PAT) – preference Dividend
Equity Shareholders Fund
X 100
Du-Pont Chart
Return on investment (%)
Net profit margin Total assets
Net profit Net Sales Net Sales Total Assets
Net Sales + Non operating surplus Net Fixed Assets
TotalCosts Current Assets
Cost of Goods Sold Cash & BankBalances
Operating Expenses Receivables
Interest Inventories
Tax Other Current assets
Liquidity Ratio
× Current Ratio - This ratio measures the liquidity position of the concern for a
short period:
Current Ratio =
CurrentAssets
Current Liabilities
× Quick Ratio - It is designed to show how the amount of cash is made
available to meet immediate payments:
Quick Ratio =
Liquid Assets
Liquid Liabilities
× Acid Test Ratio - The actual liquidity is measured by comparing the cash and
bank balance as well as the marketable securities with liquid liabilities:
Acid-test Ratio =
Quick Assets
Liquid Liabilities
Turnover Ratio
× Inventory turnover ratio –
Inventory turnover Ratio =
× Debtorsturnoverratio–
Cost of goods sold
Average inventory
Debtors Ratio =
Debtors + Bills Receivable
Average Daily Credit Sales
Credit Sales =
Credit Sales
365 / 360 days
Cont…
× Creditors turnover ratio –
Creditor Turnover Ratio =
Creditors + Bills Payable
Average Credit Purchase per day
Credit Purchases
365 / 360 days
Credit Purchase Per day =
× Fixed assets turnover ratio
Fixed Assets Turnover Ratio =
Net Sales
FixedAssets
× Total assets turnover ratio
Total Assets Turnover Ratio =
Net Sales
TotalAssets
Ownership Ratio
× Debt – Equity Ratio
Debt-equity Ratio =
Long Term Liabilities
Shareholders' funds
× Shareholders equity ratio
Shareholders Funds
Total assets (tangible)
Shareholders Equity Ratio =
× Capital gearing ratio
Capital Gearing Ratio =
Fixed Int. or Dividend Securities
Eq. S. H. Fund/ Net worth
× Long term funds to fixed assets ratio
Fixed Assets Ratio =
Long term Funds
Fixed Assets
Practical Problems
× Problem – I Revenue Ratios
× Problem – II Balance Sheet Ratios
× Problem – III Composite Ratios
Problem – I
The following Trading and Profit and Loss Account of Fantasy Ltd. for the
year 31-3-2000 is given below. Calculate: Gross Profit Ratio, Expenses
Ratio, Operating Ratio, Net Profit Ratio, Operating Ratio, Stock Turnover
Ratio.
Particular Rs. Particular Rs.
To Opening Stock 76,250 By Sales 5,00,000
“ Purchases 3,15,250 “ Closing stock 98,500
“ Carriage and Freight 2,000
“ Wages 5,000
“ Gross Profit b/d 2,00,000
5,98,500 5,98,500
To Administration expenses 1,01,000 By Gross Profit b/d 2,00,000
“ Selling and Dist. expenses 12,000 “ Non-operating incomes:
“ Non-operating expenses 2,000 “ Interest on Securities 1,500
“ Financial Expenses 7,000 “ Dividend on shares 3,750
Net Profit c/d 84,000 “ Profit on sale of shares 750
2,06,000 2,06,000
SOLUTION – I
1. Gross Profit Margin =
Gross profit
Sales
X 100
2. Expenses Ratio =
Op. Expenses
X 100
Net Sales
2,00,000
5,00,000
X 100
1,13,000
5,00,000
X 100
= 22.60%
= 40%
3.
Operating Ratio =
Cost of goods sold + Op. Expenses
X 100
Net Sales
3,00,000 + 1,13,000
5,00,000
X 100
= 82.60%
Cost of Goods Sold = Op. stock + purchases + carriage and
Freight + wages – Closing Stock
= 76250 + 315250 + 2000 + 5000 + - 98500
= 3,00,000 Rs.
Cont…
4. Net Profit Ratio =
Net Profit
Net Sales
84,000
5,00,000
= 16.8%
X 100
X 100
5. Operating Profit Ratio =
Op. Profit
X 100
Net Sales
Operating Profit = Sales – ( COGS + Op. Exp.)
87,000
5,00,000
= 17.40%
X 100
6. Stock Turnover Ratio =
Cost of goods sold
Avg. Stock
3,00,000
87,375
= 3.43 times
Problem – II
THE BALANCE SHEET OF PUNJAB AUTO LIMITED AS ON 31-12-2002 WAS
AS FOLLOWS:
FROM THE BELOW, COMPUTE (A) THE CURRENT RATIO, (B) QUICK RATIO,
(C) DEBT-EQUITY RATIO, AND (D) PROPRIETARY RATIO
Particular Rs. Particular Rs.
Equity Share Capital 40,000 Plant and Machinery 24,000
Capital Reserve 8,000 Land and Buildings 40,000
8% Loan on Mortgage 32,000 Furniture & Fixtures 16,000
Creditors 16,000 Stock 12,000
Bank overdraft 4,000 Debtors 12,000
Taxation: Investments (Short-term) 4,000
Current 4,000 Cash in hand 12,000
Future 4,000
Profit and Loss A/c 12,000
1,20,000
1,20,000
SOLUTION – II
1. Current Ratio =
Current Assets
Current liabilities
Current Assets = Stock + debtors + Investments (short term) + Cash In hand
Current Liabilities = Creditors + bank overdraft + Provision for Taxation (current &
Future)
CA = 12000 + 12000 + 4000 + 12000
= 40,000
CL = 16000 + 4000 + 4000 + 4000
= 28,000
= 40,000
28,000
= 1.43 : 1
2. Quick Ratio =
Quick Assets
Quick Liabilities
Quick Assets = Current Assets - Stock
Quick Liabilities = Current Liabilities – (BOD + PFT future)
QA = 40,000 – 12,000
= 28,000
QL = 28,000 – (4,000 + 4,000)
= 20,000
= 28,000
20,000
= 1.40 : 1
CONTINUE…
3.
Debt – Equity Ratio =
Long Term Debt (Liabilities)
Shareholders Fund
LTL = Debentures + long term loans
SHF = Eq. Sh. Cap. + Reserves & Surplus + Preference Sh. Cap. –
Fictitious Assets
LTL = 32,000
SHF = 40,000 + 8,000 + 12,000
= 60,000
= 32,000
60,000
= 0.53 : 1
4. Proprietary Ratio =
Shareholders’ Funds
Total Assets
SHF = Eq. Sh. Cap. + Reserves & Surplus + Preference Sh. Cap. –
Fictitious Assets
Total Assets = Total Assets – Fictitious Assets
SHF = 40,000 + 8,000 + 12,000
= 60,000
TA = 1,20,000
= 60,000
1,20,000
= 0.5 : 1
PROBLEM – III
The details of Shreenath company are as under:
Beside the details mentioned above, the opening stock was of Rs. 3,25,000. Taking 360 days of the year,
calculate the following ratios; also discuss the position of the company: (1) Gross profit ratio. (2) Stock
turnover ratio. (3) Operating ratio. (4) Current ratio. (5) Liquid ratio. (6) Debtors ratio. (7) Creditors ratio. (8)
Proprietary ratio. (9) Rate of return on net capital employed. (10) Rate of return on equity shares.
Particular Rs. Particular Rs.
Equity share capital 20,00,000 Fixed Assets 55,00,000
10% Preference share capital 20,00,000 Stock 1,75,000
Reserves 11,00,000 Debtors 3,50,000
10% Debentures 10,00,000 Bills receivable 50,000
Creditors 1,00,000 Cash 2,25,000
Bank-overdraft 1,50,000 Fictitious Assets 1,00,000
Bills payable 45,000
Outstanding expenses 5,000
64,00,000 64,00,000
Sales (40% cash sales) 15,00,000
Less: Costof sales 7,50,000
Gross Profit: 7,50,000
Less: Office Exp. (including int. on debentures) 1,25,000
Selling Exp. 1,25,000 2,50,000
Profit before Taxes: 5,00,000
Less: Taxes 2,50,000
Net Profit: 2,50,000
SOLUTION – III
1. Gross Profit
Margin =
Gross profit X 100
Sales
7,50,000
15,00,000
X 100
= 50%
2. Stock Turnover Ratio =
Cost of goods sold
Avg. Stock
Avg. stock = Opening Stock + Closing
Stock
2
COGS = Sales – GP
3,25,000 + 1,75,000
2
AS = 2,50,000
COGS = 15,00,000 – 7,50,000
7,50,000
= 7,50,000
2,50,000
= 3 times
Cont…
3. Operating Profit Ratio =
Op. Profit
Net Sales
X 100 4. Current Ratio =
Current Assets
Current liabilities
Operating Profit = Sales
– (Op. Exp. + COGS.)
OP = 15,00,000
– (7,50,000 +
1,25,000 +
25,000)
Current Assets = Stock + debtors + Bills receivable
+ Cash
Current Liabilities = Creditors + bank overdraft +
Bills payable + Outstanding expenses
CA = 1,75,000 + 3,50,000 + 50,000 + 2,25,000
= 6,00,000
X 100
(excluding
Interest on
Debentures)
= 6,00,000
15,00,000
= 40%
= 8,00,000
CL = 1,00,000 + 1,50,000 + 45,000 + 5,000
= 3,00,000
= 8,00,000
3,00,000
= 2.67 : 1
Cont…
5. Quick Ratio / Liquid
Ratio =
Liquid Assets
Liquid Liabilities
(Liquid) Quick Assets = Current Assets-
6. Debtors
Ratio =
X 365 / 360 days
Debtors + Bills receivable
Credit sales
= 3,50,000 + 50,000
Stock
(Liquid) Quick Liabilities = Current
9,00,000
(60% of 15,00,000)
X 360 days
Liabilities – BOD
QA = 8,00,000 – 1,75,000
X 360 days
= 0.444
= 160 days
= 6,25,000
QL = 3,00,000 – 1,50,000
= 1,50,000
= 6,25,000
1,50,000
7. CreditorsRatio
=
Creditors + Bills payable
Credit Purchase
X 365 / 360 days
= 1,00,000 + 45,000
7,50,000
Notes:If credit purchase could notfind X 360 days
out at that point Cost of Goods sold
consider Creditpurchase
= 4.17 : 1
= 0.193 X 360 days
= 69 days
Cont…
8. Proprietary Ratio =
Shareholders’ Funds
Total Assets
SHF = Eq. Sh. Cap. + Reserves & Surplus + Preference Sh.
Cap. – Fictitious Assets
Total Assets = Total Assets – Fictitious Assets
SHF = 20,00,000 + 20,00,000 + 11,00,000 –1,00,000
= 50,00,000
TA = 64,00,000 – 1,00,000
= 63,00,000
= 50,00,000
63,00,000
= 0.79 : 1
Cont…
Rate of Return on Capital Employed Rate of Return on Share holders
Fund
Rate of return on Equity
Shareholders Fund
= EBIT
Capital employed X 100
= PAT
SHF X 100
= PAT – Pref. Div.
ESHF X 100
CE = Eq Sh. Cap. + Pref. Sh. Cap. +
Reserves & Surplus + Debenture +
Long Term Loan – Fictitious Assets
SHF = Eq. Sh. Cap. + Pref. Sh. Cap. +
Reserves & Surplus – Fictitious Assets ESHF = Eq. Sh. Cap. + Reserves &
Surplus – Fictitious Assets
Sales
15,00,000
Less: Cost of goods sold 7,50,000
Gross profit 7,50,000
Less: Operating expenses (including Depreciation) 1,50,000
Earnings before Interest & Tax (EBIT) 6,00,000
Less: Interest Cost 1,00,000
Earnings before Tax (EBT) 5,00,000
Less: Tax liability 2,50,000
Earnings after Tax (EAT/ PAT) 2,50,000
Less: Preference share dividend 2,00,000
Distributional Profit 50,000
Cont…
9. 10. 11.
Rate of Return
Employed
on Capital Rate of Return
holders Fund
on Share Rate of return on Equity
Shareholders Fund
= EBIT
Capital employed X 100
= PAT
SHF X 100
= PAT – Pref. Div.
ESHF X 100
CE = Eq Sh. Cap. + Pref. Sh. Cap.
+ Reserves & Surplus +
Debenture + Long Term Loan –
Fictitious Assets
SHF = Eq. Sh. Cap. + Pref. Sh.
Cap. + Reserves & Surplus –
Fictitious Assets
ESHF = Eq. Sh. Cap. +
Reserves & Surplus –
Fictitious Assets
CE = 20,00,000 + 20,00,000
11,00,000 +10,00,000 –
1,00,000
= 60,00,000
SHF = 20,00,000 + 20,00,000
11,00,000 – 1,00,000 ESHF = 20,00,000 + 11,00,000
= 50,00,000 – 1,00,000
= 30,00,000
= 6,00,000
60,00,000
X 100
= 2,50,000
50,00,000
X 100
= 50,000
30,00,000 X 100
= 10% = 5% = 1.67 %

ratio analysis (1).pptx

  • 1.
  • 2.
    Topics to beEnlightened… × Introduction and Meaning × Interpretation of Ratio × Usefulness of Ratio Analysis × Limitations of Ratio Analysis × Classification of Ratio Analysis + Traditional Classification + Functional Classification × Profitability Ratio × Turnover Ratio × Liquidity Ratio × Ownership/Solvency Ratio + Classification by Users
  • 3.
    Introduction & Meaning ×Itis one of the tools of measuring financial performance of the organization × It is a comparative analysis between two factors × Business performance can be measured by the use of ratios × It must be interpreted against some standards × Apart from the absolute profit figures, the management might find a need of relative data/information about the variables, thus, at this time, ratio analysis assists the management. × It evaluates the financial conditions and the purpose of a firm through various yardsticks × This tool is useful for all the various stakeholders of the company like, shareholders, bankers, creditors, lenders, investors, government, etc. × The following are four ways to analyze ratio:
  • 4.
    Four Ways toAnalyse Ratio • It helps you analyse the movement of the variables compared • This helps to make comparisons of two companies of • It helps you look into the persistent record of a particular • It helps the firm to determine the group of ratios of across years the same industry variable for detailed analysis variable in various forms, e.g. gross profit, net profit, operating profit, etc.
  • 5.
    Usefulness of RatioAnalysis × Simplification of data × Helps in disclosing operational efficiency × Benchmark for comparison × Planning × Managerial tool × Analyzing financial statement × Scanning Device
  • 6.
    Limitations of RatioAnalysis × It depends on the past data which in itself serves as a limiting factor. × It may not represent the correct picture of the business. × Onlyaccountinginformationisusedwhileanalyzing and interpreting the results of ratio analysis. × In taking corrective actions, the management might concentrate more on improving the ratio over the years rather than solving the major reason behind such an adverse condition. × At times, when the two items are compared, it is not necessary that due to the items in questions leads to the changes in the output. There could be other reasons as well which lead to the adverse ratio.
  • 7.
    Classification of RatioAnalysis Classification Traditional Functional
  • 8.
  • 9.
  • 10.
  • 11.
    Profitability Ratio × Inrelation to sales + Gross profit ratio + Operating ratio + Expense ratio + Operating profit ratio + Net profit ratio × In relation to investment + Return on capital employed + Return on shareholders fund + Return on equity shareholders fund
  • 12.
    In Terms ofSales × Gross profit ratio – It measures the gross margin of profit over the total sales of a unit: Gross Profit Margin = Gross profit Sales X 100 × Operating ratio –Operating ratio is measured to find out proportion of cost of goods sold and operating expenses to sales: Operating ratio = Cost of goods sold + Operating expenses Net Sales X 100
  • 13.
    Cont… × Expense Ratio +Operating expense ratio + Material cost ratio + Labor cost ratio + Conversion cost ratio + Administration cost ratio + Selling & distribution cost ratio
  • 14.
    Cont… × Operating ProfitRatio - It is calculated by reducing administration, selling and distribution expenses from Gross Profits: Operating Profit ratio = Operating Profit Net Sales X 100 × Net Profit Ratio - It measures the margin of revenues available to the owners of the business after satisfying all costs, expense, and losses: Net Profit Margin = Net Profit Net Sales X 100
  • 15.
    In Terms ofInvestments × Return on Capital Employed - The return on the investment is measured by dividing the net profit or the income by total capital invested: ROI = X 100 Net Profit (EBIT) Capital Employed × Return on Shareholders Fund - This ratio indicates the margin available for the shareholders after satisfying all other obligations and taxes as well: ROSF = Net Profit (PAT) Shareholders Fund X 100
  • 16.
    Cont… × Return onEquity Shareholders Fund - This measures returns available for equity shareholders, but it excludes preference share capital: ROESF = Net Profit (PAT) – preference Dividend Equity Shareholders Fund X 100
  • 17.
    Du-Pont Chart Return oninvestment (%) Net profit margin Total assets Net profit Net Sales Net Sales Total Assets Net Sales + Non operating surplus Net Fixed Assets TotalCosts Current Assets Cost of Goods Sold Cash & BankBalances Operating Expenses Receivables Interest Inventories Tax Other Current assets
  • 18.
    Liquidity Ratio × CurrentRatio - This ratio measures the liquidity position of the concern for a short period: Current Ratio = CurrentAssets Current Liabilities × Quick Ratio - It is designed to show how the amount of cash is made available to meet immediate payments: Quick Ratio = Liquid Assets Liquid Liabilities × Acid Test Ratio - The actual liquidity is measured by comparing the cash and bank balance as well as the marketable securities with liquid liabilities: Acid-test Ratio = Quick Assets Liquid Liabilities
  • 19.
    Turnover Ratio × Inventoryturnover ratio – Inventory turnover Ratio = × Debtorsturnoverratio– Cost of goods sold Average inventory Debtors Ratio = Debtors + Bills Receivable Average Daily Credit Sales Credit Sales = Credit Sales 365 / 360 days
  • 20.
    Cont… × Creditors turnoverratio – Creditor Turnover Ratio = Creditors + Bills Payable Average Credit Purchase per day Credit Purchases 365 / 360 days Credit Purchase Per day = × Fixed assets turnover ratio Fixed Assets Turnover Ratio = Net Sales FixedAssets × Total assets turnover ratio Total Assets Turnover Ratio = Net Sales TotalAssets
  • 21.
    Ownership Ratio × Debt– Equity Ratio Debt-equity Ratio = Long Term Liabilities Shareholders' funds × Shareholders equity ratio Shareholders Funds Total assets (tangible) Shareholders Equity Ratio = × Capital gearing ratio Capital Gearing Ratio = Fixed Int. or Dividend Securities Eq. S. H. Fund/ Net worth × Long term funds to fixed assets ratio Fixed Assets Ratio = Long term Funds Fixed Assets
  • 22.
    Practical Problems × Problem– I Revenue Ratios × Problem – II Balance Sheet Ratios × Problem – III Composite Ratios
  • 23.
    Problem – I Thefollowing Trading and Profit and Loss Account of Fantasy Ltd. for the year 31-3-2000 is given below. Calculate: Gross Profit Ratio, Expenses Ratio, Operating Ratio, Net Profit Ratio, Operating Ratio, Stock Turnover Ratio. Particular Rs. Particular Rs. To Opening Stock 76,250 By Sales 5,00,000 “ Purchases 3,15,250 “ Closing stock 98,500 “ Carriage and Freight 2,000 “ Wages 5,000 “ Gross Profit b/d 2,00,000 5,98,500 5,98,500 To Administration expenses 1,01,000 By Gross Profit b/d 2,00,000 “ Selling and Dist. expenses 12,000 “ Non-operating incomes: “ Non-operating expenses 2,000 “ Interest on Securities 1,500 “ Financial Expenses 7,000 “ Dividend on shares 3,750 Net Profit c/d 84,000 “ Profit on sale of shares 750 2,06,000 2,06,000
  • 24.
    SOLUTION – I 1.Gross Profit Margin = Gross profit Sales X 100 2. Expenses Ratio = Op. Expenses X 100 Net Sales 2,00,000 5,00,000 X 100 1,13,000 5,00,000 X 100 = 22.60% = 40% 3. Operating Ratio = Cost of goods sold + Op. Expenses X 100 Net Sales 3,00,000 + 1,13,000 5,00,000 X 100 = 82.60% Cost of Goods Sold = Op. stock + purchases + carriage and Freight + wages – Closing Stock = 76250 + 315250 + 2000 + 5000 + - 98500 = 3,00,000 Rs.
  • 25.
    Cont… 4. Net ProfitRatio = Net Profit Net Sales 84,000 5,00,000 = 16.8% X 100 X 100 5. Operating Profit Ratio = Op. Profit X 100 Net Sales Operating Profit = Sales – ( COGS + Op. Exp.) 87,000 5,00,000 = 17.40% X 100 6. Stock Turnover Ratio = Cost of goods sold Avg. Stock 3,00,000 87,375 = 3.43 times
  • 26.
    Problem – II THEBALANCE SHEET OF PUNJAB AUTO LIMITED AS ON 31-12-2002 WAS AS FOLLOWS: FROM THE BELOW, COMPUTE (A) THE CURRENT RATIO, (B) QUICK RATIO, (C) DEBT-EQUITY RATIO, AND (D) PROPRIETARY RATIO Particular Rs. Particular Rs. Equity Share Capital 40,000 Plant and Machinery 24,000 Capital Reserve 8,000 Land and Buildings 40,000 8% Loan on Mortgage 32,000 Furniture & Fixtures 16,000 Creditors 16,000 Stock 12,000 Bank overdraft 4,000 Debtors 12,000 Taxation: Investments (Short-term) 4,000 Current 4,000 Cash in hand 12,000 Future 4,000 Profit and Loss A/c 12,000 1,20,000 1,20,000
  • 27.
    SOLUTION – II 1.Current Ratio = Current Assets Current liabilities Current Assets = Stock + debtors + Investments (short term) + Cash In hand Current Liabilities = Creditors + bank overdraft + Provision for Taxation (current & Future) CA = 12000 + 12000 + 4000 + 12000 = 40,000 CL = 16000 + 4000 + 4000 + 4000 = 28,000 = 40,000 28,000 = 1.43 : 1 2. Quick Ratio = Quick Assets Quick Liabilities Quick Assets = Current Assets - Stock Quick Liabilities = Current Liabilities – (BOD + PFT future) QA = 40,000 – 12,000 = 28,000 QL = 28,000 – (4,000 + 4,000) = 20,000 = 28,000 20,000 = 1.40 : 1
  • 28.
    CONTINUE… 3. Debt – EquityRatio = Long Term Debt (Liabilities) Shareholders Fund LTL = Debentures + long term loans SHF = Eq. Sh. Cap. + Reserves & Surplus + Preference Sh. Cap. – Fictitious Assets LTL = 32,000 SHF = 40,000 + 8,000 + 12,000 = 60,000 = 32,000 60,000 = 0.53 : 1 4. Proprietary Ratio = Shareholders’ Funds Total Assets SHF = Eq. Sh. Cap. + Reserves & Surplus + Preference Sh. Cap. – Fictitious Assets Total Assets = Total Assets – Fictitious Assets SHF = 40,000 + 8,000 + 12,000 = 60,000 TA = 1,20,000 = 60,000 1,20,000 = 0.5 : 1
  • 29.
    PROBLEM – III Thedetails of Shreenath company are as under: Beside the details mentioned above, the opening stock was of Rs. 3,25,000. Taking 360 days of the year, calculate the following ratios; also discuss the position of the company: (1) Gross profit ratio. (2) Stock turnover ratio. (3) Operating ratio. (4) Current ratio. (5) Liquid ratio. (6) Debtors ratio. (7) Creditors ratio. (8) Proprietary ratio. (9) Rate of return on net capital employed. (10) Rate of return on equity shares. Particular Rs. Particular Rs. Equity share capital 20,00,000 Fixed Assets 55,00,000 10% Preference share capital 20,00,000 Stock 1,75,000 Reserves 11,00,000 Debtors 3,50,000 10% Debentures 10,00,000 Bills receivable 50,000 Creditors 1,00,000 Cash 2,25,000 Bank-overdraft 1,50,000 Fictitious Assets 1,00,000 Bills payable 45,000 Outstanding expenses 5,000 64,00,000 64,00,000 Sales (40% cash sales) 15,00,000 Less: Costof sales 7,50,000 Gross Profit: 7,50,000 Less: Office Exp. (including int. on debentures) 1,25,000 Selling Exp. 1,25,000 2,50,000 Profit before Taxes: 5,00,000 Less: Taxes 2,50,000 Net Profit: 2,50,000
  • 30.
    SOLUTION – III 1.Gross Profit Margin = Gross profit X 100 Sales 7,50,000 15,00,000 X 100 = 50% 2. Stock Turnover Ratio = Cost of goods sold Avg. Stock Avg. stock = Opening Stock + Closing Stock 2 COGS = Sales – GP 3,25,000 + 1,75,000 2 AS = 2,50,000 COGS = 15,00,000 – 7,50,000 7,50,000 = 7,50,000 2,50,000 = 3 times
  • 31.
    Cont… 3. Operating ProfitRatio = Op. Profit Net Sales X 100 4. Current Ratio = Current Assets Current liabilities Operating Profit = Sales – (Op. Exp. + COGS.) OP = 15,00,000 – (7,50,000 + 1,25,000 + 25,000) Current Assets = Stock + debtors + Bills receivable + Cash Current Liabilities = Creditors + bank overdraft + Bills payable + Outstanding expenses CA = 1,75,000 + 3,50,000 + 50,000 + 2,25,000 = 6,00,000 X 100 (excluding Interest on Debentures) = 6,00,000 15,00,000 = 40% = 8,00,000 CL = 1,00,000 + 1,50,000 + 45,000 + 5,000 = 3,00,000 = 8,00,000 3,00,000 = 2.67 : 1
  • 32.
    Cont… 5. Quick Ratio/ Liquid Ratio = Liquid Assets Liquid Liabilities (Liquid) Quick Assets = Current Assets- 6. Debtors Ratio = X 365 / 360 days Debtors + Bills receivable Credit sales = 3,50,000 + 50,000 Stock (Liquid) Quick Liabilities = Current 9,00,000 (60% of 15,00,000) X 360 days Liabilities – BOD QA = 8,00,000 – 1,75,000 X 360 days = 0.444 = 160 days = 6,25,000 QL = 3,00,000 – 1,50,000 = 1,50,000 = 6,25,000 1,50,000 7. CreditorsRatio = Creditors + Bills payable Credit Purchase X 365 / 360 days = 1,00,000 + 45,000 7,50,000 Notes:If credit purchase could notfind X 360 days out at that point Cost of Goods sold consider Creditpurchase = 4.17 : 1 = 0.193 X 360 days = 69 days
  • 33.
    Cont… 8. Proprietary Ratio= Shareholders’ Funds Total Assets SHF = Eq. Sh. Cap. + Reserves & Surplus + Preference Sh. Cap. – Fictitious Assets Total Assets = Total Assets – Fictitious Assets SHF = 20,00,000 + 20,00,000 + 11,00,000 –1,00,000 = 50,00,000 TA = 64,00,000 – 1,00,000 = 63,00,000 = 50,00,000 63,00,000 = 0.79 : 1
  • 34.
    Cont… Rate of Returnon Capital Employed Rate of Return on Share holders Fund Rate of return on Equity Shareholders Fund = EBIT Capital employed X 100 = PAT SHF X 100 = PAT – Pref. Div. ESHF X 100 CE = Eq Sh. Cap. + Pref. Sh. Cap. + Reserves & Surplus + Debenture + Long Term Loan – Fictitious Assets SHF = Eq. Sh. Cap. + Pref. Sh. Cap. + Reserves & Surplus – Fictitious Assets ESHF = Eq. Sh. Cap. + Reserves & Surplus – Fictitious Assets Sales 15,00,000 Less: Cost of goods sold 7,50,000 Gross profit 7,50,000 Less: Operating expenses (including Depreciation) 1,50,000 Earnings before Interest & Tax (EBIT) 6,00,000 Less: Interest Cost 1,00,000 Earnings before Tax (EBT) 5,00,000 Less: Tax liability 2,50,000 Earnings after Tax (EAT/ PAT) 2,50,000 Less: Preference share dividend 2,00,000 Distributional Profit 50,000
  • 35.
    Cont… 9. 10. 11. Rateof Return Employed on Capital Rate of Return holders Fund on Share Rate of return on Equity Shareholders Fund = EBIT Capital employed X 100 = PAT SHF X 100 = PAT – Pref. Div. ESHF X 100 CE = Eq Sh. Cap. + Pref. Sh. Cap. + Reserves & Surplus + Debenture + Long Term Loan – Fictitious Assets SHF = Eq. Sh. Cap. + Pref. Sh. Cap. + Reserves & Surplus – Fictitious Assets ESHF = Eq. Sh. Cap. + Reserves & Surplus – Fictitious Assets CE = 20,00,000 + 20,00,000 11,00,000 +10,00,000 – 1,00,000 = 60,00,000 SHF = 20,00,000 + 20,00,000 11,00,000 – 1,00,000 ESHF = 20,00,000 + 11,00,000 = 50,00,000 – 1,00,000 = 30,00,000 = 6,00,000 60,00,000 X 100 = 2,50,000 50,00,000 X 100 = 50,000 30,00,000 X 100 = 10% = 5% = 1.67 %