Downloaded 88 times


This document is a project report submitted by [NAME] to Guru Gobind Singh Indraprastha University in partial fulfillment of the requirements for a Bachelor of Business Administration degree. The report focuses on ratio analysis of a particular industry and includes chapters on the introduction, research methodology, industry overview, company profile, theoretical perspective on ratio analysis, findings and analysis, and conclusions and recommendations. The introduction provides an overview of the study and its objectives, scope, significance and limitations. The research methodology chapter outlines the statement of the research problem, data collection process, presentation tools used, and research tools.


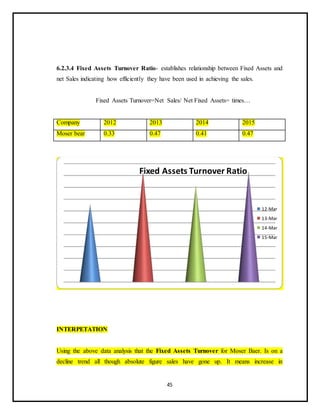
![Awareness of digital currency[1] (1).pptx](https://cdn.slidesharecdn.com/ss_thumbnails/awarenessofdigitalcurrency11-260125155504-b1badee4-thumbnail.jpg?width=640&height=640&fit=bounds)


