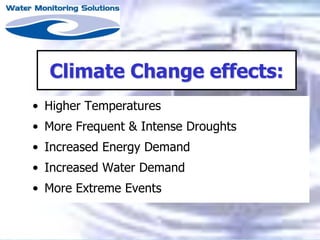
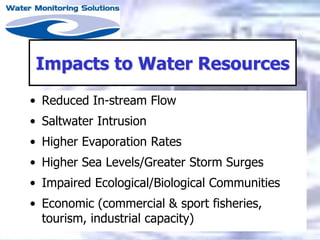
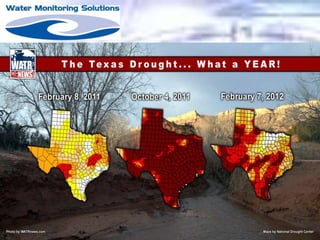
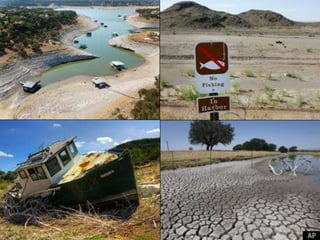
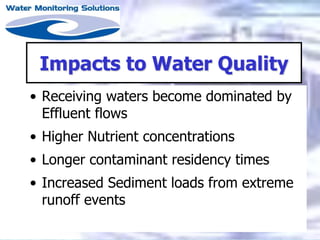
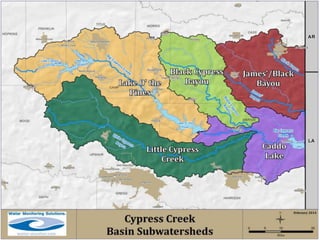
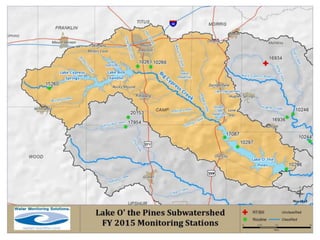
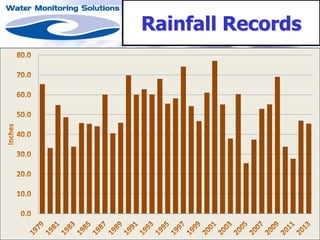
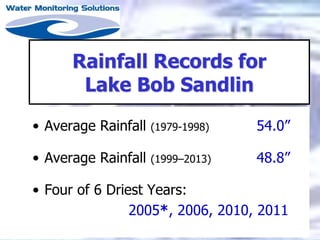
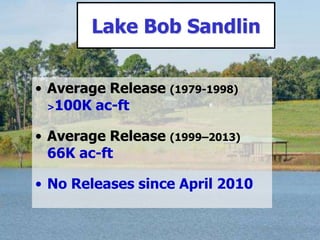
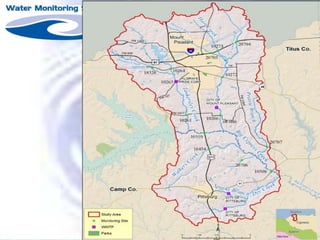
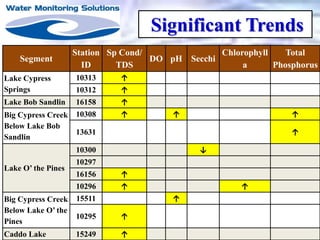
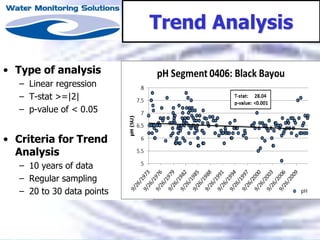
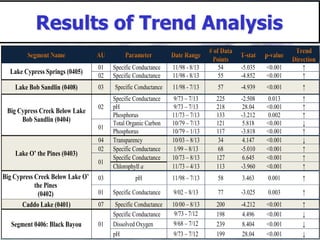
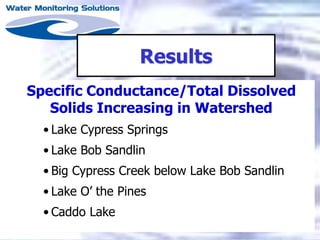
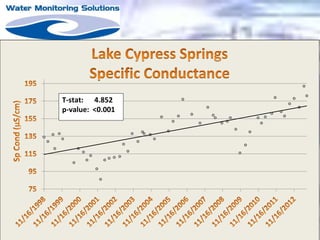
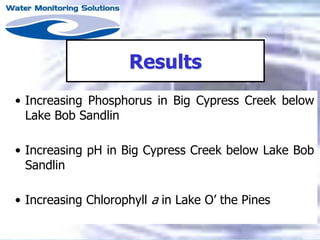
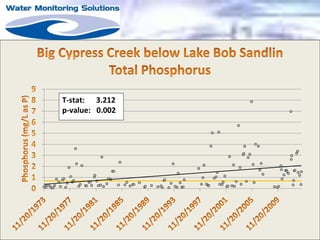
Presented by:
Randy Rushin
Water Monitoring Solutions, Inc.
The Impacts of Climate
Change on Water Quality
March 4, 2015
HUB Certified
Woman-Owned
Texas-Based
Small Business
nca2014.globalchange.gov
• 3-Years
• >300 Experts
• 60 Member Federal
Advisory Committee
• Review by National
Research Council of
the National Academy
of Sciences
Climate Change effects:
• Higher Temperatures
• More Frequent & Intense Droughts
• Increased Energy Demand
• Increased Water Demand
• More Extreme Events
• Reduced In-stream Flow
• Saltwater Intrusion
• Higher Evaporation Rates
• Higher Sea Levels/Greater Storm Surges
• Impaired Ecological/Biological Communities
• Economic (commercial & sport fisheries,
tourism, industrial capacity)
Impacts to Water Resources
13-25 More
Hot Days
Projected
20 – 40 More
Warm Nights
Projected
2 – 7 More
Dry Days
Projected
So why is all of this
important to me?
And what does
Climate Change have
to do with water
quality anyway?
Impacts to Water Quality
• Receiving waters become dominated by
Effluent flows
• Higher Nutrient concentrations
• Longer contaminant residency times
• Increased Sediment loads from extreme
runoff events
Projections
vs. Reality
Rainfall Records
Rainfall Records for
Lake Bob Sandlin
• Average Rainfall (1979-1998) 54.0”
• Average Rainfall (1999–2013) 48.8”
• Four of 6 Driest Years:
2005*, 2006, 2010, 2011
• Average Release (1979-1998)
>100K ac-ft
• Average Release (1999–2013)
66K ac-ft
• No Releases since April 2010
Lake Bob Sandlin
Segment
Station
ID
Sp Cond/
TDS
DO pH Secchi
Chlorophyll
a
Total
Phosphorus
Lake Cypress
Springs
10313 ↑
10312 ↑
Lake Bob Sandlin 16158 ↑
Big Cypress Creek
Below Lake Bob
Sandlin
10308 ↑ ↑ ↑
13631 ↑
Lake O’ the Pines
10300 ↓
10297
16156 ↑
10296 ↑ ↑
Big Cypress Creek
Below Lake O’ the
Pines
15511 ↑
10295 ↑
Caddo Lake 15249 ↑
Significant Trends
Trend Analysis
• Type of analysis
– Linear regression
– T-stat >=|2|
– p-value of < 0.05
• Criteria for Trend
Analysis
– 10 years of data
– Regular sampling
– 20 to 30 data points
Results of Trend Analysis
Lake Cypress Springs (0405)
01 Specific Conductance 11/98 - 8/13 54 -5.035 <0.001 ↑
02 Specific Conductance 11/98 - 8/13 55 -4.852 <0.001 ↑
Lake Bob Sandlin (0408) 03 Specific Conductance 11/98 - 7/13 57 -4.939 <0.001 ↑
Big Cypress Creek Below Lake
Bob Sandlin (0404)
02
Specific Conductance 9/73 – 7/13 225 -2.508 0.013 ↑
pH 9/73 – 7/13 218 28.04 <0.001 ↑
Phosphorus 11/73 – 7/13 133 -3.212 0.002 ↑
01
Total Organic Carbon 10/79 – 7/13 121 5.818 <0.001 ↓
Phosphorus 10/79 – 1/13 117 -3.818 <0.001 ↑
Lake O’ the Pines (0403)
04 Transparency 10/03 – 8/13 34 4.147 <0.001 ↓
02 Specific Conductance 1/99 – 8/13 68 -5.010 <0.001 ↑
01
Specific Conductance 10/73 – 8/13 127 6.645 <0.001 ↑
Chlorophyll a 11/73 – 4/13 113 -3.960 <0.001 ↑
Big Cypress Creek Below Lake O’
the Pines
(0402)
03 pH 11/98 – 7/13 58 3.463 0.001 ↑
01 Specific Conductance 9/02 – 8/13 77 -3.025 0.003 ↑
Caddo Lake (0401) 07 Specific Conductance 10/00 – 8/13 200 -4.212 <0.001 ↑
Segment 0406: Black Bayou 01
Specific Conductance 9/73 - 7/12 198 4.496 <0.001 ↓
Dissolved Oxygen 9/68 – 7/12 239 8.404 <0.001 ↓
pH 9/73 – 7/12 199 28.04 <0.001 ↓
Results
Specific Conductance/Total Dissolved
Solids Increasing in Watershed
• Lake Cypress Springs
• Lake Bob Sandlin
• Big Cypress Creek below Lake Bob Sandlin
• Lake O’ the Pines
• Caddo Lake
T-stat: 4.852
p-value: <0.001
Results
• Increasing Phosphorus in Big Cypress Creek below
Lake Bob Sandlin
• Increasing pH in Big Cypress Creek below Lake Bob
Sandlin
• Increasing Chlorophyll a in Lake O’ the Pines
T-stat: 3.212
p-value: 0.002
Conclusions
• Climate Change is having a negative
impact on the water quality of the
Cypress Creek Basin
• The water quality effects are
measureable and statistically significant
Conclusions
• Increasing Phosphorus in Big Cypress Creek =
increasing Chlorophyll in Lake O’ the Pines
• Increasing pH in Big Cypress Creek is likely
due to eutrophication
• Lower annual rainfall and lack of releases from
Lake Bob Sandlin = increasing conductance
throughout the watershed
Future Study
• Long-term Impacts to biota?
• Long-term effects to Water Quality of
Lake O’ the Pines?
• Similar trends in other basins?
QUESTIONS?
For Additional Information:
Water Monitoring Solutions, Inc.
Randy Rushin
903-439-4741
randy@water-monitor.com

The Impacts of Climate Change on Water Quality

  • 1.
    Presented by: Randy Rushin WaterMonitoring Solutions, Inc. The Impacts of Climate Change on Water Quality March 4, 2015
  • 2.
  • 3.
    nca2014.globalchange.gov • 3-Years • >300Experts • 60 Member Federal Advisory Committee • Review by National Research Council of the National Academy of Sciences
  • 4.
    Climate Change effects: •Higher Temperatures • More Frequent & Intense Droughts • Increased Energy Demand • Increased Water Demand • More Extreme Events
  • 5.
    • Reduced In-streamFlow • Saltwater Intrusion • Higher Evaporation Rates • Higher Sea Levels/Greater Storm Surges • Impaired Ecological/Biological Communities • Economic (commercial & sport fisheries, tourism, industrial capacity) Impacts to Water Resources
  • 6.
  • 7.
    20 – 40More Warm Nights Projected
  • 9.
    2 – 7More Dry Days Projected
  • 12.
    So why isall of this important to me? And what does Climate Change have to do with water quality anyway?
  • 13.
    Impacts to WaterQuality • Receiving waters become dominated by Effluent flows • Higher Nutrient concentrations • Longer contaminant residency times • Increased Sediment loads from extreme runoff events
  • 14.
  • 18.
  • 19.
    Rainfall Records for LakeBob Sandlin • Average Rainfall (1979-1998) 54.0” • Average Rainfall (1999–2013) 48.8” • Four of 6 Driest Years: 2005*, 2006, 2010, 2011
  • 20.
    • Average Release(1979-1998) >100K ac-ft • Average Release (1999–2013) 66K ac-ft • No Releases since April 2010 Lake Bob Sandlin
  • 22.
    Segment Station ID Sp Cond/ TDS DO pHSecchi Chlorophyll a Total Phosphorus Lake Cypress Springs 10313 ↑ 10312 ↑ Lake Bob Sandlin 16158 ↑ Big Cypress Creek Below Lake Bob Sandlin 10308 ↑ ↑ ↑ 13631 ↑ Lake O’ the Pines 10300 ↓ 10297 16156 ↑ 10296 ↑ ↑ Big Cypress Creek Below Lake O’ the Pines 15511 ↑ 10295 ↑ Caddo Lake 15249 ↑ Significant Trends
  • 23.
    Trend Analysis • Typeof analysis – Linear regression – T-stat >=|2| – p-value of < 0.05 • Criteria for Trend Analysis – 10 years of data – Regular sampling – 20 to 30 data points
  • 24.
    Results of TrendAnalysis Lake Cypress Springs (0405) 01 Specific Conductance 11/98 - 8/13 54 -5.035 <0.001 ↑ 02 Specific Conductance 11/98 - 8/13 55 -4.852 <0.001 ↑ Lake Bob Sandlin (0408) 03 Specific Conductance 11/98 - 7/13 57 -4.939 <0.001 ↑ Big Cypress Creek Below Lake Bob Sandlin (0404) 02 Specific Conductance 9/73 – 7/13 225 -2.508 0.013 ↑ pH 9/73 – 7/13 218 28.04 <0.001 ↑ Phosphorus 11/73 – 7/13 133 -3.212 0.002 ↑ 01 Total Organic Carbon 10/79 – 7/13 121 5.818 <0.001 ↓ Phosphorus 10/79 – 1/13 117 -3.818 <0.001 ↑ Lake O’ the Pines (0403) 04 Transparency 10/03 – 8/13 34 4.147 <0.001 ↓ 02 Specific Conductance 1/99 – 8/13 68 -5.010 <0.001 ↑ 01 Specific Conductance 10/73 – 8/13 127 6.645 <0.001 ↑ Chlorophyll a 11/73 – 4/13 113 -3.960 <0.001 ↑ Big Cypress Creek Below Lake O’ the Pines (0402) 03 pH 11/98 – 7/13 58 3.463 0.001 ↑ 01 Specific Conductance 9/02 – 8/13 77 -3.025 0.003 ↑ Caddo Lake (0401) 07 Specific Conductance 10/00 – 8/13 200 -4.212 <0.001 ↑ Segment 0406: Black Bayou 01 Specific Conductance 9/73 - 7/12 198 4.496 <0.001 ↓ Dissolved Oxygen 9/68 – 7/12 239 8.404 <0.001 ↓ pH 9/73 – 7/12 199 28.04 <0.001 ↓
  • 25.
    Results Specific Conductance/Total Dissolved SolidsIncreasing in Watershed • Lake Cypress Springs • Lake Bob Sandlin • Big Cypress Creek below Lake Bob Sandlin • Lake O’ the Pines • Caddo Lake
  • 26.
  • 27.
    Results • Increasing Phosphorusin Big Cypress Creek below Lake Bob Sandlin • Increasing pH in Big Cypress Creek below Lake Bob Sandlin • Increasing Chlorophyll a in Lake O’ the Pines
  • 28.
  • 29.
    Conclusions • Climate Changeis having a negative impact on the water quality of the Cypress Creek Basin • The water quality effects are measureable and statistically significant
  • 30.
    Conclusions • Increasing Phosphorusin Big Cypress Creek = increasing Chlorophyll in Lake O’ the Pines • Increasing pH in Big Cypress Creek is likely due to eutrophication • Lower annual rainfall and lack of releases from Lake Bob Sandlin = increasing conductance throughout the watershed
  • 31.
    Future Study • Long-termImpacts to biota? • Long-term effects to Water Quality of Lake O’ the Pines? • Similar trends in other basins?
  • 32.
    QUESTIONS? For Additional Information: WaterMonitoring Solutions, Inc. Randy Rushin 903-439-4741 randy@water-monitor.com