This document summarizes a study on the effect of rainfall and snowmelt events on water quality in Cayuga Creek in Erie County, New York. Four sites along the creek were monitored weekly from October 2014 to January 2015. Parameters like E.coli, suspended solids, and pH were measured. The study found that sediments and turbidity increased the most after rainfall events. E.coli levels also seemed to increase after some rainfall. However, parameters like hardness, nitrates, and dissolved solids did not show clear relationships with rainfall. The largest rainfall event produced mixed effects on E.coli levels at different sites.
EOPS_May_2_2016,
Spring air temperatures are higher - it has been sunny and dry. The snowpack is quickly disappearing as temperatures are up to 7 °F warmer at higher elevations. Snowmelt-fed rivers are running very high. How does this affect water quality in Puget Sound? A strong spring phytoplankton bloom extends across Puget Sound and the Strait of Juan de Fuca. Water temperatures are still higher than normal and jellyfish are already numerous in southern inlets. The high biological activity is causing organic material to drift at the surface and wash onto beaches. Do you know how fast a Sand Star can move?
Ecology Publication No. 16-03-073
After a dry and sunny summer extending well into October, air temperatures are cooler than normal and precipitation has increased allowing rivers to regain strength. Despite a dry summer, Puget Sound is fresher this year than the past 17 years. As of September, warmer temperatures remained in South Sound. In October, surface water in the Straits however began to cool and the influence of rivers can be seen in our ferry data. Leaves drift on the water in South Sound and smaller blooms are confined to inlets as the productive season winds down. Meet our new intern and discover if Puget Sound really has sea spiders.
EOPS_November_22_2016,
ENSO is in a cold phase (La Niña) and it is wetter and warmer than normal. Strong precipitation in October greatly improved Puget Sound streamflows. At the coast, we had strong downwelling. As a result, water temperatures, salinities, and oxygen in Puget Sound are returning to normal. While surface water in Puget Sound has cooled, it is still warmer than in the Straits. Surprisingly, masses of suspended sediment occurred east of Steamboat Island in Totten Inlet. We continue to see large jellyfish aggregations in finger Inlets of South Sound and slowly fading red-brown blooms.
Publication No. 16-03-078
Puget Sound is starting to normalize in response to fall conditions with cooler air temperatures, rain, and recovering river flows. We are seeing fewer algal blooms, jellyfish, and macro-algae as salinities become more normal. Yet warm waters persist and El Nino and the Blob are likely to affect Puget Sound throughout the winter. The Nisqually River fared better through the drought than other rivers and best management practices have been improving its water quality. EOPS and ferry monitoring gain recognition with a national award for innovation!
EOPS_September_26_2016,
September is jellyfish season and they are everywhere in southern Puget Sound! Sunny, warm, and dry conditions promoted strong late-summer plankton blooms in colors of red, green, and brown, now widespread in many bays. In contrast, Central Sound looks clear with low algal activity. Southern Puget Sound has large floating mats of organic material and developed lower oxygen in August. Meet the Critter of the Month - The Sweet Potato Sea Cucumber.
Publication No. 16-03-077
Dr. Christopher Krembs, with the marine monitoring unit of the Department of Ecology, presented on the warm water conditions in Puget Sound. He discussed the impacts on marine food webs and potential scenarios in 2015. He presented at the June 2015 NRC meeting.
Unusually warm water temperatures continue in central and south Puget Sound. River flows remain lower than normal, especially the Fraser and Skagit rivers. Thus, with estuarine circulation much weaker, Puget Sound waters stay put. Mats of organic debris persist in Central Sound near Port Madison. Red-brown and brown blooms are now very strong in southern inlets and jellyfish patches are exceptionally numerous and large. Explore media coverage of unusual Puget Sound conditions including jellyfish.
Air temperatures are warm and Puget Sound continues to show record high water temperatures. Some rain has returned to our region, yet river flows remain unusually low. Puget Sound is saltier than normal allowing oxygen-rich surface waters to more easily mix to greater depths. Lower oxygen was measured only in the Coastal Bays, Hood Canal, and South Sound. Large jellyfish aggregations continue in South Sound, the Kitsap Peninsula, and East Sound (Orcas Island). Sediment plumes in Bellingham Bay form unique patterns. Warm waters and sunny conditions fostered green tides, raising a stink along some local beaches.
Michal Kravcik, "The New Water Reality"bio4climate
Innovative Slovakian hydrologist Michal Kravčík gives an introduction to his New Water Paradigm and the critical importance of regional or “small” rainwater cycles. The result is a set of empowering ecological concepts that enable people everywhere to secure clean and adequate water, prevent floods and drought and moderate local climate, simply by harvesting rainfall. Since the 1990s he has demonstrated these concepts in his native Slovakia.
Presented at the Restoring Water Cycles to Reverse Global Warming conference October 16th-18th, 2015 at Tufts University.
EOPS_December_30_2015,
The year 2015 in pictures: Jellyfish patches persisted through the entire year in response to the exceptionally warm water caused by the Blob. Sediment loads are high as snow melts fast in the winter of 2015. Unexpected phytoplankton species occur in some bays in spring. Noctiluca, jellyfish and macro-algae appear in high numbers when rivers drop to record-low flows in early summer. Low river flows slow the renewal of in Puget Sound throughout summer and fall and jellyfish patches reach record highs.
Ecology Publication No. 15-03-080
The societal value of historical and paleoflood research in Manitoba, CanadaScott St. George
Southern Manitoba is one of the most flood-prone regions in Canada, with the Red River of the North being the cause of most significant floods. The realization that the then-recent 1950 flood disaster was dwarfed by the historical 1826 flood led Canadian government officials to set an unusually high design standard for the Red River floodway, a 48-km long diversion built in the 1960s to protect the provincial capital of Winnipeg. And after paleoflood research confirmed new evidence of the 1826 flood, that event was cited as the main justification for expanding the Red River floodway, a $668 billion CAN infrastructure project that began in 2010. Without these insights from historical and paleoflood research, it’s almost certain flood risk estimates would have been unrealistically low and Winnipeg would have adopted a lesser level of flood protection. Because widespread Euro-American settlement in the Pembina Territory (the present-day Red River basin within the United States) did not occur until the 1870s, there are no historical accounts that indicate whether the 1826 flood was also so severe in North Dakota or Minnesota. As a result, the 1997 flood, which was nearly 1.5 times larger than any other previous flood in the US gage record, overwhelmed the dikes protecting Grand Forks and East Grand Forks. By having a deeper understanding of the history of flooding, communities are better able to anticipate future floods, make sound decisions about flood protection and migration, and protect people and their property more effectively.
EOPS_July_20_2016,
Through June, air temperatures and sunlight were higher than normal. Recent rain generally improved river flows. However, the Fraser river flow remains extremely low, reducing water exchange with the ocean. Water temperatures are still breaking records, yet dissolved oxygen levels are normal. Coastal bays are influenced by upwelling and exhibit lower oxygen and higher salinities. Puget Sound algae are thriving with blooms observed in many South Sound inlets. Macro-algae is seen piling up on beaches and drifting in Central Sound. Jellyfish smacks are numerous in Eld and Budd Inlets. Our fliers notice seals hanging out at the beach!
Ecology Publication No. 16-03-075
Climate Change & Urban Development Have Impacted Streamflows in Southern OntarioRobert Muir
Dr. Trevor Dickinson, Professor Emeritus University of Guelph presented his work with Ramesh Rudra and Kishor Panjabi, Water Resources Engineering, University of Guelph to the Southern Ontario Stormwater Discussion Group at its September 27, 2018 meeting in Brantford, Ontario. The presentation shows the effects of climate on streamflows in southern Ontario including lower spring flow volumes and rates, and the effects of urbanization on streamflows including higher spring and summer flows. The distribution of flooding events through the years is reviewed, showing fewer spring and more summer period flood events. Climate change appears to increase winter runoff volumes due to higher temperatures which reduce spring volumes and peaks, a decrease in flood risk.
EOPS_July_24_2017,
July had warm air temperatures, sunshine, and an abundant snowpack. Previous months had higher river flows (bringing freshwater) and weak upwelling (low delivery of saltier water) which resulted in very low salinities in Puget Sound, especially in the South Sound. Water temperatures are expected and warmer in Central Sound. Above normal sunshine has made Puget Sound biologically very active! Intense and unusual blooms color Hood Canal (coccolithophores) and south sound inlets. Large mats of organic material containing macro-algae drift at the surface. Many schools of fish are visible though jellyfish were absent.
Ecology Publication No. 17-03-071
EOPS_March_16_2016,
In response to warm and wet conditions, rivers have been running high. Salinity in Puget Sound is notably lower. Below a cooler surface, water temperatures remain high, especially in Hood Canal. We still see numerous jellyfish patches in Puget Sound inlets. Phytoplankton blooms are going strong in Hood Canal and Henderson Inlet, and picking up elsewhere. Many places showed long stretches of suspended sediments nearshore, a sign of potential shore erosion. Check out the critters inhabiting the sediments of Puget Sound.
Ecology Publication No. 16-03-071
EOPS_April_6_2016,
Despite warmer air temperatures, normal snowpack in the mountains suggest that summer freshwater flows into Puget Sound might be higher than last year. As of April, the spring plankton bloom has extended across Central and South Puget Sound. Ferry data shows chlorophyll increasing after March 25 and expanding across the area. With water temperatures above normal as a carry-over from 2015, jellyfish patches are numerous in inlets of South Sound and in Sinclair Inlet, unusual for this time of year. Check out the tiny burrowing ostracods as well as our Washington Conservation Corps Intern analyzing seawater oxygen.
Ecology Publication No. 16-03-072
PA needs to draft a strong Watershed Implementation Plan (WIP), not for the sake of the Chesapeake, but for the health of the Susquehanna. In January, the PA Fish and Boat Commission came out with a resolution that points out that the water quality of the Susquehanna is the cause for the demise of the Susquehanna bass fishery. Please watch this movie of the powerpoint that I presented in front of PA DEP Secretary Hanger and PA Department of Agriculture Secretary Redding (9/1/2010).
1. SRCCpostertemplateprovidedbyInstructionalResourcesandOfficeofUndergraduateResearch
Rainfall/Snowmelt Event: Effect on Water Quality in Cayuga Creek Erie County, NY
Spencer Podsiadlo, Geography
Dr. Stephen Vermette, Department of Geography and Planning
Cayuga Creek is one of three tributaries emptying into the Buffalo River in Erie Country NY.
Cayuga Creek is the most northerly while the Buffalo Creek is further south and Cazenovia
Creek is the most southerly. The total drainage area of Cayuga Creek is about 92 square
miles and the creek is 40 miles long. Beginning in the west where Cayuga Creek flows into
the Buffalo River the watershed is mainly urban, as you move east and upstream you move
through the suburbs of Cheektowaga, Depew and Lancaster. Further east, slightly south and
further upstream you find a more rural and agricultural setting in the Towns of Marilla,
Bennington and Sheldon. There are parks and forested areas mixed in with the urban,
suburban and rural areas throughout the watershed.
Four sites were accessed along the creek to monitor water quality once every week or two, for
a total of ten samples per site from October 2014 to January 2015. The sections of the creek
sampled pass through several parks, as well as through the towns of Cheektowaga, Depew
and Lancaster. These sites are in proximity to varying amounts of vegetation and
urbanization.
Water quality parameters monitored included: E.coli, suspended solids, hardness, nitrate,
dissolved solids and pH, among others. Rainfall influences runoff into the creek and creek
flow, thus rainfall data was obtained from nearby gauges.
This poster focuses on rainfall/snowmelt events which occurred during the sampling period to
determine their impact on creek water quality. The specific question addressed in this poster
is to determine which water quality parameters are impacted by rainfall events and which are
not.
The Buffalo River has been classified as an Area of Concern, AOC. This classification lead to
the Buffalo River to be selected for the EPA's Assessment and Remediation of Contaminated
Sediments (ARCS) program. The Buffalo River is heavily influenced by contaminates from
upstream and this includes Cayuga Creek. Numerous contaminates such as PCB’s, DDT, lead
and copper are of concern. Industrial discharges, combined sewer overflows and suspension
of contaminated sediments are the suspected sources for these contaminants.
Introduction
National Oceanic and Atmospheric Administration. National Weather Service Forecast Office Buffalo, NY.
http://www.weather.gov/climate/index.php?wfo=buf (accessed 2/2/15).
Buffalo Niagara Riverkeeper. Buffalo River Watershed. http://bnriverkeeper.org/places/buffalo-river/
(accessed 4/18/15).
United States Environmental Protection Agency. Assessment and Remediation of Contaminated Sediments
(ARCS) Program. http://www.epa.gov/greatlakes/arcs/EPA-905-R94-005/EPA-905-R94-005.html
(accessed 4/20/15).
References
Conclusions
Sediments and turbidity were the most affected by rain. There seems to be some relationship between
rainfall and E.coli, as well as rainfall and pH but not a strong relationship. Hardness, nitrate and
dissolved solids had no relationship to rain and snowmelt. Dissolved oxygen and temperature although
not shown have a strong relationship to each other but not to rainfall or snowmelt.
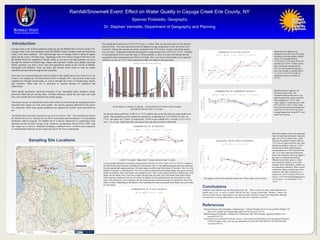
Results and Discussion
Secchi depth is a measure of turbidity. A measurement of 24 inches is the maximum
and indicates that the water is very clear.
Sampling Site Locations
The rainfall that occurred on 1/3/14-1/4/14 was 1.1 inches. That was the most rain over the shortest
period of time. Over the same time period the highest average temperature of any snowmelt event
occurred. Taking into account snowmelt a potential total of 2.8 inches of water entered the stream
over two days. Suspended sediments increased by a large amount from 12/29/14 to 1/5/15. Turbidity
is a measurement of how clear the water is. When turbidity is close to 0, that will indicate that the
suspended solids measurements are likely to be high. This is an inverse relationship. So as expected
turbidity was low on 1/5/15 while suspended solids were high on that same date.
A pH of 7 is neutral. Higher than 7 is basic and lower than 7 is acidic.
An obvious drop in pH from 12/29/14 to 1/5/15 could be due to the fact that rain water tends to be
acidic. This assumption can be called into question by comparing site 4 on 10/29/15 to site 4 on
1/5/15. pH values are 7.9 and 7.8 respectively. 10/28/14 saw rainfall of 0.1 in while 1/3/15-1/4/15
saw 1.1 in of rain. Apart from this one instance the rain did not seem to affect pH.
Nitrate does not appear to be
affected by any rain event. The trend
continues to increase despite rainfall
events. For example between
11/5/14 and 11/12/14 only 0.02 in of
rain fell on 11/12/14. At three of the
four sites nitrate increased and if
0.02 in of rain caused the increase,
then why wouldn’t a rainfall total of
1.1 in on 1/3/15-1/4/15 result in a
significant increase in nitrate on
1/5/15?
E.coli is greatly affected by 0.63 inches of rain from 12/16/14 to 12/17/14. From 1/3/15 to 1/4/15 1.1 inches of
rain fell but this larger amount of rainfall has a mixed result. Site 1 is the furthest upstream with more influence
from the agricultural regions upstream. The main inputs would be from fecal matter of livestock. Site 3 is in the
middle of Lancaster, a suburban town. The E.coli is likely coming from both animal (dogs, cats, geese, etc) and
human fecal matter. More fecal matter was available at site 1 and 3 so the rainfall could have flushed more fecal
matter into the stream. Site 2 and 4 are in parks. Because they are parks, they lack human fecal matter inputs
which may have resulted in lower E.coli counts. In addition E.coli originating from any fecal matter on land
close to the stream may not be making it into the stream because increased amounts of vegetation at these sites
holds it in place. Depending on the density of the vegetation the water carrying the fecal matter may never make
it to the stream.
Hardness does not appear to be
affected by rain events. The
correlation between the sites is very
tight throughout the study except the
final sampling on 1/19/15 when
values spiked. A small amount of rain,
0.04 in fell on 1/18/15. There could
have been snowmelt and subsequently
runoff on 1/17/15-1/18/15 due to an
average temperature being 42.5°F and
ample snow present.
When the hardness values are subtracted
from the total dissolved solids values the
spike on 1/19/15 is much more visible.
This may be related to nitrate which on
1/5/15 was 0.5 ppm at all four sites, then
all sites increased to 1 ppm on 1/19/15.
The dissolved solids minus hardness
concentrations on 1/19/15 increase from
site 1 to 4, this is flowing downstream.
Some sort of nutrient was being added to
the water as it flowed downstream.
Whether or not these spikes is values
were caused by nitrate or some other
nutrient, such of phosphates, which were
not measured is unknown. What is know
is that these spikes could not have been
caused by rain. Why would there be a
reaction on 1/19/15 from the 0.04 in of
rain on 1/18/15 but nothing happened on
1/5/15 when 1.1 in of rain fell 1/3/15-
1/4/15?
The negative values were caused by human error. Those values are not correct.