A STUDY ON THE IMPACT OF POLLUTION IN BELLANDUR LAKE DUE TO URBANIZATION
Lab Report 1
1. Water quality assessment of the University of
Houston-Clear Lake drainage ditches and pond
Blayr Downey, Wesley Dewey, Corrina Fuentes, Josh Small
University of Houston-Clear Lake
October 6th, 2014
ABSTRACT
Macrohabitat analysis is very useful for determining the viability and health of habitats
and ecosystems. It is also necessary to conduct habitat analyses in order to determine the
anthropogenic impact of humans on their surrounding environment. In the present experiment,
commonly used standards were used to analyze the water quality at five testing locations that
drain the back half of the University of Houston-Clear Lake. Water samples were taken from the
various locations using buckets, then taken back to the lab and assessed in regards to color,
conductivity, ammonia concentrations, nitrate concentrations, nitrite concentrations, dissolved
oxygen, oxygen saturation, pH, phosphate concentrations, total dissolved solids (TDS),
temperature, and turbidity. Upon assessment of the data collected, there were statistically
significant differences in conductivity, nitrite levels, nitrate levels, dissolved oxygen levels, pH,
and TDS. The ammonia levels between the five test sites were not statistically different from
each other; however, the ammonia levels at all five sites were higher than the state maximum
standard. Also, the DO levels at two of the test sites did not meet the state minimum
requirements. In comparison, the nitrate, nitrite, and phosphate levels were all well below the
state maximum requirements. There was significant rainfall in the week prior to testing (6.67in)
that could have affected all of these values, and changed the chemical concentrations in the
ditches and pond. With the exception of ammonia, all of the data suggests that the water in the
drainage ditches and the duck pond is safe for use by wildlife and plants.
2. INTRODUCTION
Macrohabitat analysis is highly important for studying and assessing the environmental
factors that influence habitats. Conducting a successful macrohabitat analysis will give a better
understanding of the dominant temporal, spatial, physical, chemical, and biotic components of an
environment (Brower et al. 1998). In a world that is now highly populated with
environmentalists, conservationists, and preservationists, this type of analysis of can provide
valuable information for determining a course of action in regards to a particular habitat.
Therefore it is necessary to develop a comprehensive habitat profile if we are to determine the
anthropogenic impact (Molles 2013).
The habitats of aquatic environments are directly related to physical factors such as
turbidity, temperature, and water movement; as well as chemical factors, such as salinity and
oxygen concentration. This information can then be used, according to state standards, to classify
bodies of water into four categories: aquatic life, contact recreation, public water supply, or fish
consumption.
There were several physical factors measured during this experiment. First was the
temperature; temperature influences chemical reaction rates, migration of organisms such as fish,
and can determine the physiological boundaries of aquatic organisms. Also measured was
turbidity, using Formazin Attenuation Units. Turbidity is important because it can indicate
dissolved chemicals, algae, and other mineral particulates (Brower et al. 1998). Watercolor was
also measured by using Pt-Co units. Water color can signify the decomposition of lignin, and it
can be an indicator of pollutants. Next, water conductivity was measured in μS. Water
conductivity is not just a measure of salinity, in fact it’s an indirect measurement of salinity, but
it’s also a measure of ion concentrations, which can affect the pH of the water, and then in turn
affect the animal and plant life. Then dissolved oxygen was measured by determining the
3. milligrams of dissolved O2/L, and the percent saturation. This is highly important, because
oxygen is essential to all biotic organisms. Also tested was the pH, because the pH also indicates
the ion concentration of the water, which, as mentioned previously, plays a key role in chemical
reactions and biotic growth. Nitrogen concentrations were also determined by analyzing the
amount of nitrate, nitrite and ammonia present in the water. Knowing the nitrogen concentration
is vital to determining the viability of a body of water, because ammonia and nitrite can be
converted to nitrate by most plant species, and recycled back into the environment. Too much
ammonia, nitrite, or even nitrate can be detrimental to the environment, making nitrogen fixation
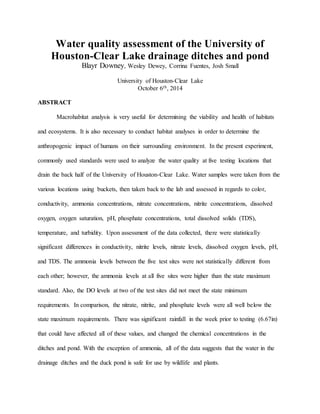
by plants essential, as seen in Figure 1. Finally phosphate was measured by determining the
amount of orthophosphate present in the water. Again, phosphate plays important biological
roles, but in excess, it can be harmful to the environment.
The purpose of this experiment was to determine how the parking lot drainage from the
University of Houston-Clear Lake (UHCL) parking lots affects water quality in the drainage
ditches and the duck pond. To do this, we analyzed commonly used standards for water quality at
5 testing sites that drain the back half of UHCL. Furthermore, each station compared the data in
order to determine and analyze patterns or variations in the previously mentioned water quality
parameters.
4. Figure1: Nitrogen cycle;N2, NH3, and NO3 fixated by nitrifying bacteria and plants.
MATERIALS & METHODS
Study site. This study was conducted on September 22nd, 2014 on the University of
Houston-Clear Lake campus, in Clear Lake, Texas as seen in Figure 2. The east-side parking lots
were built for water to drain into the ditches that run along the backside of the campus. These
ditches then drain into the duck pond located south of the parking lot. There were five stations
along the drainage ditches and the pond where test samples were taken in order to determine
water quality (Figure 2).
5. Figure 2: University of Houston-Clear Lake campus. The 5 testing sites can be seen in yellow.
Water quality analysis. Three replicate water samples were taken from each of the five
stations on the UHCL campus using buckets and water sample containers. The buckets were
thrown into the water and used to collect only water at the surface of the pond; we carefully
avoided disrupting the pond bottom, and avoided filling the water with sediment from below.
Each replicate was transferred into water containers, making sure to fill the water to overflowing;
this prevented air from being trapped between the lid and the surface of the water, and
subsequently prevented the disruption of the oxygen saturation of the water. After labeling each
replicate, the samples were taken back to the lab, and the parameters mentioned previously were
measured and analyzed; the tests used to analyze these parameters can be seen in Table 1. After
each station tested its samples, all of the data was graphically analyzed, using the means and
standard errors of each parameter, and compared between the stations in order to determine
patterns in the water quality.
6. Table 1: Analysis of water parameters for
comparing the 5 test sites. The test and units used
are given.
Parameter Test Units
Color Hach DR890 Pt-Co
Conductivity ExTech EC400 μS
NH4 Hach NI-8 mg/L
NO3 Hach NI-14 mg/L
NO2 Hach NI-15 mg/L
DO YSI-50 mg/L
DO% YSI-50 %
pH pH TESTR pH
PO4 Hach PO-24 mg/L
TDS ExTech EC400 mg/L
Temperature ExTech EC400 °C
Turbidity Hach DR890 FAU
RESULTS
All twelve parameters were compared between the five test stations using graphical
analysis, comparing the standard error of each. However, only six of these parameters exhibited
significant differences in the data. The first was water conductivity, as seen in Figure 3.
Secondly, there was an obvious significant difference in the data collected for nitrate levels at all
five stations (Figure 4). The concentrations of nitrate found in the duck pond were all 0mg/L,
whereas the concentrations at the ditch sites had significant concentrations. Similarly, the
concentrations of nitrite found at the five stations also proved to be very interesting. The nitrite
concentrations found at the duck pond stations yielded concentrations of 0mg/L, while the ditch
sites, again, had significant concentrations (Figure 5). The concentrations of dissolved oxygen
among the testing sites exhibited a wide range of variability, as seen in Figure 6. Each of the five
stations exhibited entirely different concentrations of dissolved oxygen. Next, the pH of each
testing site also revealed interesting results. The pH at almost all five of the testing sites was
7. significantly different from each other (Figure 7). Finally, the last parameter that exhibited
significant differences in data among the five test sites was the TDS, as seen in Figure 8.
Figure3: Water conductivity, measured in microSemens. The letters a, b, and c denote the number of stations that
have significant differences in their data.
0
100
200
300
400
500
600
700
BDN BDS DPN DPW DPS
Conductivity(μS)
a
b
c c c
8. Figure 4: Nitrate concentrations from all 5 testing stations. Letters a, b, and c denote the number of stations that
have significant differences in their data.
Figure 5: Nitrite concentrations from the 5 testing sites. Letters a, b, and c denote the number of stations that
have significant differences in their data.
0.00
0.10
0.20
0.30
0.40
0.50
0.60
0.70
0.80
BDN BDS DPN DPW DPS
Nitrate(mg/L)
a
b
c c c
0.00
0.10
0.20
0.30
0.40
0.50
0.60
0.70
0.80
BDN BDS DPN DPW DPS
Nitrite(mg/L)
a
b
c c c
9. Figure 6: Dissolved oxygen concentrations among the 5 testing stations. Letters a, b, c, d, and e denote the number
of stations that have significant differences in their data.
Figure 7: pH values from all 5 test sites. Letters a, b, and c denote the number of stations that have significant
differences in their data.
0.00
1.00
2.00
3.00
4.00
5.00
6.00
BDN BDS DPN DPW DPS
DissolvedOxygen(mg/L)
a
b
c
d
e
6.60
6.70
6.80
6.90
7.00
7.10
7.20
7.30
7.40
BDN BDS DPN DPW DPS
pH
a
b
a
c
a
10. Figure 8: The TDS, measured in ppm, among the 5 test sites. Letters a, b, and c denote the number of stations that
have significant differences in their data.
DISCUSSION
Our objective for the current study was to analyze commonly used standards for water
quality at five testing locations that drain the back half of UHCL, and then compare the results
from the different locations. Water quality is extremely important when developing a thorough
habitat assessment, and determining the anthropogenic impact (Molles 2013). We tested the
water at five different sites on the UHCL campus (Figure 2) by throwing a bucket along the top
of the water to collect samples. Then, the water was evaluated in terms of color, conductivity,
ammonia levels, nitrate levels, nitrite levels, dissolved oxygen, oxygen saturation, pH, phosphate
levels, TDS, temperature, and turbidity.
We found statistically significant differences in conductivity, nitrite levels, nitrate levels,
dissolved oxygen levels, pH, and TDS. In the case of conductivity, nitrate levels, nitrite levels,
and TDS, the graphical analysis reveals that these parameters had significantly different values in
0.0
50.0
100.0
150.0
200.0
250.0
300.0
350.0
400.0
450.0
BDN BDS DPN DPW DPS
TDS(ppm))
a
b
c c c
11. the drainage ditches compared to the pond. This is biologically significant, because along the
drainage path, the compounds in the water are decreased. The nitrates, nitrites, and dissolved
solids can be taken up by the vegetation growing along the ditches, and these compounds can
also be taken up by algae and bacteria before the water reaches the pond.
The pHs at the various test sites are all statistically different; however, the variation is so
minute, and the values do not correlate with the concentrations of the chemical compounds, that
the biological significance is more than likely negligible. Contrastingly, the values for dissolved
oxygen at the various locations are all entirely different, and they also have a wide range of
variability; this could be caused by several different factors. First, the variability in the time at
which the samples were measured for dissolved oxygen could cause the differences seen in
Figure 6. Biological factors could have also influenced the dissolved oxygen concentrations,
such as the vegetation growing around the test sites, or even the concentration of aquatic animals
at each test site.
The state maximum concentration for nitrate and nitrite is 2.76mg/L, and the maximum
concentration for ammonia is 0.17 mg/L; the state maximum concentration for phosphate is
0.5mg/L. Table 3 shows that the ammonia levels for all five test sites were much higher than the
state standards. However, the concentrations of nitrate, nitrite, and phosphate at all five locations
were below the state standards. Similarly, the DO at BDS and DPN do not meet the minimum
requirements for dissolved oxygen, and would be classified as having no significant dissolved
oxygen; BDN and DPS meet the requirements for limited dissolved oxygen, and DPW meets the
minimum requirement for high oxygen content. Again, all of these factors could be influenced by
plant and animal life, as well as the location of the test sites relative to the parking lots.
12. Table 3: Mean nitrogen, phosphate, and DO levels from the 5 test sites
Test
Site NH4 NO3 NO2 PO4 DO
BDN 1.04 0.29 0.36 0.12 2.22
BDS 1.44 0.64 0.14 0.12 0.17
DPN 0.30 0.00 0.00 0.18 1.41
DPW 0.50 0.00 0.00 0.12 4.96
DPS 0.28 0.00 0.00 0.23 1.96
One major factor that could have also influenced the results of all of the above-mentioned
parameters is the local rainfall. The total amount of rainfall from September 15th to September
22nd can be seen in Table 2.
Table 2: Total precipitation
in Clear Lake from Sept.
15th – Sept. 22nd
Date
Rainfall
(inches)
15-Sep 0.09
16-Sep 0.88
17-Sep 1.79
18-Sep 3.38
19-Sep 0.41
20-Sep 0.05
21-Sep 0.00
22-Sep 0.07
Total 6.67
As shown in Table 2, the total amount of rainfall leading up to the testing date, September 22nd,
was over six inches. This could have had a substantial impact on our test readings because the
rain contributed a large amount of freshwater to the area; this could have diluted the chemical
compound concentrations that may have been present before the rainfall occurred.
In the future, it would be very interesting to test the drainage ditches and the pond when
there has been no rainfall for the week prior to testing, and then again test the ditches after a
13. substantial amount of rain, then compare the data. Doing this might be helpful in understanding
how rainfall could impact the physical and chemical properties of the water on the UHCL
campus. Overall, the chemical levels meet the state requirements, indicating that the water is safe
for use by plants and animals, with the exception of ammonia levels, which may need to be
further tested and monitored.
14. REFERENCES
Brower JE, Zar JH, von Ende CN. 1998. Field and laboratory methods for general ecology. 4th
ed. Boston (MA): McGraw-Hill.
Kimball, JW. 2013. The Nitrogen Cycle [Internet]. Available from
http://users.rcn.com/jkimball.ma.ultranet/BiologyPages/W/Welcome.html#about_the_aut
hor
Molles Jr., MC. 2013. Ecology concepts and applications. 6th ed. New York (NY): McGraw-Hill.