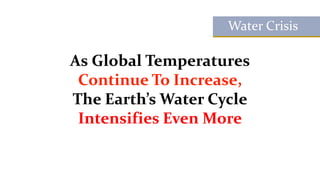
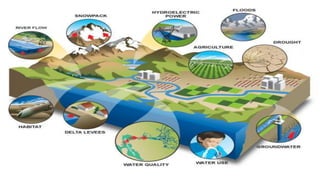
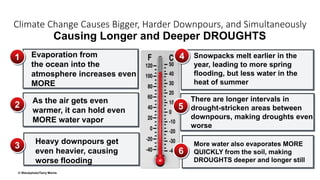
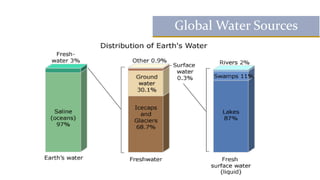
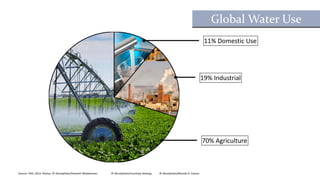
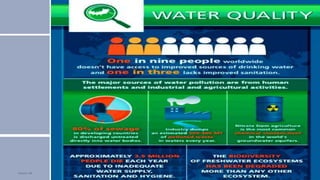
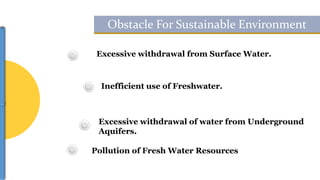
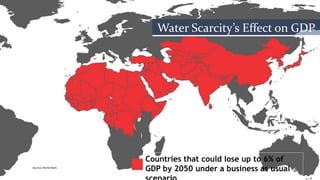
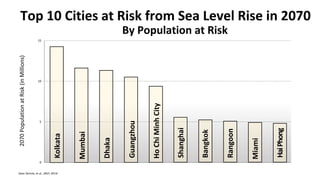
Climate Change and Water Crisis
Obstacle for Sustainable Environment
Syeda Nishat Naila
Exam Roll : 1840
Department of Soil, Water and Environment
University of Dhaka
Climate Change
Some of this
outgoing infrared
radiation is trapped
by the earth’s
atmosphere and
warms it
Some energy is
radiated back into
space by the earth
in the form of
infrared waves
Most of this radiation
is absorbed by the
Earth and warms it
Global Warming
-0.5°
0.0°
0.5°
1.0°
1880 1890 1900 1910 1920 1930 1940 1950 1960 1970 1980 1990 2000 2010 2020
Global Surface Temperature – Departure from
Average• 1880 – 2016
Anomaly(°C)
Data: NOAA
COAL
MINING
THAWING PERMAFROST
COAL PLANTS
CROP BURNING
OIL PRODUCTION
FOREST BURNING
LAND
TRANSPORTATION
LANDFILLS
FERTILIZATION
INDUSTRIAL AGRICULTURE
INDUSTRIAL PROCESSES
AIR
TRANSPORT
Melcher
Where Do Greenhouse Gases Come From?
Sources of Global Warming
Impacts
of
Global
Warming
As Global Temperatures
Continue To Increase,
The Earth’s Water Cycle
Intensifies Even More
Water Crisis
Evaporation Precipitation
Water Returns to the Sea Sources: Oak Ridge National Laboratory, U.S.
Dept. of Energy; © Getty Images; © Pond5
The
Hydrological
Cycle
Hydrological Cycle
Climate change
“will likely lead to
food and water shortages,
and resources, and destruction by
natural disasters in regions across
the globe.”
Impacts Of Climate Change
Climate Change Causes Bigger, Harder Downpours, and Simultaneously
1
2
3
4Evaporation from
the ocean into the
atmosphere increases even
MORE
As the air gets even
warmer, it can hold even
MORE water vapor
Heavy downpours get
even heavier, causing
worse flooding
5
Snowpacks melt earlier in the
year, leading to more spring
flooding, but less water in the
heat of summer
6
There are longer intervals in
drought-stricken areas between
downpours, making droughts even
worse
More water also evaporates MORE
QUICKLY from the soil, making
DROUGHTS deeper and longer still
Causing Longer and Deeper DROUGHTS
© iStockphoto/Terry Morris
Global Water Sources
11% Domestic Use
19% Industrial
70% Agriculture
Source: FAO, 2012. Photos: © iStockphoto/Kenneth Wiedemann; © iStockphoto/Courtney Keating; © iStockphoto/Brenda A. Carson
Global Water Use
As Temperatures Rise, So Does Water Use
People Crops Energy AnimalsIndustry
iStockphoto: © tazytazl , © PhotographyPerspectives , © acilo , © Shutterstock/Dusan Petkovic, © Olivier Lantzendörffer
Water scarcity
affects
more than 40%
of the world’s population
Water Crisis And Demand
Excessive withdrawal from Surface Water.
Inefficient use of Freshwater.
Excessive withdrawal of water from Underground
Aquifers.
Pollution of Fresh Water Resources
Obstacle For Sustainable Environment
Source: World Bank
Countries that could lose up to 6% of
GDP by 2050 under a business as usual
Water Scarcity’s Effect on GDP
0
5
10
15
Data: Nichols, et al., 2007, OECD
2070PopulationatRisk(inMillions)
Kolkata
Mumbai
Dhaka
Guangzhou
HoChiMinhCity
Shanghai
Bangkok
Rangoon
Miami
HaiPhong
Top 10 Cities at Risk from Sea Level Rise in 2070
By Population at Risk
Vulnerability To Bangladesh
Major Groundwater Aquifers
Losing WaterSource: Richey, et al., “Quantifying Renewable Groundwater Stress with GRACE,” Water Resources Research, 2015. Graphic: UC
Irvine/NASA/JPL-Caltech
Water Loss per Year
20+mm1
0° 1°
“Consume Less, Conserve More.”
New Investments
Dams, Barrages, Irrigation Systems,
Canals, Pumps, Rivers, Wetlands
Rainwater Harvesting, Water
Conservation, Pricing, Regulation,
Legislation, Basin Planning, Funding Or
Ecosystem Services, Stakeholder
Participation, Consumer Education And
Awareness.
Reservoirs, Irrigation Systems,
Capacity Expansions, Levees, Water
Supply, Wastewater Treatments,
Ecosystem Restoration,
canal digging.
Ecology, Pollution Control,
Climate Change, Population
Growth.
Operation, Monitoring And
Regulation Practices
Solution
Maintenance, Major
Rehabilitation
Integrated Water Resource
Management
Efficient Technologies
Desalination, Biotechnology, Drip Irrigation,
Wastewater Reuse, Recycling, Solar Panels
Home Solar Panels
Bangladesh
.
Adaptation to Climate Change
Number of Home Solar PV Systems in Bangladesh
• 1997 – 2014
0
400,000
800,000
1,200,000
1,600,000
2,000,000
2,400,000
2,800,000
1997 2000 2003 2006 2009 2012
Data: IDCOL, IOREC, IRENA
NumberofSystems
2014
A picture is worth a
thousand words
A complex idea can be conveyed
with just a single still image,
namely making it possible to
absorb large amounts of data
quickly.
Climate Change Manifests
Itself Through Water Resources.
Water-related Climate Change
Adaptation Has A Pivotal
Role In Achieving
Sustainable Development.
Conclusion
Climate Change And Water Crisis

Climate Change And Water Crisis

  • 1.
    Climate Change andWater Crisis Obstacle for Sustainable Environment Syeda Nishat Naila Exam Roll : 1840 Department of Soil, Water and Environment University of Dhaka
  • 2.
  • 3.
    Some of this outgoinginfrared radiation is trapped by the earth’s atmosphere and warms it Some energy is radiated back into space by the earth in the form of infrared waves Most of this radiation is absorbed by the Earth and warms it Global Warming
  • 4.
    -0.5° 0.0° 0.5° 1.0° 1880 1890 19001910 1920 1930 1940 1950 1960 1970 1980 1990 2000 2010 2020 Global Surface Temperature – Departure from Average• 1880 – 2016 Anomaly(°C) Data: NOAA
  • 5.
    COAL MINING THAWING PERMAFROST COAL PLANTS CROPBURNING OIL PRODUCTION FOREST BURNING LAND TRANSPORTATION LANDFILLS FERTILIZATION INDUSTRIAL AGRICULTURE INDUSTRIAL PROCESSES AIR TRANSPORT Melcher Where Do Greenhouse Gases Come From? Sources of Global Warming
  • 6.
  • 7.
    As Global Temperatures ContinueTo Increase, The Earth’s Water Cycle Intensifies Even More Water Crisis
  • 8.
    Evaporation Precipitation Water Returnsto the Sea Sources: Oak Ridge National Laboratory, U.S. Dept. of Energy; © Getty Images; © Pond5 The Hydrological Cycle Hydrological Cycle
  • 9.
    Climate change “will likelylead to food and water shortages, and resources, and destruction by natural disasters in regions across the globe.” Impacts Of Climate Change
  • 10.
    Climate Change CausesBigger, Harder Downpours, and Simultaneously 1 2 3 4Evaporation from the ocean into the atmosphere increases even MORE As the air gets even warmer, it can hold even MORE water vapor Heavy downpours get even heavier, causing worse flooding 5 Snowpacks melt earlier in the year, leading to more spring flooding, but less water in the heat of summer 6 There are longer intervals in drought-stricken areas between downpours, making droughts even worse More water also evaporates MORE QUICKLY from the soil, making DROUGHTS deeper and longer still Causing Longer and Deeper DROUGHTS © iStockphoto/Terry Morris
  • 11.
  • 12.
    11% Domestic Use 19%Industrial 70% Agriculture Source: FAO, 2012. Photos: © iStockphoto/Kenneth Wiedemann; © iStockphoto/Courtney Keating; © iStockphoto/Brenda A. Carson Global Water Use
  • 13.
    As Temperatures Rise,So Does Water Use People Crops Energy AnimalsIndustry iStockphoto: © tazytazl , © PhotographyPerspectives , © acilo , © Shutterstock/Dusan Petkovic, © Olivier Lantzendörffer
  • 14.
    Water scarcity affects more than40% of the world’s population Water Crisis And Demand
  • 15.
    Excessive withdrawal fromSurface Water. Inefficient use of Freshwater. Excessive withdrawal of water from Underground Aquifers. Pollution of Fresh Water Resources Obstacle For Sustainable Environment
  • 16.
    Source: World Bank Countriesthat could lose up to 6% of GDP by 2050 under a business as usual Water Scarcity’s Effect on GDP
  • 17.
    0 5 10 15 Data: Nichols, etal., 2007, OECD 2070PopulationatRisk(inMillions) Kolkata Mumbai Dhaka Guangzhou HoChiMinhCity Shanghai Bangkok Rangoon Miami HaiPhong Top 10 Cities at Risk from Sea Level Rise in 2070 By Population at Risk
  • 18.
  • 19.
    Major Groundwater Aquifers LosingWaterSource: Richey, et al., “Quantifying Renewable Groundwater Stress with GRACE,” Water Resources Research, 2015. Graphic: UC Irvine/NASA/JPL-Caltech Water Loss per Year 20+mm1
  • 21.
  • 22.
    “Consume Less, ConserveMore.” New Investments Dams, Barrages, Irrigation Systems, Canals, Pumps, Rivers, Wetlands Rainwater Harvesting, Water Conservation, Pricing, Regulation, Legislation, Basin Planning, Funding Or Ecosystem Services, Stakeholder Participation, Consumer Education And Awareness. Reservoirs, Irrigation Systems, Capacity Expansions, Levees, Water Supply, Wastewater Treatments, Ecosystem Restoration, canal digging. Ecology, Pollution Control, Climate Change, Population Growth. Operation, Monitoring And Regulation Practices Solution Maintenance, Major Rehabilitation Integrated Water Resource Management Efficient Technologies Desalination, Biotechnology, Drip Irrigation, Wastewater Reuse, Recycling, Solar Panels
  • 23.
  • 24.
    Number of HomeSolar PV Systems in Bangladesh • 1997 – 2014 0 400,000 800,000 1,200,000 1,600,000 2,000,000 2,400,000 2,800,000 1997 2000 2003 2006 2009 2012 Data: IDCOL, IOREC, IRENA NumberofSystems 2014
  • 25.
    A picture isworth a thousand words A complex idea can be conveyed with just a single still image, namely making it possible to absorb large amounts of data quickly. Climate Change Manifests Itself Through Water Resources. Water-related Climate Change Adaptation Has A Pivotal Role In Achieving Sustainable Development. Conclusion

Editor's Notes

  • #3 ID #3719 - May not be modified or used in presentations that are recorded, streamed, or broadcast. Here’s a more immediate problem. The land based ice in the arctic is melting and raising sea levels. This is in Svalbard. DESCRIPTION: Photo of meltwater gushing from an ice cap on the island of Nordaustlandet, in Norway’s Svalbard Archipelago ADDITIONAL TALKING POINTS: The more of the sun’s energy an object absorbs the warmer it will become. Scientists measure how well a surface reflects solar energy on a scale of 0 to 1 known as albedo. Black is 0, or the perfect absorber, while white is 1, or the perfect reflector. The typical ocean albedo is approximately 0.06 while bare sea ice varies from 0.5 to 0.7. This means the ocean reflects only six percent of the incoming solar radiation while sea ice reflects 50 to 70 percent. Water absorbs more of the Sun’s energy causing it to get warmer than ice would. If that water is forming on top of the ice, it speeds up the melting process as it absorbs more energy than the ice normally would.* REFERENCES: * National Snow and Ice Data Center, “Thermodynamics: Albedo,” last accessed February, 2017. https://nsidc.org/cryosphere/seaice/processes/albedo.html
  • #4 ID #23 - Can be used in noncommercial online and TV broadcasts of your presentation, but not modified. This drives the temp up beyond what is healthy for life. DESCRIPTION: Diagram of the increased trapping of heat by Earth’s atmosphere as a result of additional greenhouse gases ADDITIONAL TALKING POINTS: Carbon dioxide (CO2) and other greenhouse gases absorb more solar radiation and trap more heat in the atmosphere. Earth has continued to warm from the addition of more and more CO2 and other pollution from dirty energy sources into the atmosphere.* REFERENCES: * National Aeronautics and Space Administration, “Global Climate Change: Causes,” last updated March 2, 2016. http://climate.nasa.gov/causes/
  • #5 ID #3628.C - Can be used in noncommercial online and TV broadcasts of your presentation, but not modified. This is another way to show the change in global surface temperatures. This graph starts in 1880 because that was when they started measuring with instruments. DESCRIPTION: Graph showing the global average land and ocean temperature anomalies every year from 1880-2016 ADDITIONAL TALKING POINTS: According to data from the US National Oceanic and Atmospheric Administration (NOAA), 2016 was the hottest year on record globally.* REFERENCES: * National Oceanic and Atmospheric Administration, “Climate at a Glance: Global Time Series,” National Centers for Environmental Information, last accessed February, 2017. http://www.ncdc.noaa.gov/cag/time-series/global/globe/land_ocean/ytd/12/1880-2016
  • #6 ID #19 - Can be used in noncommercial online and TV broadcasts of your presentation, but not modified. The main source of these heat-trapping gases is the burning of fossil fuels, but that is not the only source. There is also industrial agriculture, thawing permafrost, land transportation, and so on. DESCRIPTION: Graphic representation of major sources of greenhouse gas emissions   ADDITIONAL TALKING POINTS: Most of the global warming we’re seeing today is caused by carbon pollution from fossil fuels.* Other important contributors include deforestation, transportation, agriculture (crops and livestock) and industrial processes.**   REFERENCES: * Union of Concerned Scientists, “Why Does CO2 Get Most of the Attention When There are So Many Other Heat-Trapping Gases (Greenhouse Gases)?," last updated May 1, 2009. http://www.ucsusa.org/global_warming/science_and_impacts/science/CO2-and-global-warming-faq.html ** U.S. Environmental Protection Agency, “Global Greenhouse Gas Emissions Data," last updated September 9, 2013. http://www.epa.gov/climatechange/ghgemissions/global.html
  • #8 ID #1062 - Can be used in noncommercial online and TV broadcasts of your presentation, but not modified. This is a continuing process… DESCRIPTION: Text slide about the intensification of the water cycle with increasing global temperatures
  • #9 ID #961 - Can be used in noncommercial online and TV broadcasts of your presentation, but not modified. You know the hydrological cycle: water evaporates, comes over the land and precipitates, and then runs back to the ocean through rivers and streams, but it has being disrupted because the warming of the ocean is putting so much more water vapor into the air. It is putting the hydrological cycle on steroids. DESCRIPTION: Animated diagram of the hydrological (water) cycle ADDITIONAL TALKING POINTS: As the lower atmosphere warms, evaporation and thus atmospheric water vapor concentration increases, which leads to increased precipitation frequency (mainly over land areas) and more precipitation as rain (rather than snow).* REFERENCES: * NASA Earth Observatory, “The Water Cycle and Climate Change," last accessed September, 2016. http://earthobservatory.nasa.gov/Features/Water/page3.php
  • #10 ID #3701 - Can be used in noncommercial online and TV broadcasts of your presentation, but not modified. The US Pentagon has warned for many years that the climate crisis is going to cause refugee crises. The flow of refugees into Europe, destabilizing Europe, has many causes, but climate is one of them. DESCRIPTION: Quote from the US Department of Defense’s 2014 Climate Change Adaptation Roadmap, publicly released October 13, 2014 ADDITIONAL TALKING POINTS: In October 2014, the US Department of Defense publicly released a groundbreaking report declaring, “climate change will affect the Department of Defense's ability to defend the Nation and poses immediate risks to U.S. national security.” They pointed out that rising global temperatures, changing precipitation patterns, climbing sea levels, and more extreme weather events will intensify the challenges of global instability, hunger, poverty, and conflict. Lastly, then-Secretary of Defense Chuck Hagel noted, “politics or ideology must not get in the way of sound planning.”* REFERENCES: * US Department of Defense, 2014 Climate Change Adaptation Roadmap (October 2014). http://thehill.com/policy/energy-environment/220577-read-dod-report-2014-climate-change-adaptation-roadmap
  • #11 ID #964 - Can be used in noncommercial online and TV broadcasts of your presentation, but not modified. …as temperatures rise, there are even bigger downpours, longer floods, and deeper droughts. Downpours get heavier, communities that rely on melting snowpack lose their water source, and the intervals between rain grows longer, all while evaporation increases. DESCRIPTION: Text slide summarizing the intensification of the water cycle ADDITIONAL TALKING POINTS: The water cycle has no start and no end, but the ocean contains the majority of the planet’s water so that is a good place to start. The sun heats the ocean, and as the water warms, some of it evaporates into vapor and rising air current take it up into the atmosphere. This same process occurs on the land: as the soil heats up, some of the water trapped in the ground also evaporates and is pulled up into the atmosphere. As the water vapor rises higher, the surrounding temperature drops and the cooled water condenses into clouds. Air currents move these clouds around the globe and as these cloud particles collide and grow, the water vapor falls, or “precipitates”, out of the sky as rain or snow. The precipitation can fall into the ocean, onto the land, or accumulate on glaciers and ice caps. Some of the precipitation that falls on land forms lakes and streams, while the rest of it seeps into the ground where it infiltrates aquifers.* REFERENCES: * United States Geological Survey, “Summary of the Water Cycle,” United States Department of the Interior, last accessed March 18, 2016. http://water.usgs.gov/edu/watercyclesummary.html
  • #13 ID #1287 - Can be used in noncommercial online and TV broadcasts of your presentation, but not modified. A little more than 10 percent of water usage is domestic while the vast majority is for agriculture. DESCRIPTION: Chart of global water use by sector: agricultural (70 percent), industrial (19 percent), and municipal (11 percent)* ADDITIONAL TALKING POINTS: It is projected that by 2025, water use in developing countries will increase by 50 percent and 18 percent in developed countries and 1.8 billion people will be living in areas with absolute water scarcity.** Every year, worldwide freshwater demand increases by about 64 billion cubic meters (one cubic meter = 1,000 liters).*** REFERENCES: * Food and Agriculture Organization of the United Nations (FAO), “Water Uses,” last accessed March 10, 2016. http://www.fao.org/nr/water/aquastat/water_use/index.stm ** International Fund for Agricultural Development, “Water Facts and Figures – Water Use,” last accessed March 10, 2016. http://www.ifad.org/english/water/key.htm *** United Nations Water – Statistics, “Population Increase Implies Increased Freshwater Demand of About 64 Billion Cubic Meters a Year,” last updated October 7, 2014. http://www.unwater.org/statistics/statistics-detail/en/c/211814/
  • #14 ID #3793 - Can be used in noncommercial online and TV broadcasts of your presentation, but not modified. Increasing water needs has a huge effect on people, crops, energy, and industry. DESCRIPTION: Photos of global sectors that will use more water as temperatures rise ADDITIONAL TALKING POINTS: As global temperatures continue to rise, water availability may decrease and affect numerous sectors in many countries. Current drought areas are expected to experience further reduced water availability for irrigation, and water quality in many regions may also suffer.* REFERENCES: * United States Environmental Protection Agency, “International – Climate Impacts on Global Issues,” last updated February 23, 2016. http://www3.epa.gov/climatechange/impacts/international.html
  • #15 ID #4048 - Can be used in noncommercial online and TV broadcasts of your presentation, but not modified. Already water scarcity is a large problem in much of the world, it is affecting 40 percent of the global population. DESCRIPTION: Text slide that water scarcity affects more than 40 percent of the world’s population ADDITIONAL TALKING POINTS: According to a recent World Bank Report, some regions could see their growth rates decline by as much as 6 percent of GDP by 2050 as a result of water-related losses in agriculture, health, income, and property—sending them into sustained negative growth. Alternatively, some regions stand to see growth accelerate as much as 6 percent with better water resource management. The impacts of water mismanagement are felt disproportionately by the poor, who are more likely to rely on rain-fed agriculture to feed their families, live on the most marginal lands which are more prone to floods, and are most at risk from contaminated water and inadequate sanitation.* REFERENCES: * World Bank Group, “High and Dry: Climate Change, Water, and the Economy,” 2016. https://openknowledge.worldbank.org/bitstream/handle/10986/23665/K8517.pdf?sequence=11&isAllowed=y
  • #17 ID #4049 - Can be used in noncommercial online and TV broadcasts of your presentation, but not modified. This map shows countries where GDP could decrease six percent or more because of water scarcity. DESCRIPTION: Map of countries that could lose up to 6 percent of GDP by 2050 under a business as usual scenario thanks to water scarcity ADDITIONAL TALKING POINTS: According to a recent World Bank Report, some regions could see their growth rates decline by as much as 6 percent of GDP by 2050 as a result of water-related losses in agriculture, health, income, and property—sending them into sustained negative growth. Alternatively, some regions stand to see growth accelerate as much as 6 percent with better water resource management. The impacts of water mismanagement are felt disproportionately by the poor, who are more likely to rely on rain-fed agriculture to feed their families, live on the most marginal lands which are more prone to floods, and are most at risk from contaminated water and inadequate sanitation.* REFERENCES: * World Bank Group, “High and Dry: Climate Change, Water, and the Economy,” 2016. https://openknowledge.worldbank.org/bitstream/handle/10986/23665/K8517.pdf?sequence=11&isAllowed=y
  • #20 ID #3399 - Can be used in noncommercial online and TV broadcasts of your presentation, but not modified. Aquifers around the world are being depleted at alarming rates. DESCRIPTION: Map showing water loses from the world’s largest aquifers, 2003-2013 ADDITIONAL TALKING POINTS: About one-third of the largest groundwater basins are being rapidly depleted. Of the 37 largest aquifers in the world, 21 are being depleted at unsustainable rates and 13 are considered significantly distressed and a threat to regional water security and resilience.* REFERENCES: * NASA Jet Propulsion Laboratory, “Study: Third of Big Groundwater Basins in Distress,” June 16, 2015. http://www.jpl.nasa.gov/news/news.php?feature=4626
  • #22 ID #3735.B - Can be used in noncommercial online and TV broadcasts of your presentation, but not modified. What’s grid parity? This is the point where unsubsidized, levelized electricity from renewables is cheaper than fossil fuels. This is like difference between 32 degrees and 33 degrees Fahrenheit, or 0 degrees Celsius and 1 degree Celsius. This is the difference between ice and water. I haven’t been in the business community that long, but it does seem to matter if your product is cheaper. That’s the difference between markets that are frozen up and those with liquid flows of capital that are finding more investment opportunities. DESCRIPTION: Image of ice cubes and cold water illustrating the difference that a single degree can make ADDITIONAL TALKING POINTS: The analogy between ice and cold water is useful for conceptualizing the idea of economic “tipping points”. Despite being separated by only one degree, the two forms of water are in completely different states. A similar large-scale change in state can occur in economies when the cost of a new technology falls low enough to compete with more-established technologies.
  • #25 ID #2287 - Can be used in noncommercial online and TV broadcasts of your presentation, but not modified. … DESCRIPTION: Graph showing the number of home solar PV systems installed in Bangladesh, 1997-2014   ADDITIONAL TALKING POINTS: Solar home PV systems usually consist of a solar PV module, a battery box, and a control panel, which together can be used to provide lighting, charge cell phones, and even power radios and small televisions.*   Not only have these systems been helping to provide electricity to millions of people in Bangladesh who are not connected to a power grid, but they have also created about 114,000 new renewable energy jobs (mostly in PV installations and maintenance). Moreover, solar PV home systems are helping the country “leapfrog” the need to build a bigger and more expensive power grid. **   REFERENCES: * Nazmul Haque, Effective and Innovative Business Models. What Viability for Privately Led Initiatives? IDCOL Solar Home System Program in Bangladesh, November 1-2, 2012. http://www.iorec.org/iorec1/pdf/1_Session%203.pdf ** Todd Woody, “Why Green Jobs Are Booming in Bangladesh,” The Atlantic, May 12, 2014. http://www.theatlantic.com/technology/archive/2014/05/why-a-green-jobs-boom-is-under-way-in-bangladesh/362087/
  • #27 ID #3 - Can be used in noncommercial online and TV broadcasts of your presentation. Four years later, this image was taken during the Apollo 17 mission – the last lunar mission. This one picture is the most published photograph ever; the single most iconic image in human history. DESCRIPTION: Photo from Apollo 17, taken as the crew was traveling toward the moon on December 7, 1972   ADDITIONAL TALKING POINTS: This picture is called the “Blue Marble” image of the earth, and was taken in 1972, during the last Apollo mission. It is unique because the entire circle of the earth is revealed; the photo helps us think about our planet in its entirety.*   It was also the first time the Apollo mission made it possible to capture almost the entire southern polar ice cap.**   REFERENCES: * LIFE Magazine, “Home, Sweet Home: In Praise of ‘Blue Marble’," last accessed April 2014. http://life.time.com/history/blue-marble-the-iconic-apollo-17-photo-of-earth-from-space/#1 ** NASA, Visible Earth, “The Blue Marble from Apollo 17," December 7, 1972. http://visibleearth.nasa.gov/view.php?id=55418