Downloaded 196 times
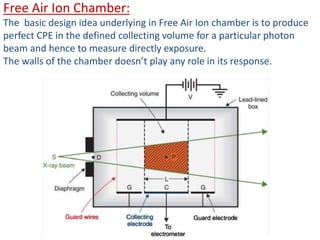
![If Q is the charge collected and ρ is the density of air, Then exposure
at point P (centre of the specified volume)
X(P) =Q/ M
Where M is the irradiated air mass , Which can derived as
M = ρ Ap L
Ap = cross section area of the beam at point P
L = Length of the collecting volume
==> X(P) =Q/ ρ Ap L
But it is difficult to measure X(P) accurately at point P. The law of
divergence obeyed by the photon beam can apply to overcome this issue
X(P) α 1/d2 and A(P) α d2
==> X(P) .Ap = constant
==> X(P).Ap = X(D).AD ==> Ap = [X(D).AD]/X(P)
Finally, X(D) = Q/ ρ AD L
Here AD = Area of cross section of the Diaphragm at point D
X(D) = exposure at point D
This indicates that the point measurement becomes centre point of
Diaphragm of Chamber](https://image.slidesharecdn.com/radiationdosimteryprincicles-171226165043/85/Radiation-dosimtery-princicles-12-320.jpg)
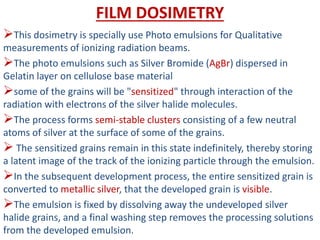
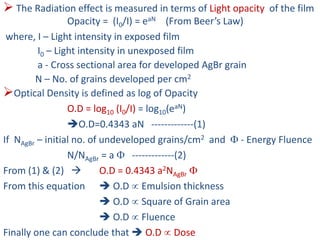
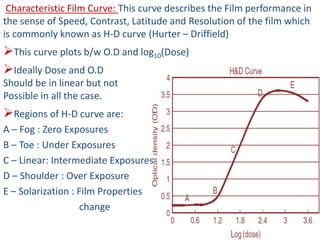
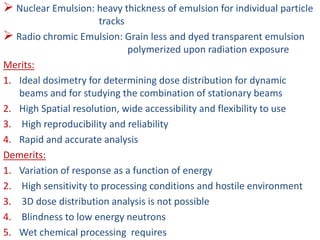
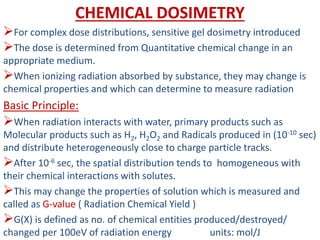
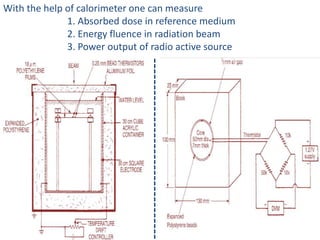


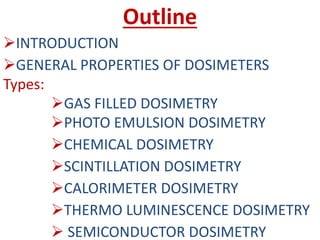
The document discusses various types of radiation dosimetry including film dosimetry. Film dosimetry uses photoemulsions like silver bromide dispersed in gelatin that form latent images when exposed to radiation. During development, sensitized grains are converted to metallic silver making the tracks visible. The optical density of the film is proportional to the absorbed dose based on Beer's law. A characteristic H-D curve describes the film performance in terms of speed, contrast, latitude and resolution. Film dosimetry provides high spatial resolution and flexibility but response varies with energy and processing conditions.