Downloaded 179 times

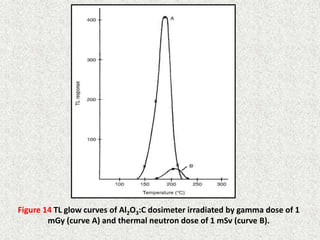


LiF:Mg,Ti (TLD-100) is a nearly tissue-equivalent thermoluminescent dosimeter material that is widely used for radiation dosimetry. It has good reproducibility and sensitivity for low doses. TLDs must be calibrated against absolute dosimeters. The TL response of TLD-100 depends on radiation quality and dose, and it exhibits fading over time. Computerized glow curve analysis can provide information on individual TL peaks. LiF:Mg,Cu,P has higher sensitivity and better tissue equivalence than TLD-100. CaF:Tm (TLD-300) can separate high and low LET radiation components based on peak heights. Various TLD materials are used for different applications


