D2: Define theproblem in the customer terms: Collect the information and statistics regarding the complaint or the deficiency with 5W2H, ie. Who? When ? Where? What? Why? How? How many? The graphs, charts, tables and pictures would be useful to visualize the problem. Define the effects of the problem.
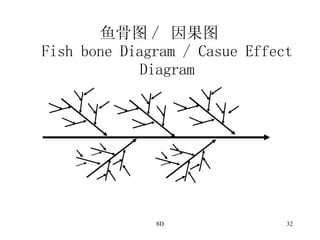
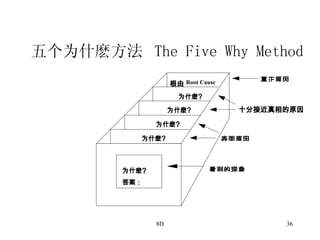
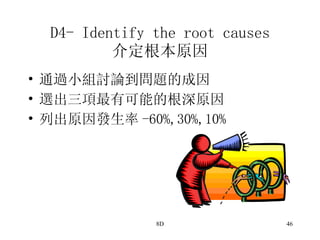
D4- Identify theroot causes 介定根本原因 Cause & Effect (Fishbone) diagrams # 原因及效應分析圖 ( 魚骨圖 ) Identify at least 3 major causes and give occurrence ratio for each priority. # 鎖定最少 3 個主要原因及估計各項發生比率 5 ‘Why?’ # 5 個’為什麼 ?’ Cross check with existing PFMEA table if necessary. # 如有需要,可使用過程失效及效應分析圖複檢