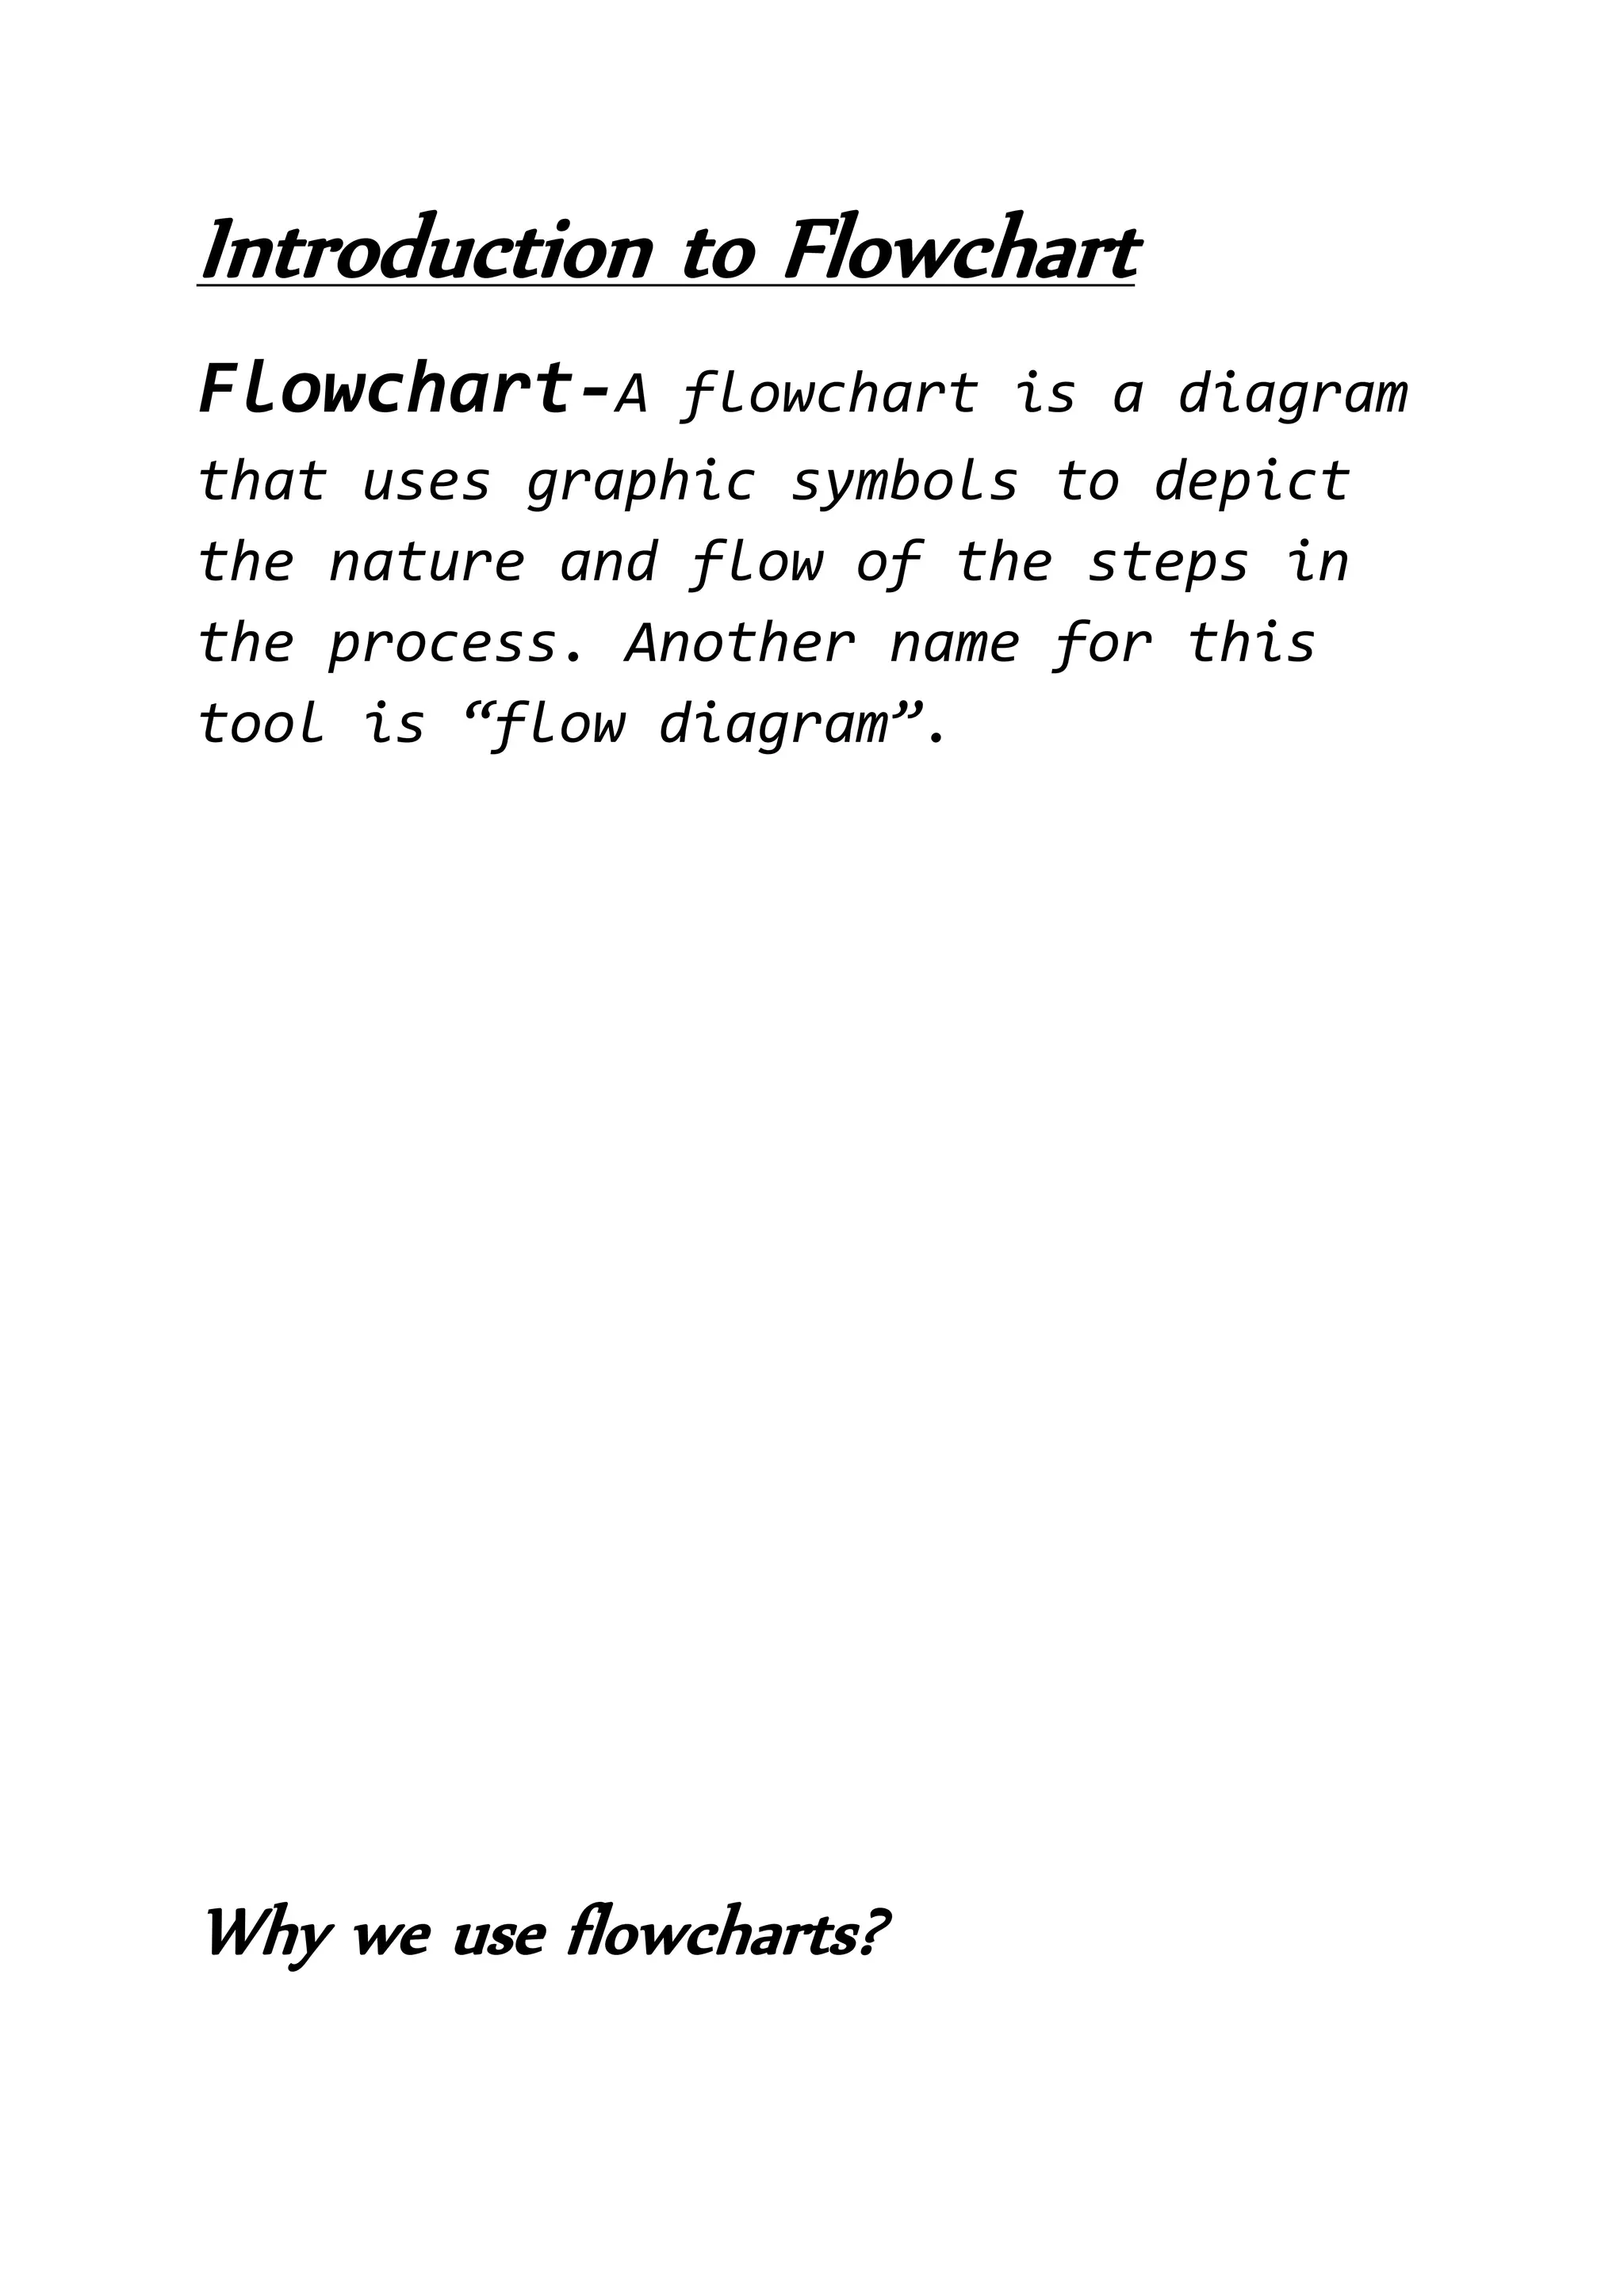
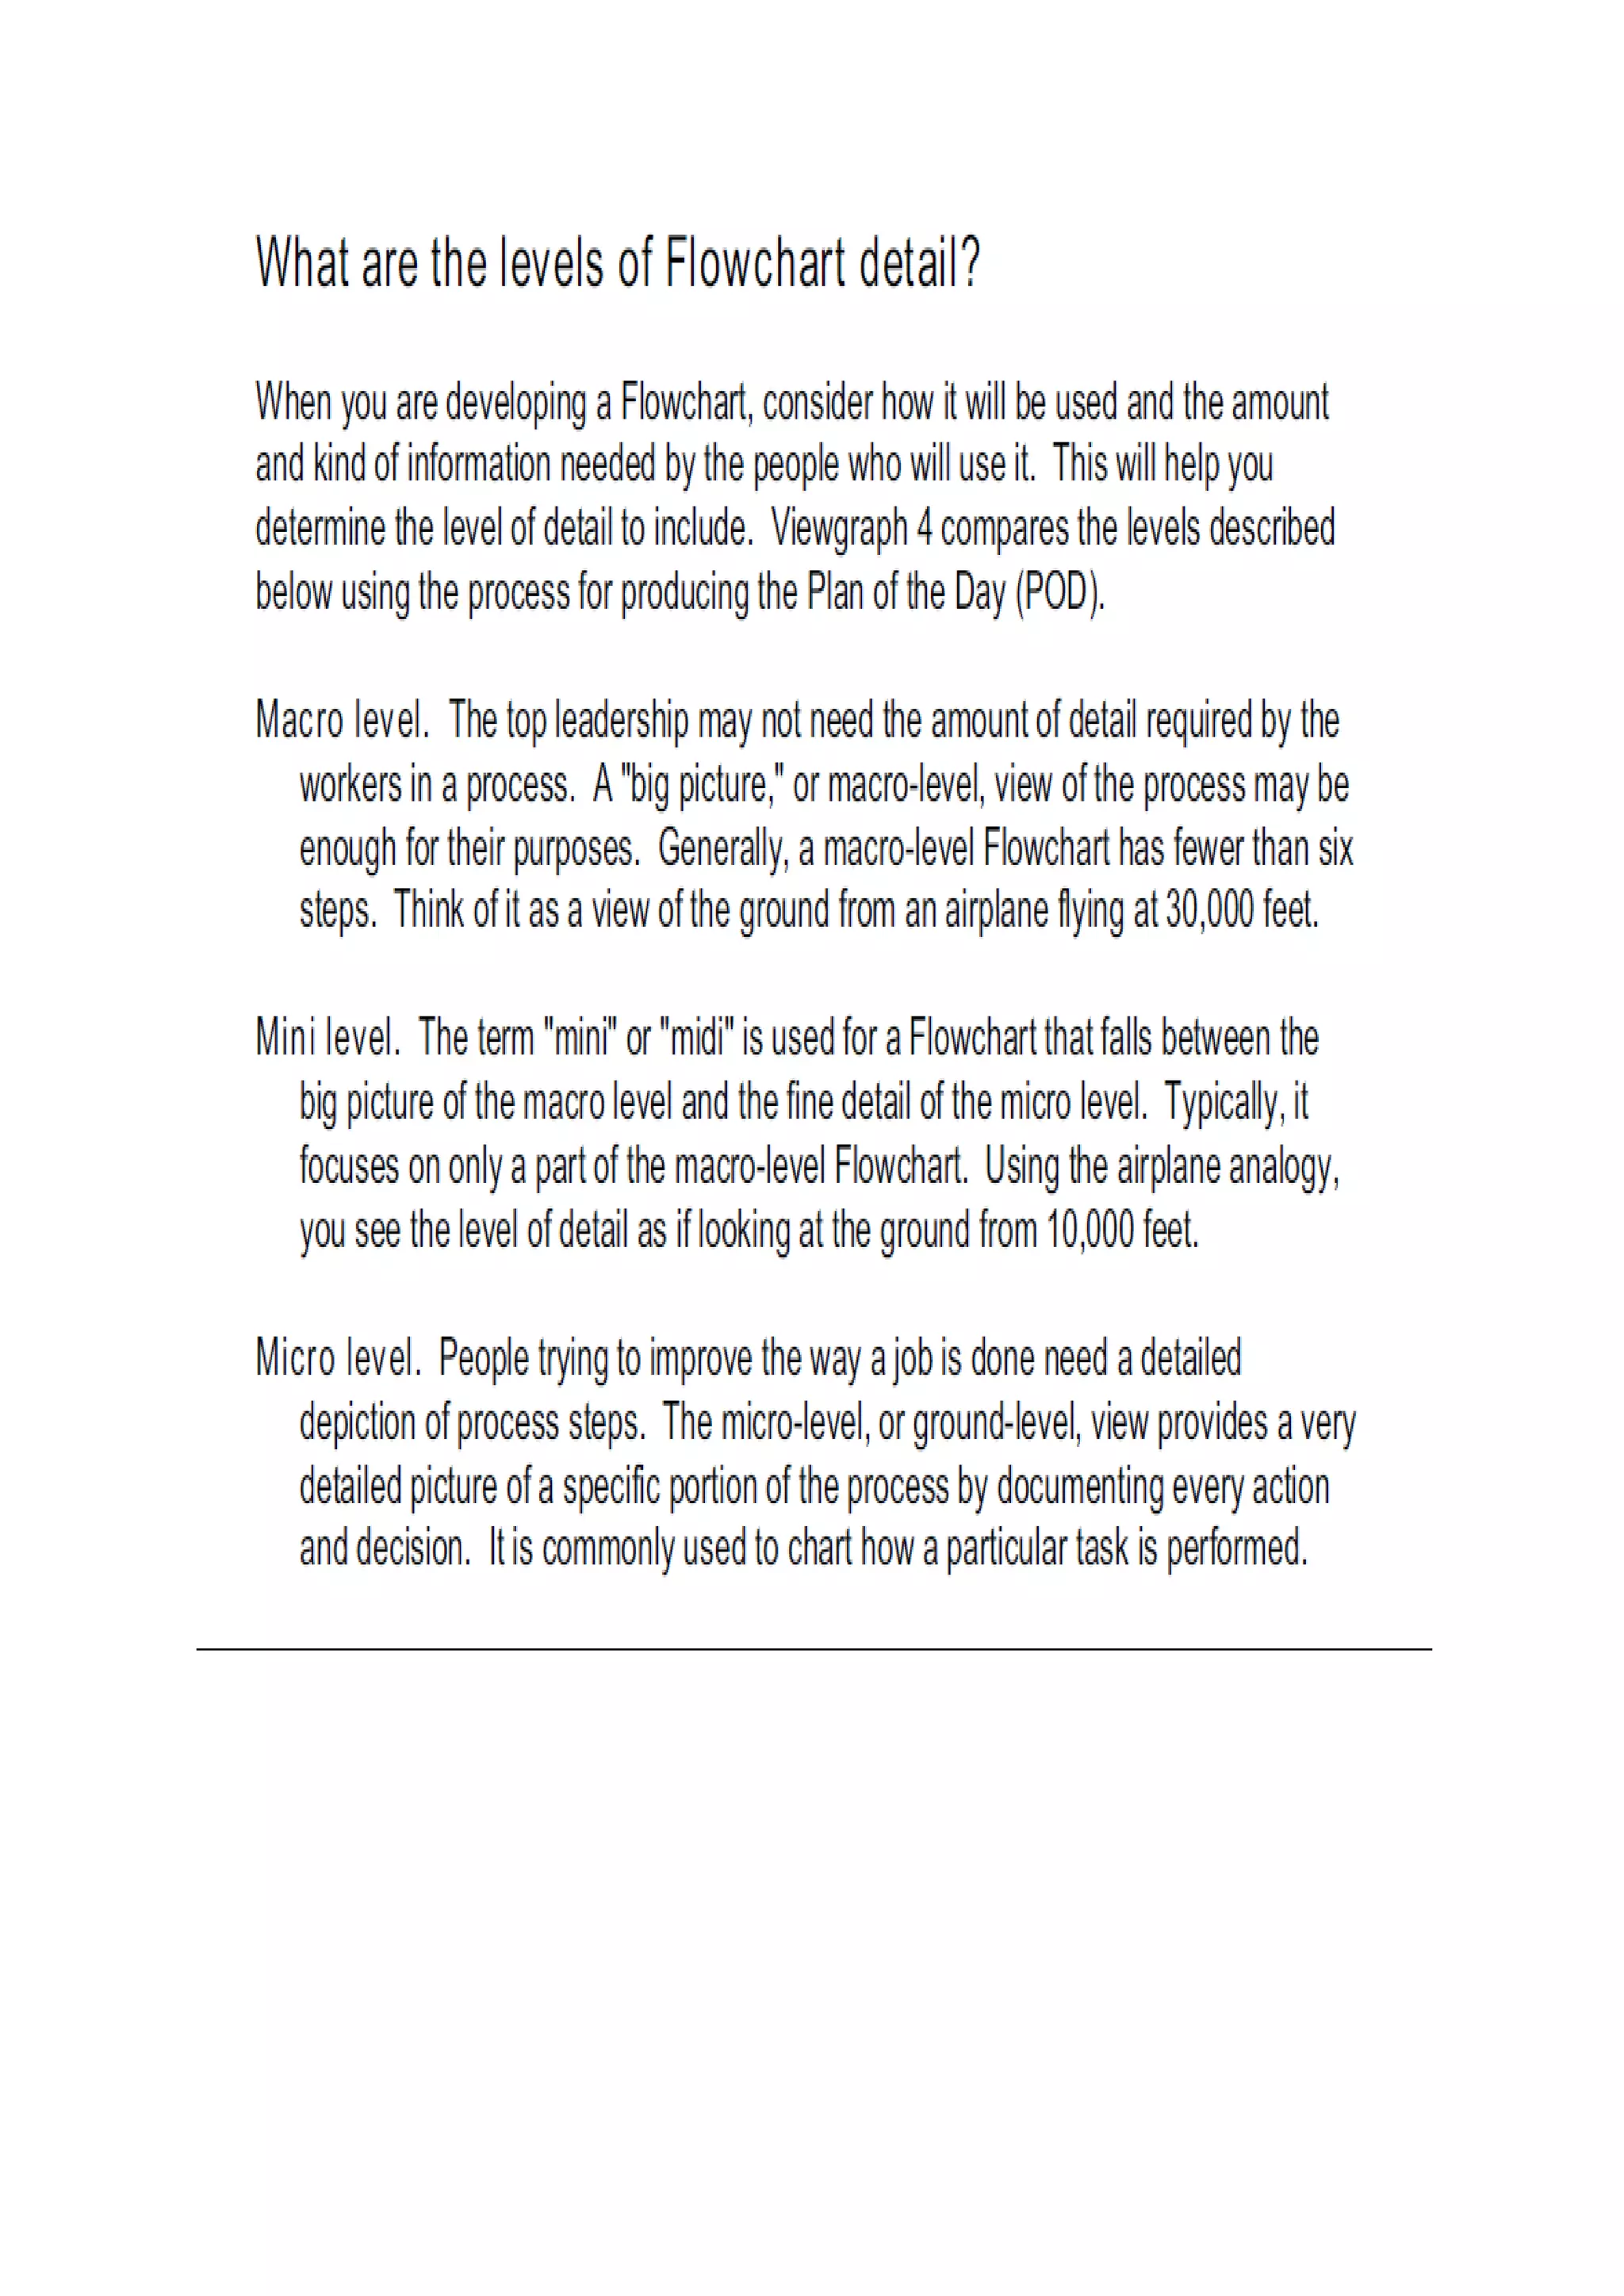
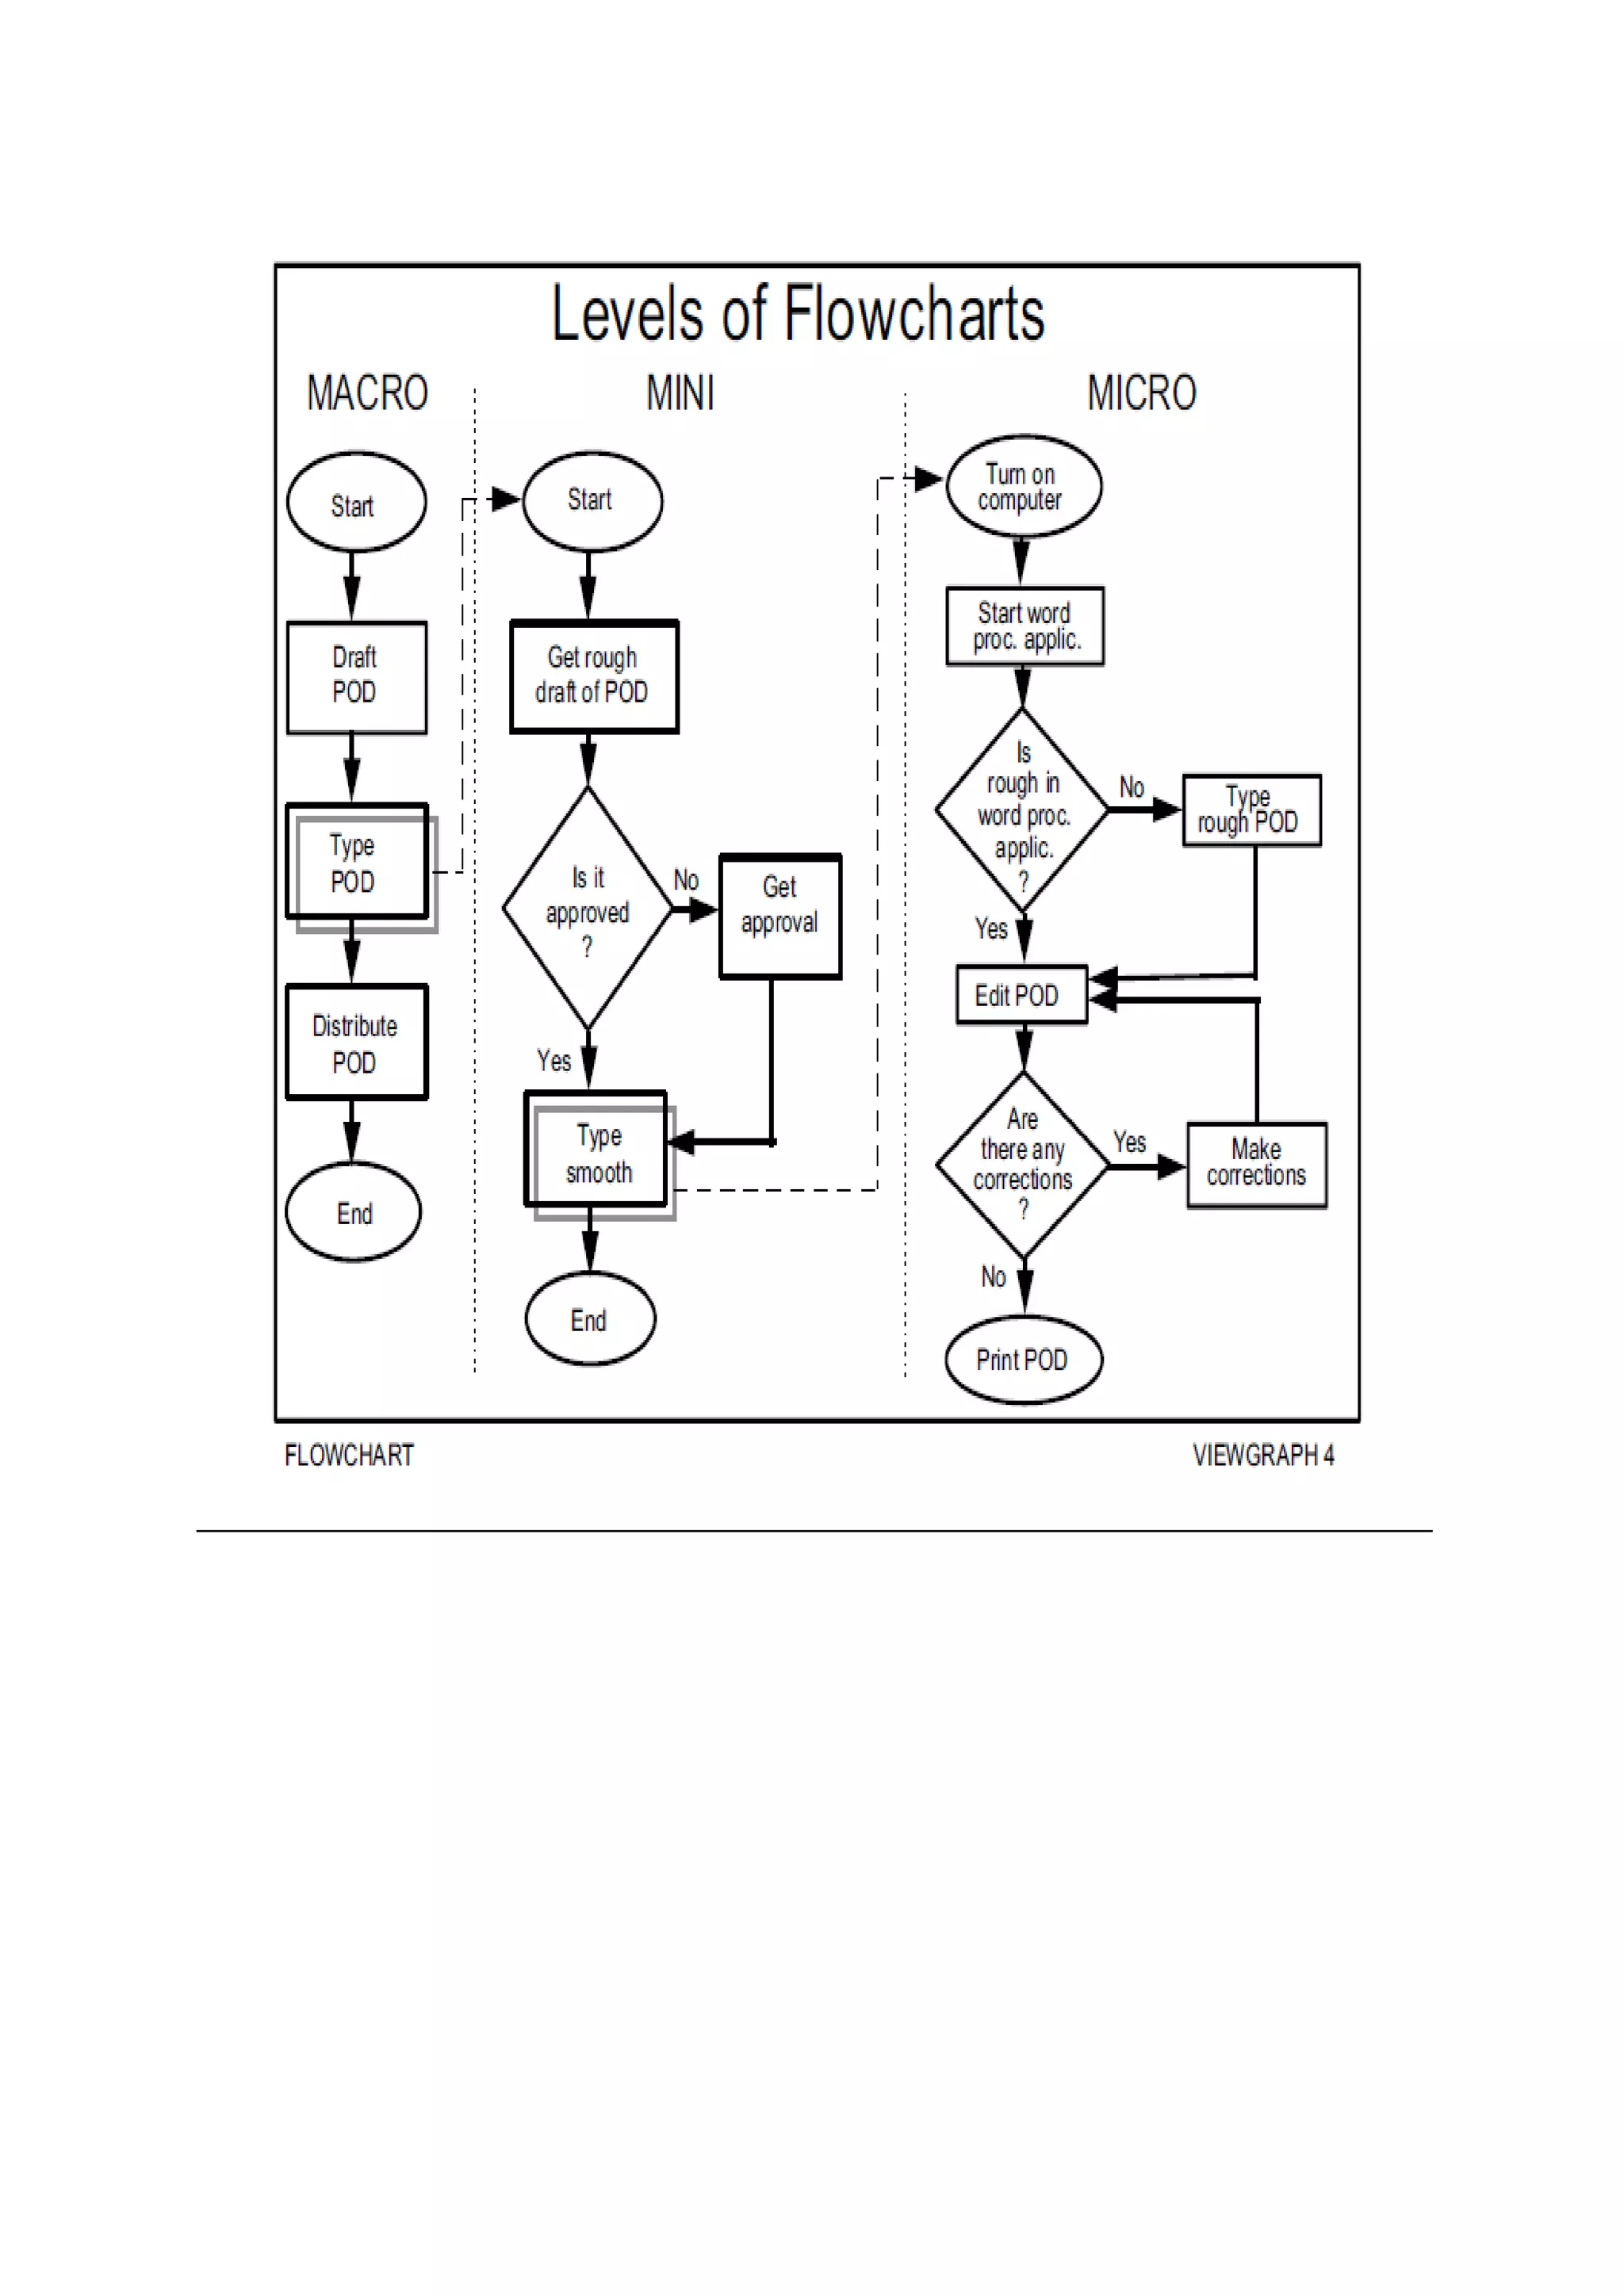
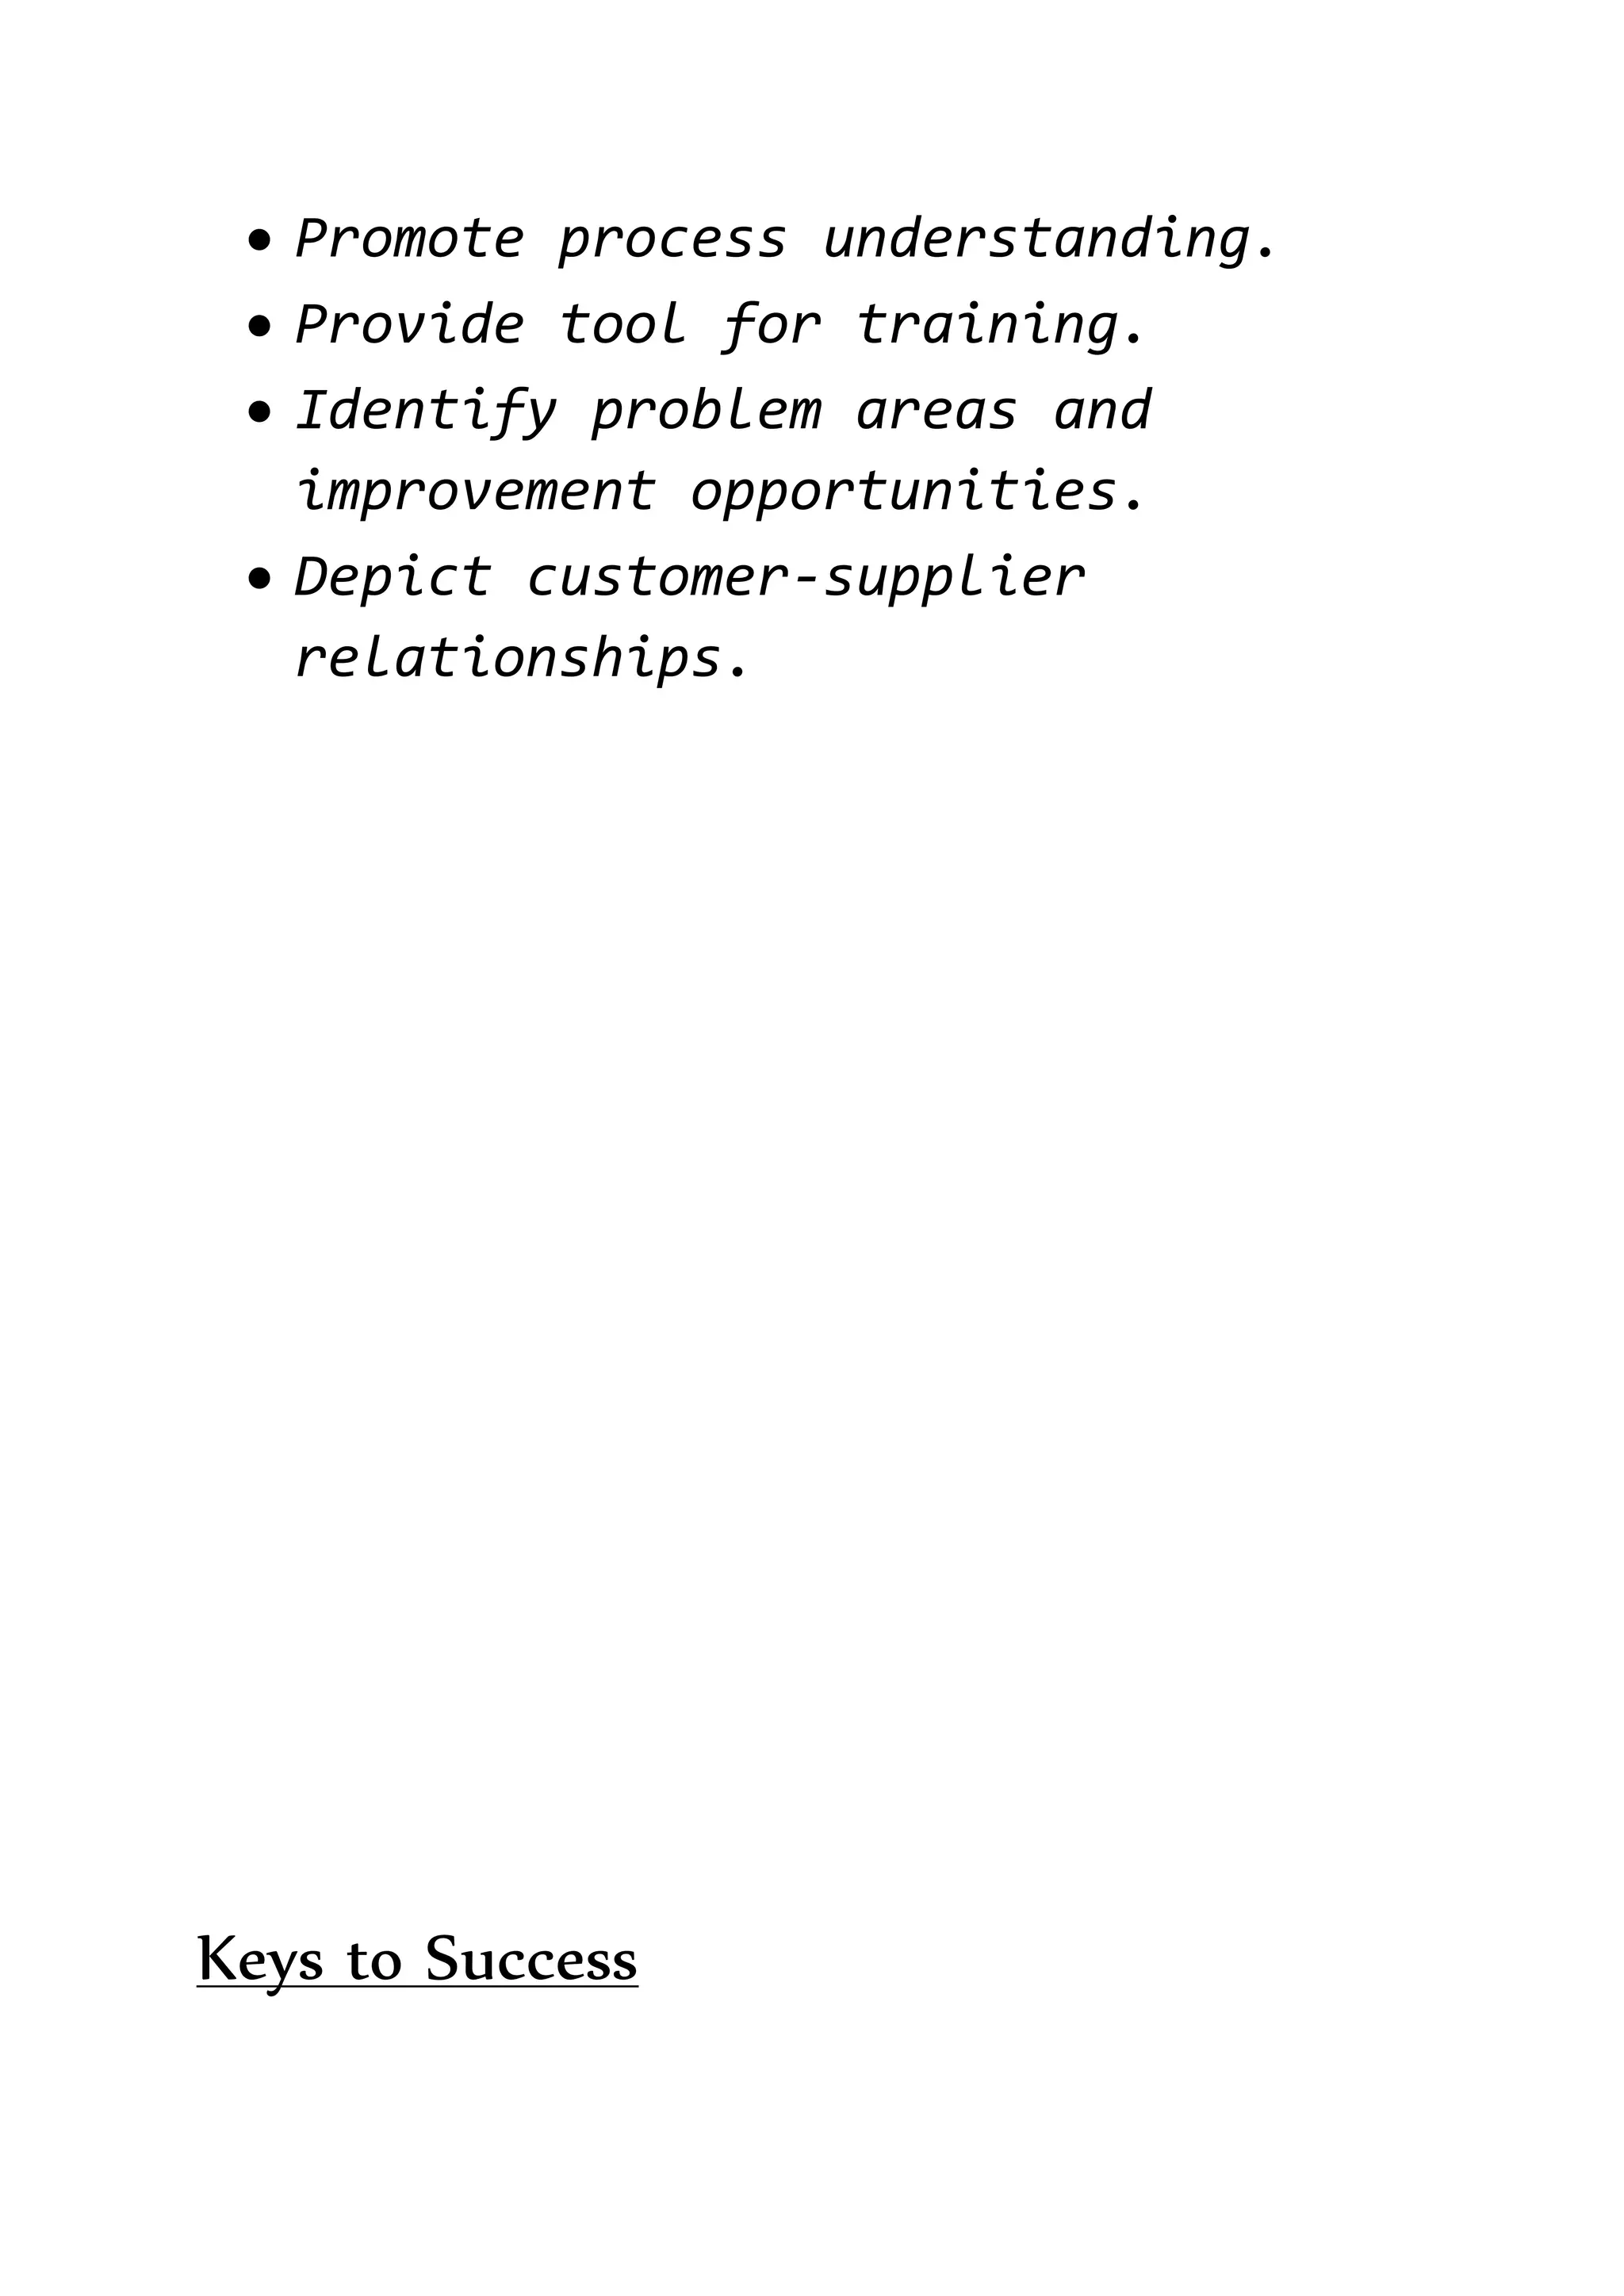
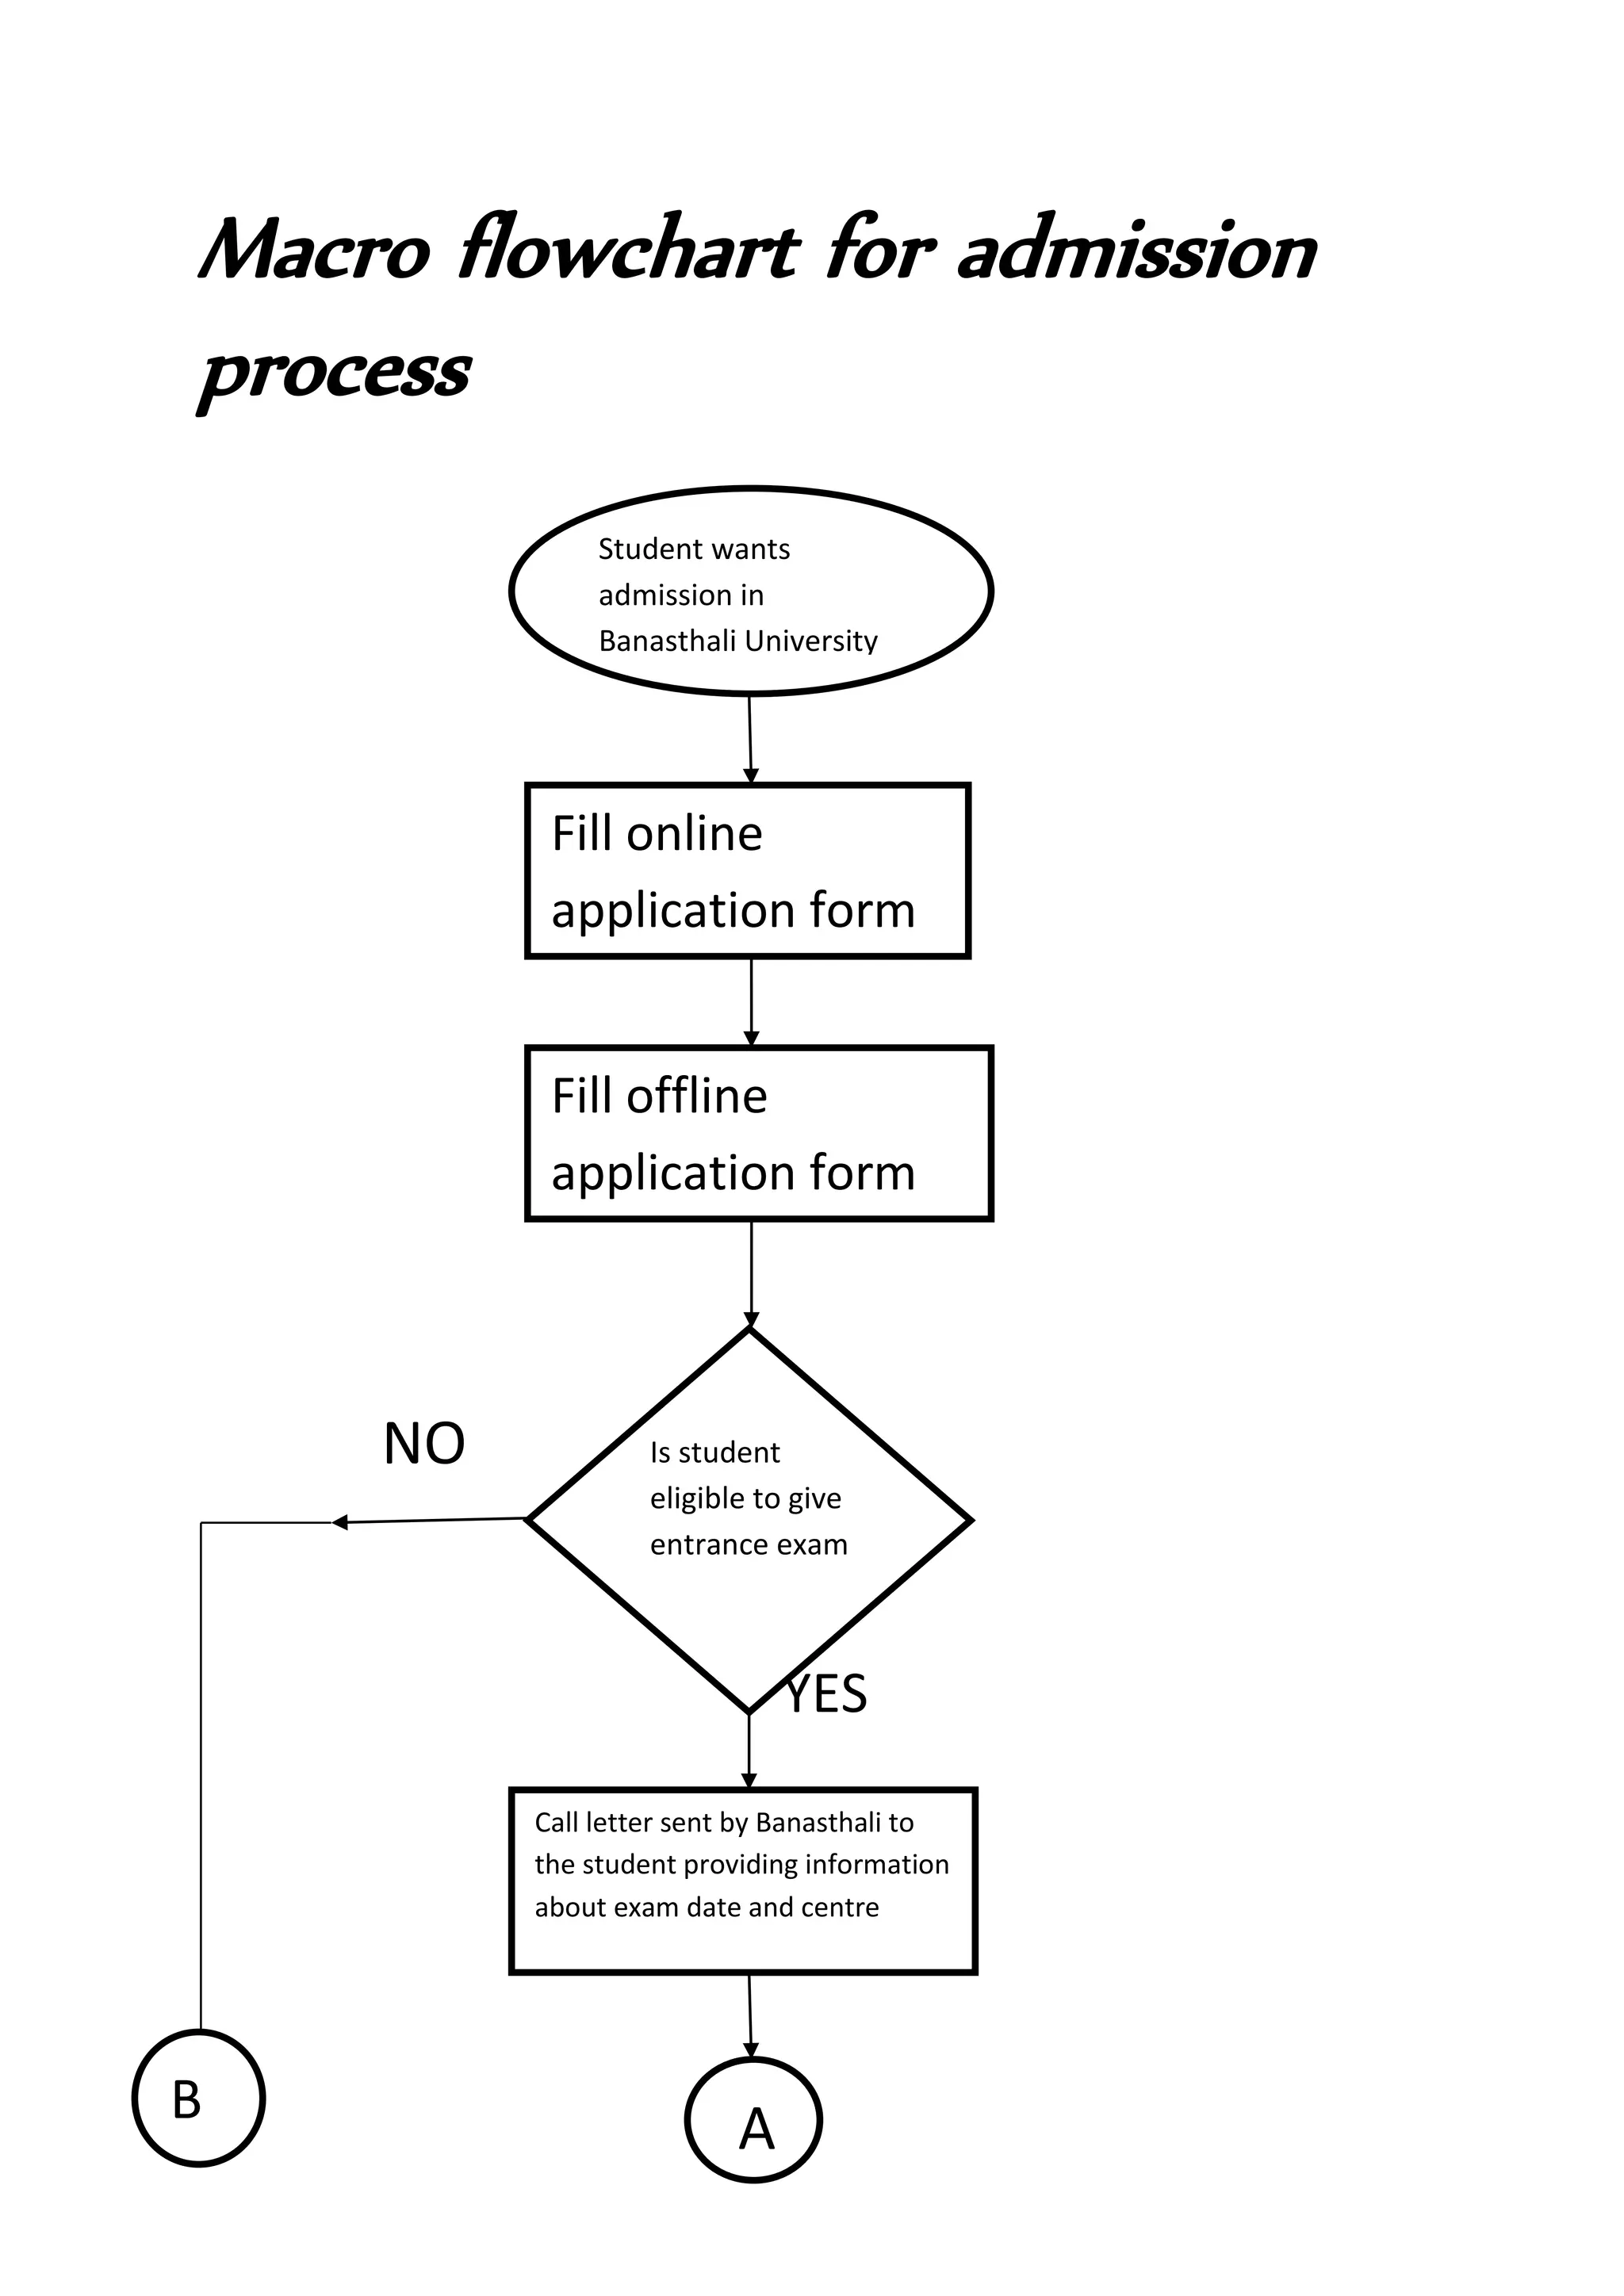
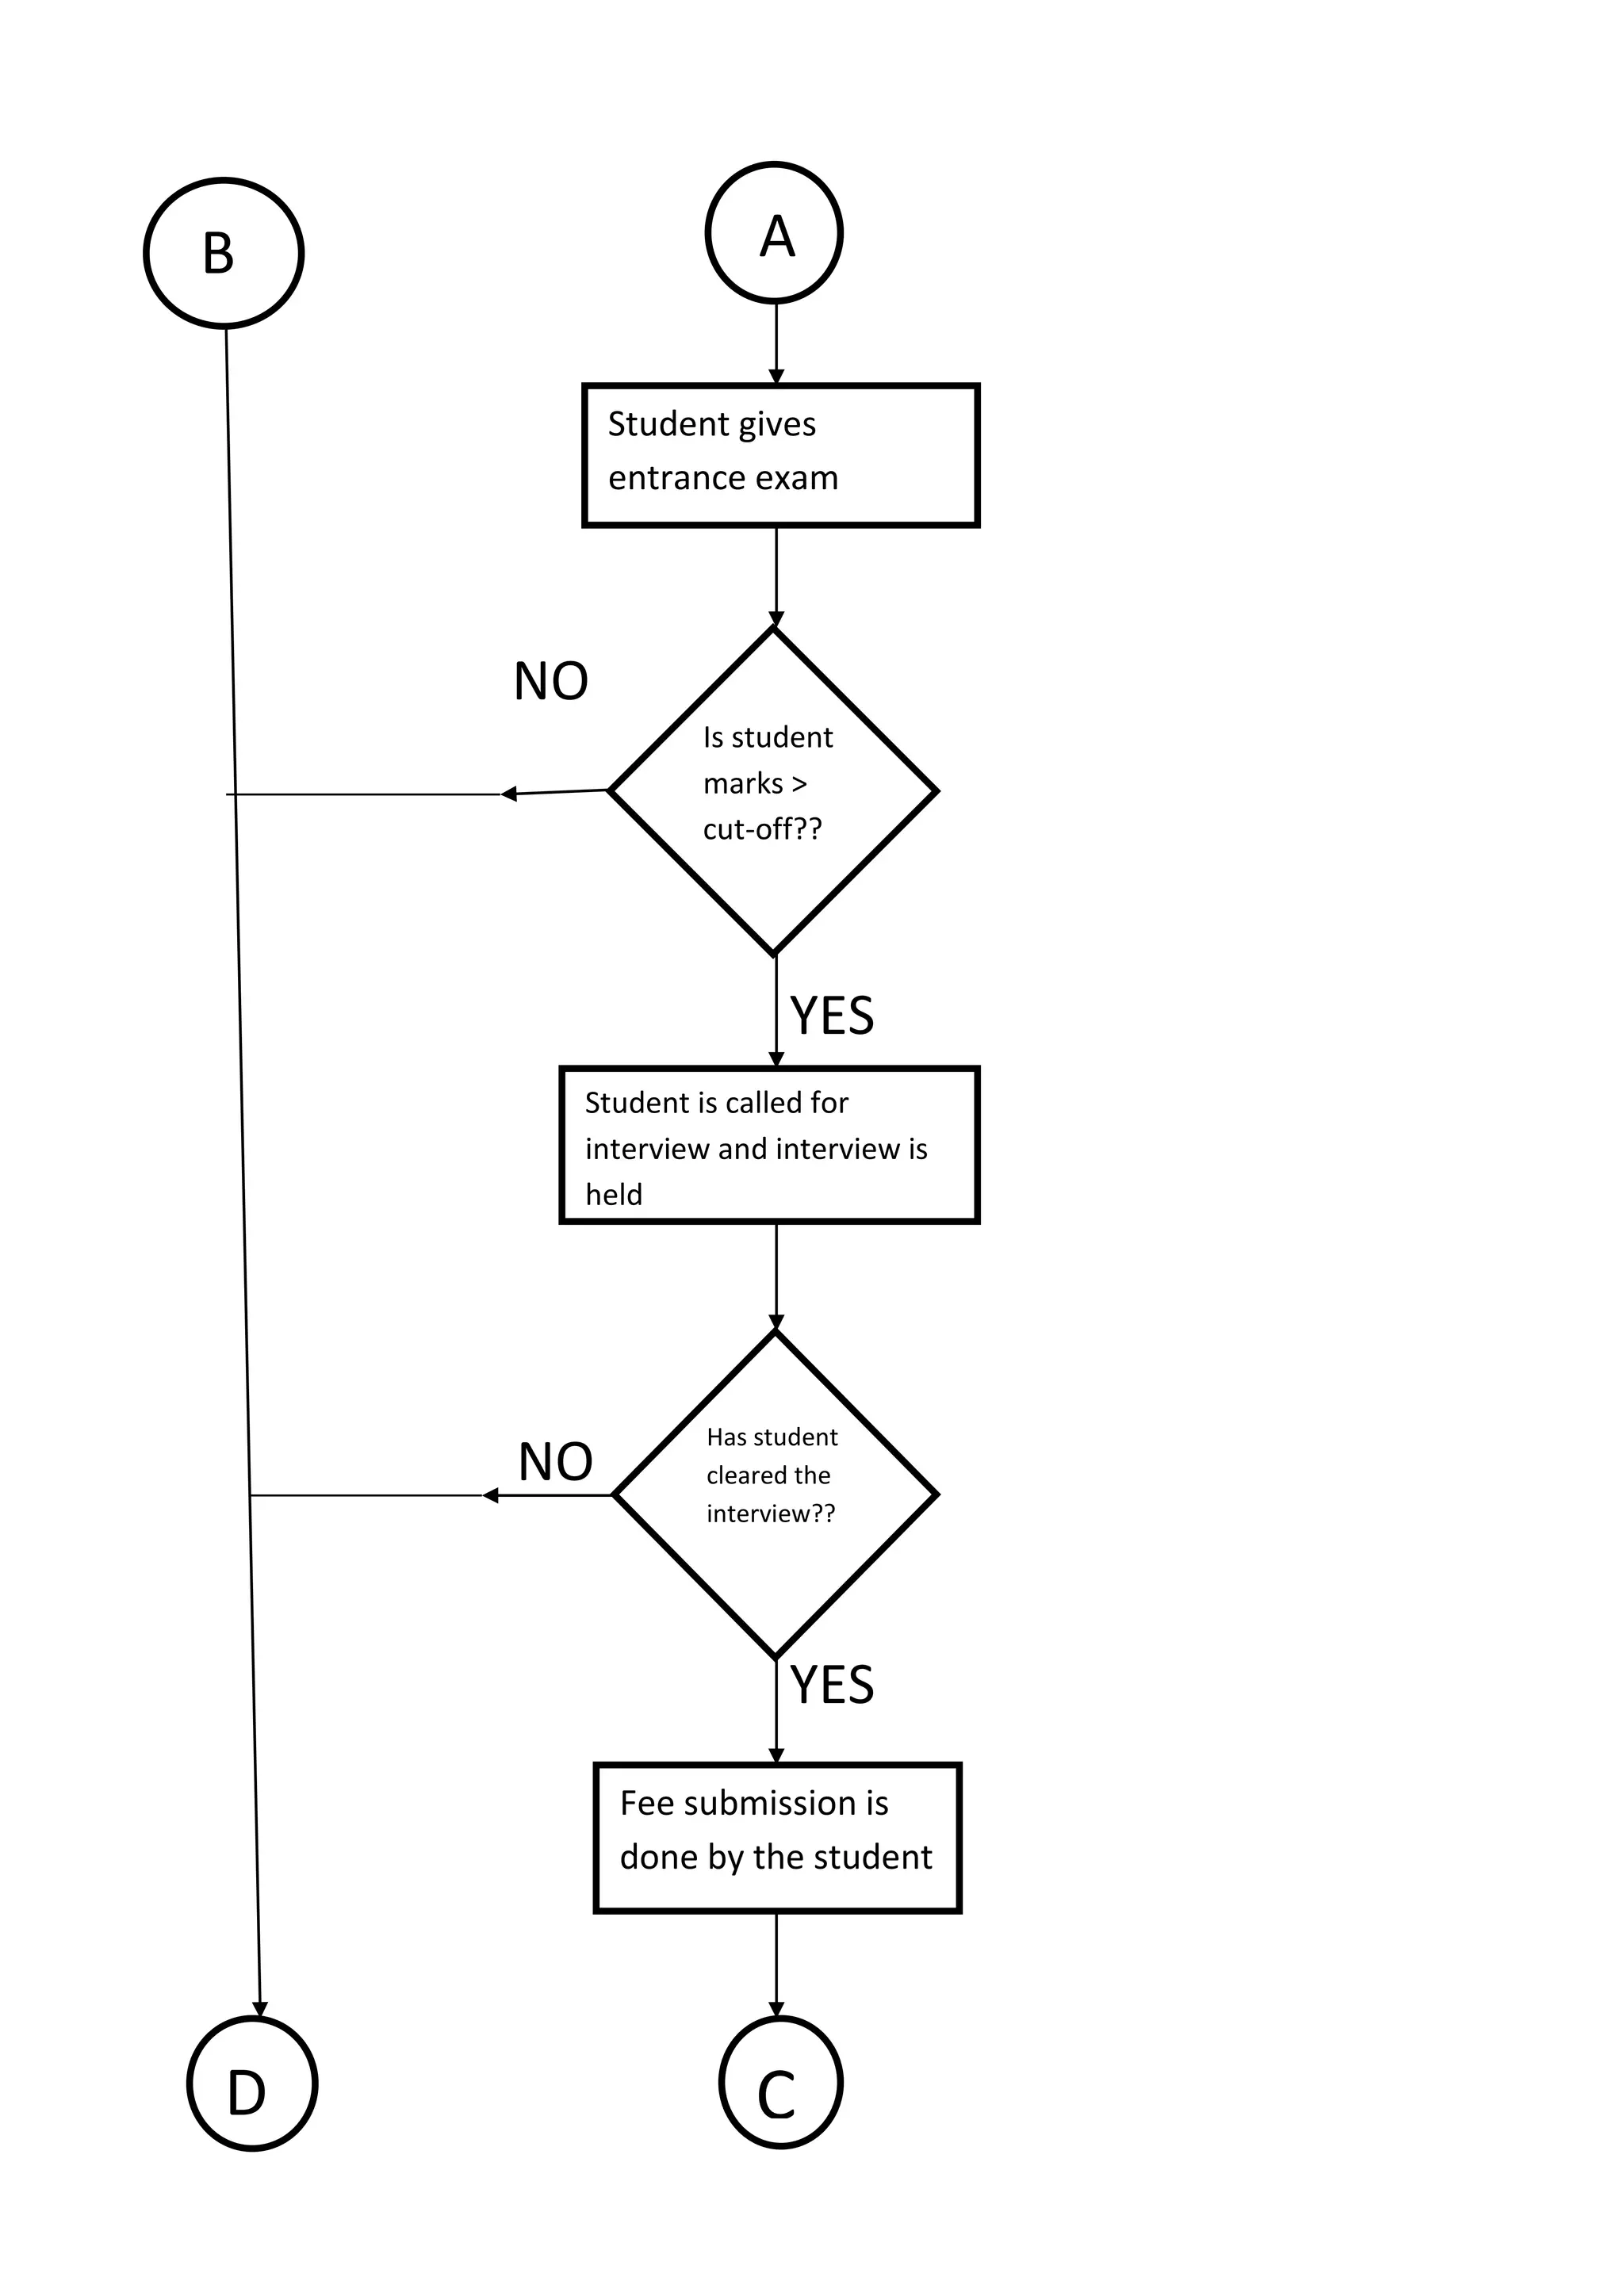
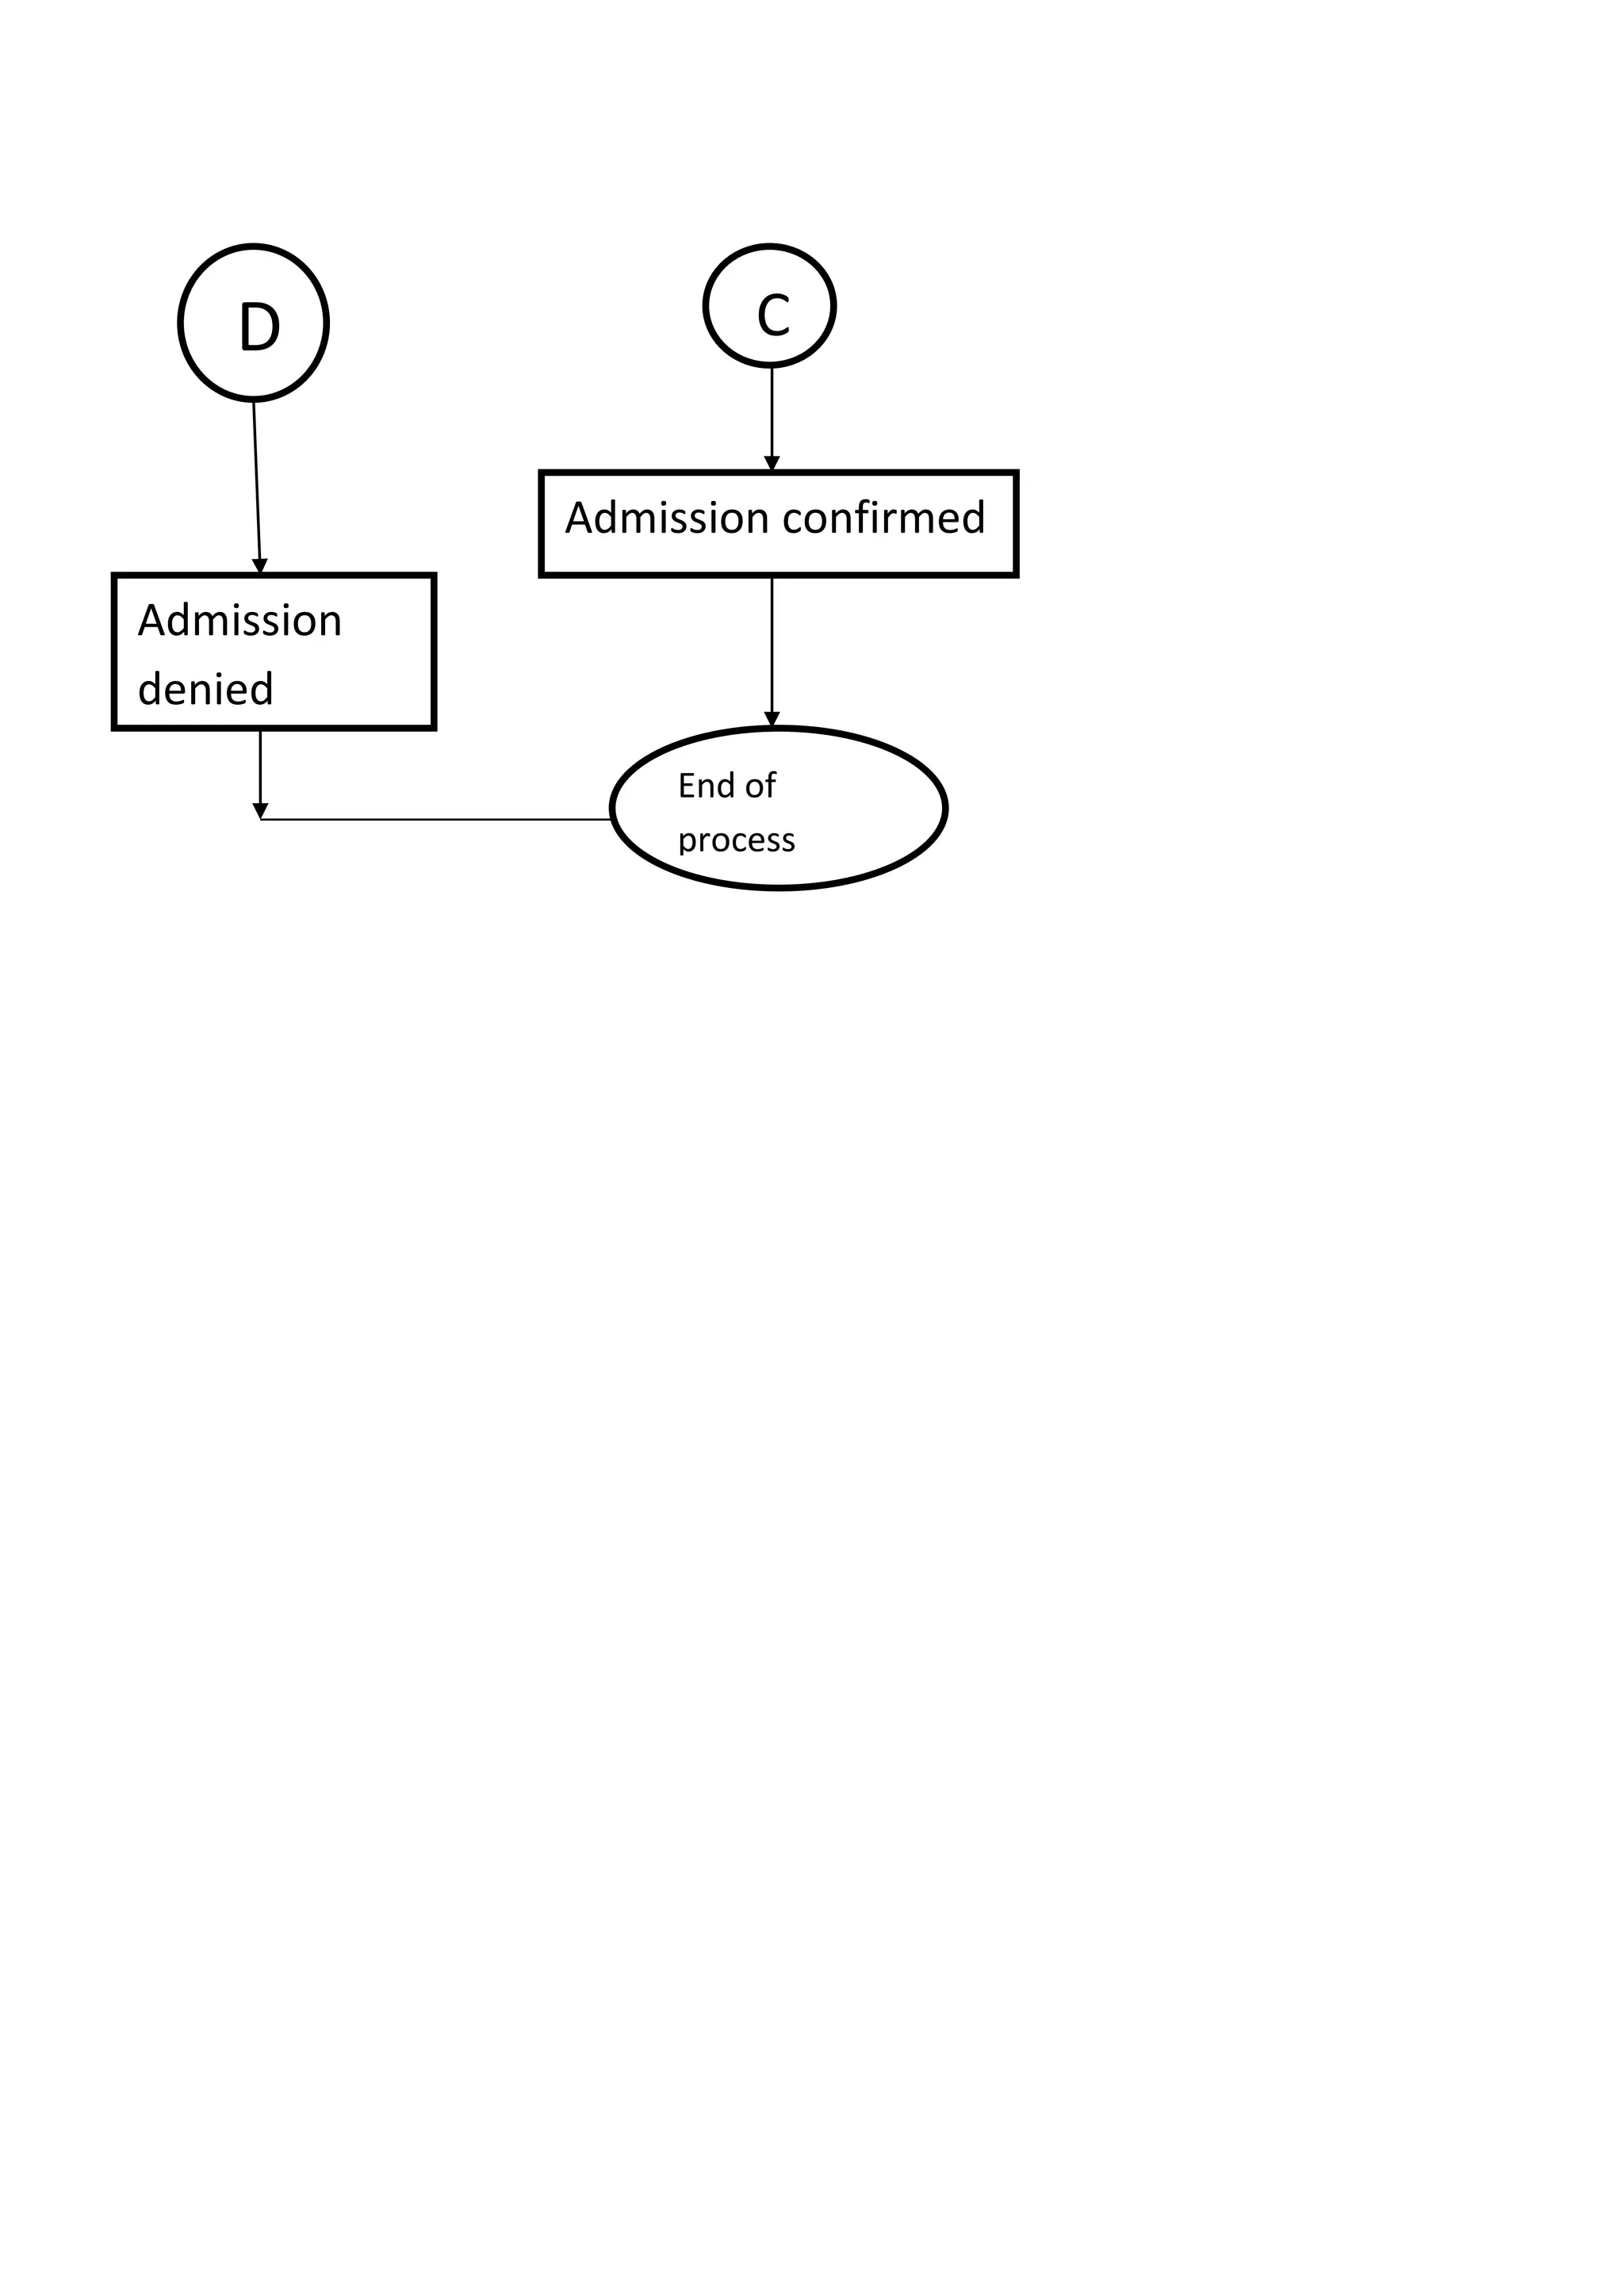
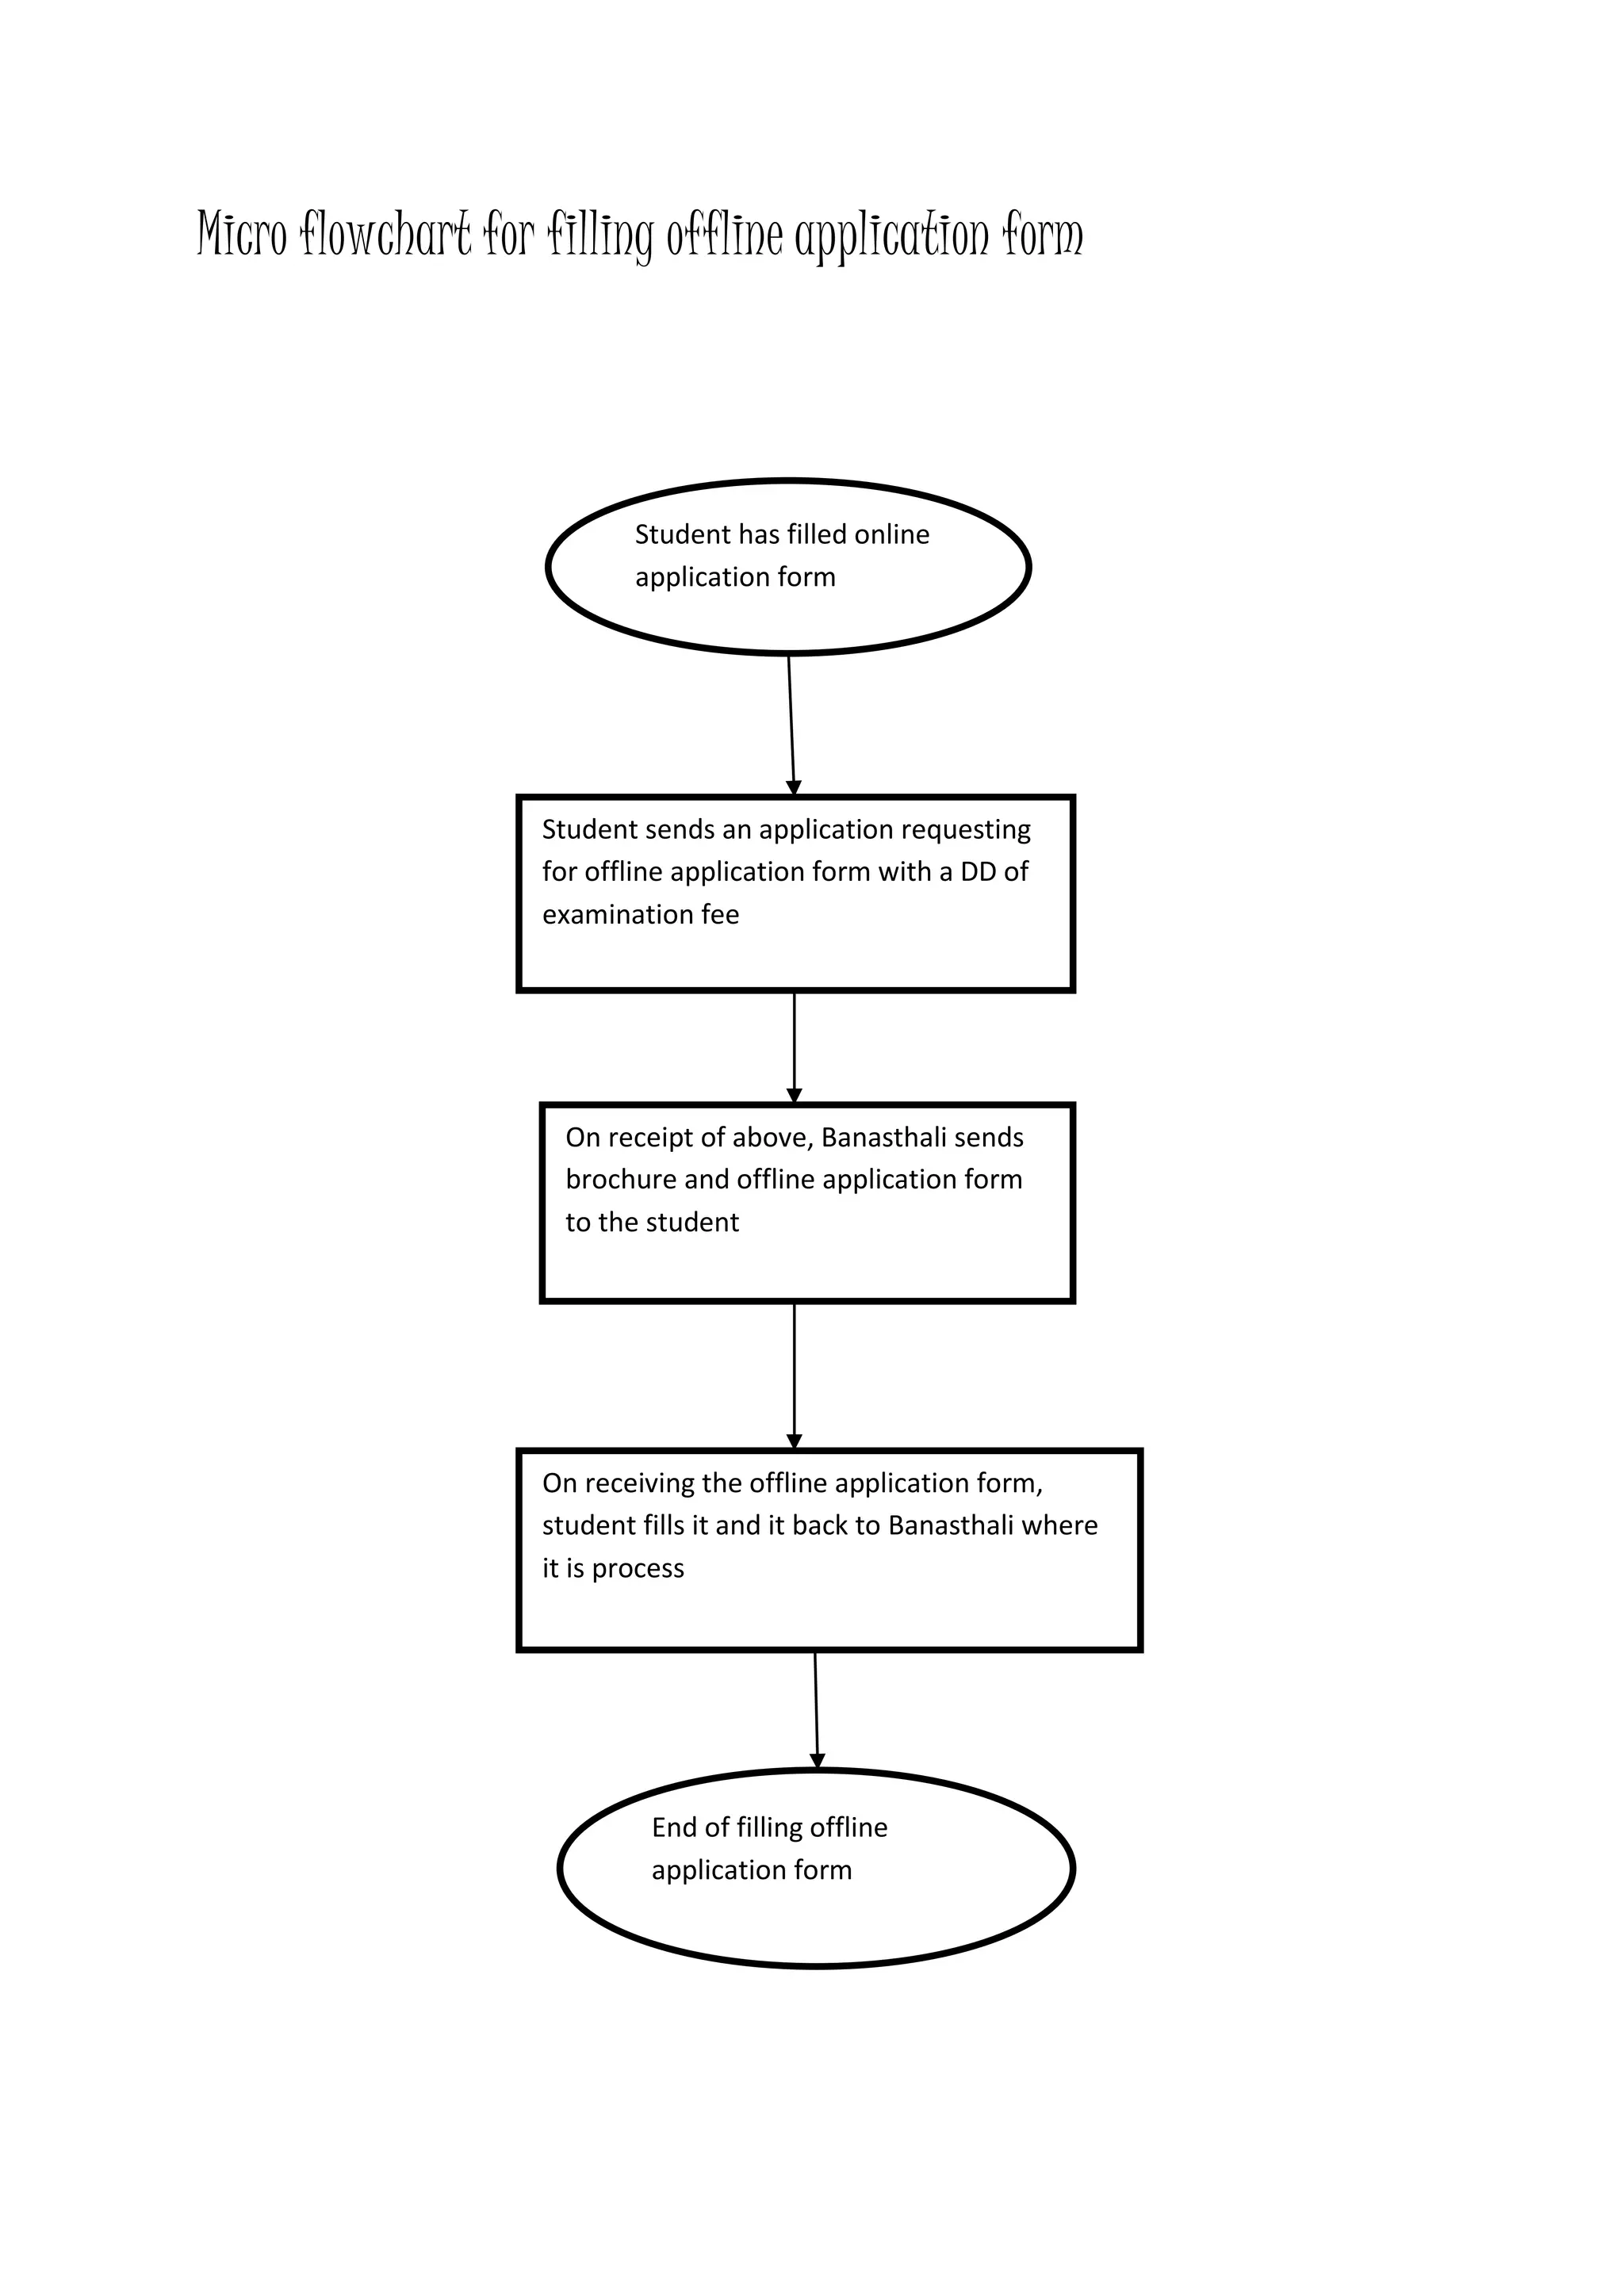
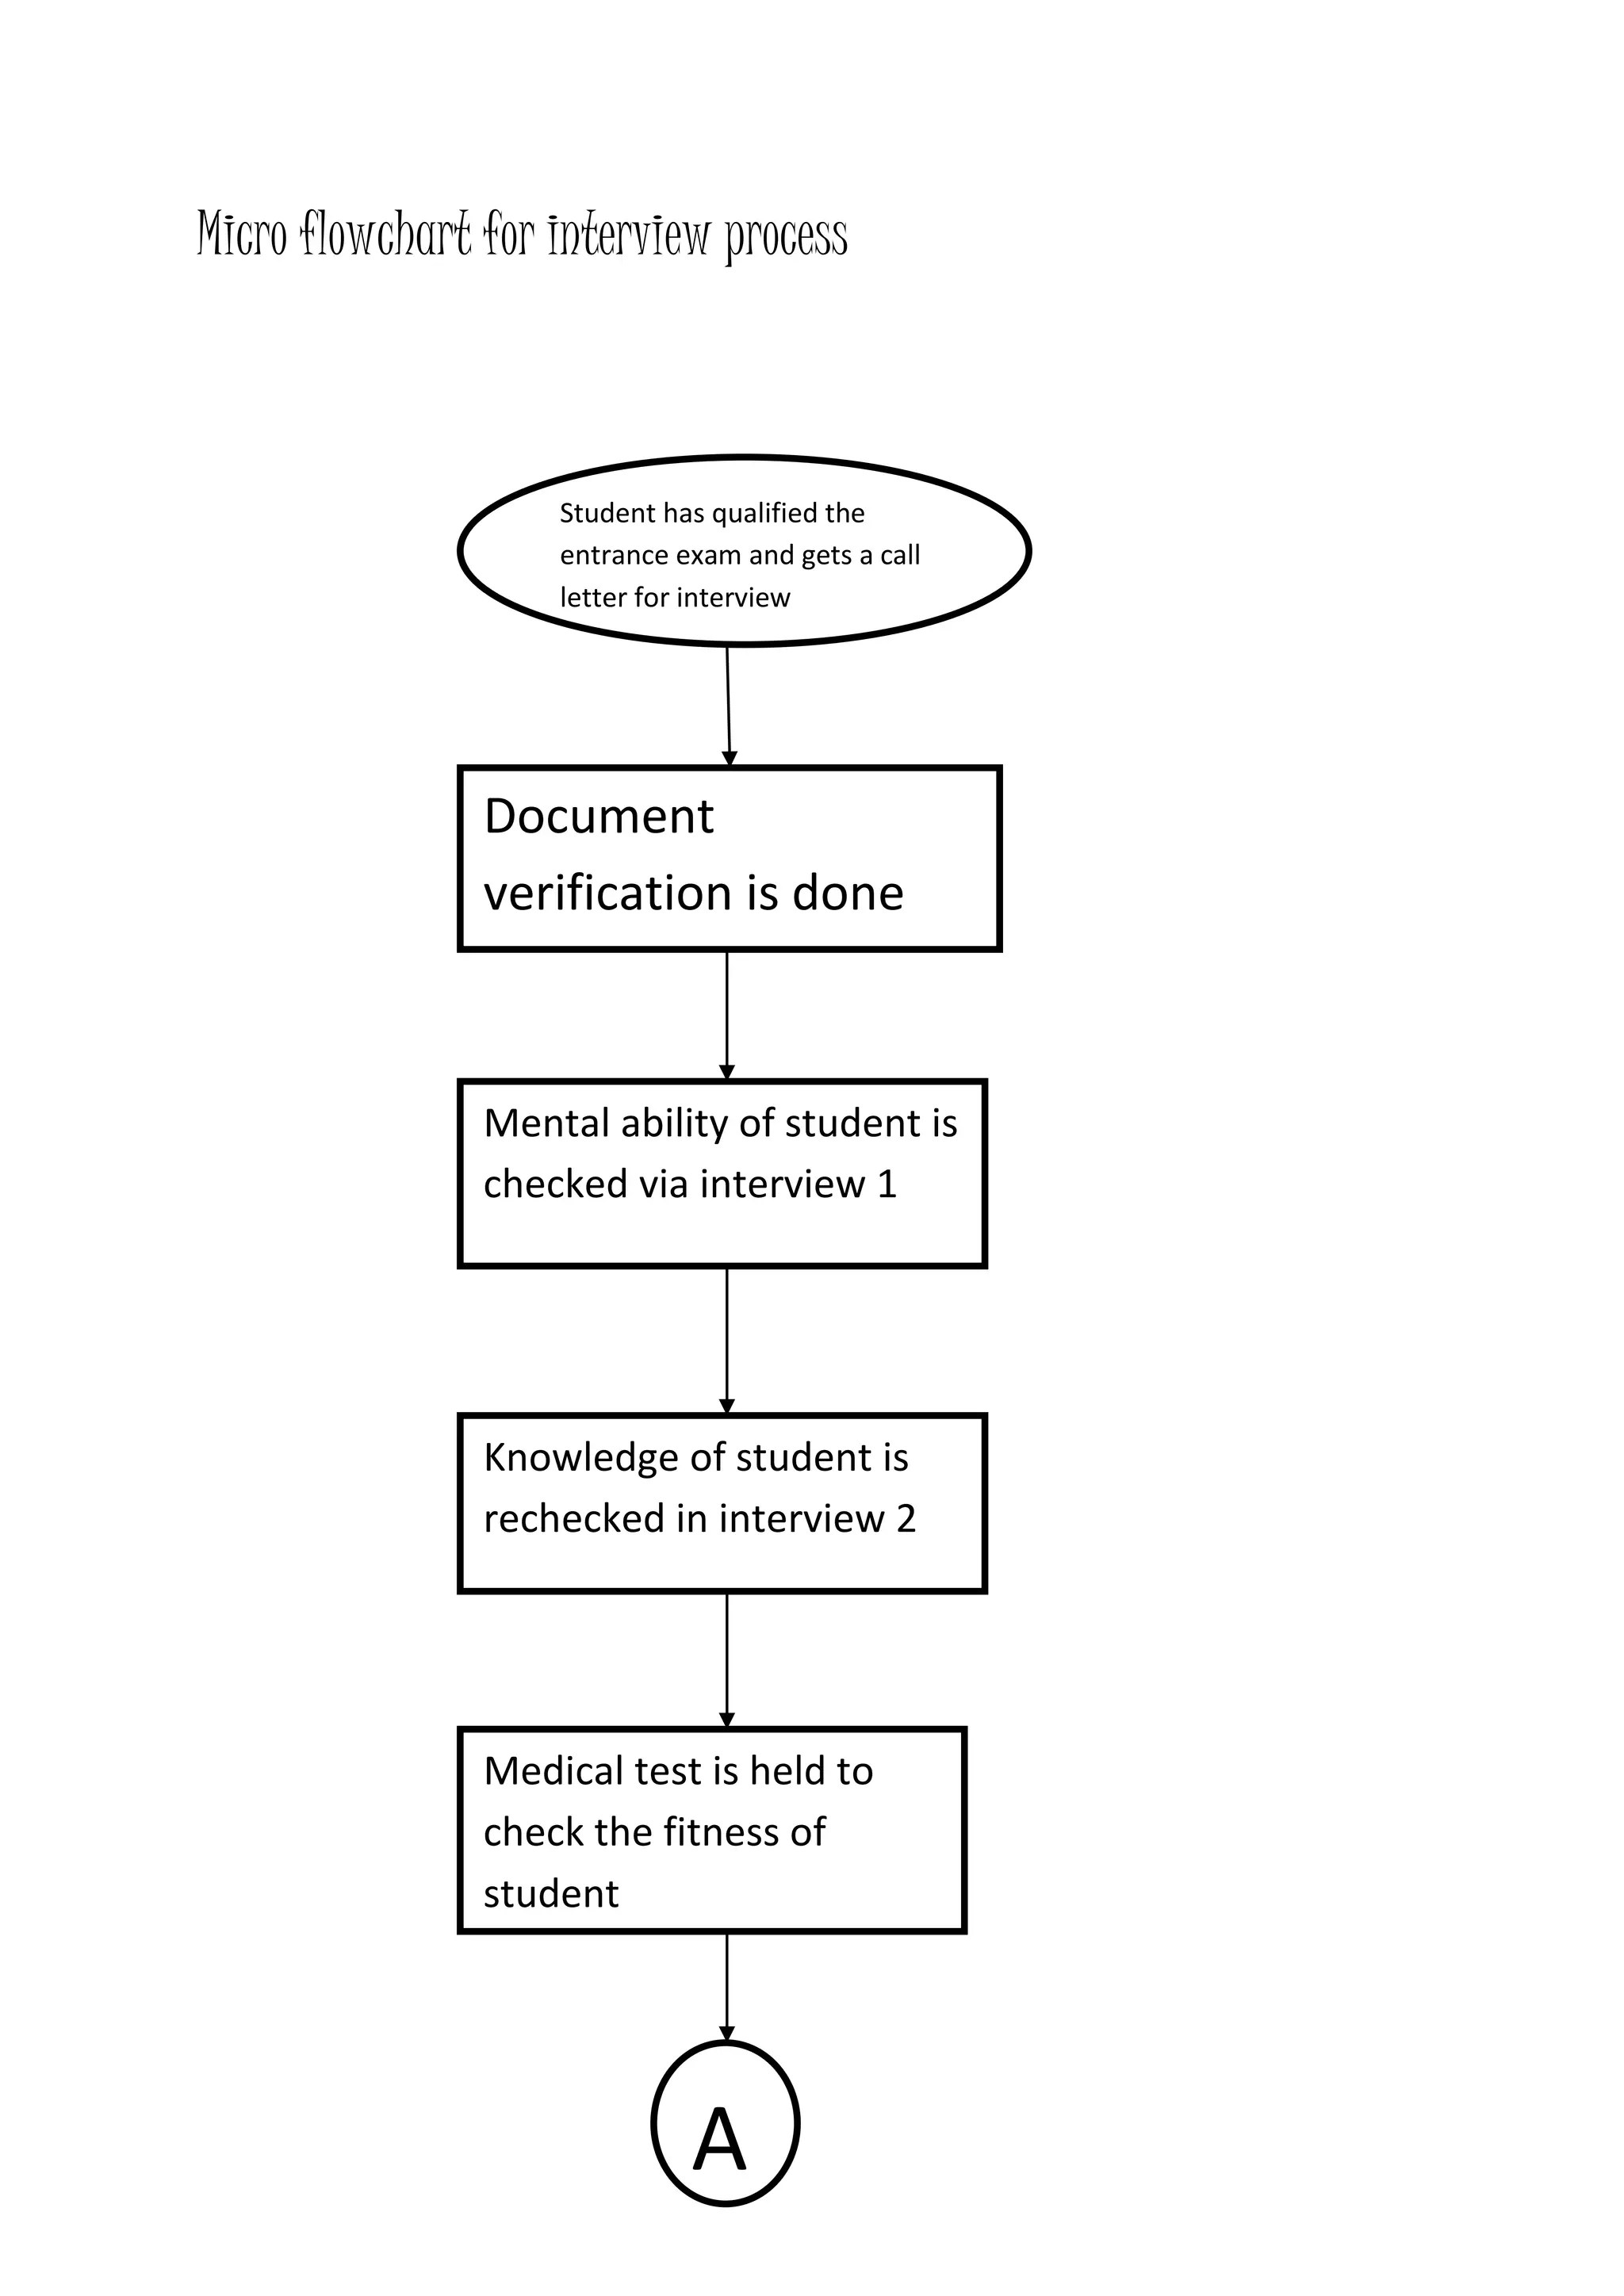
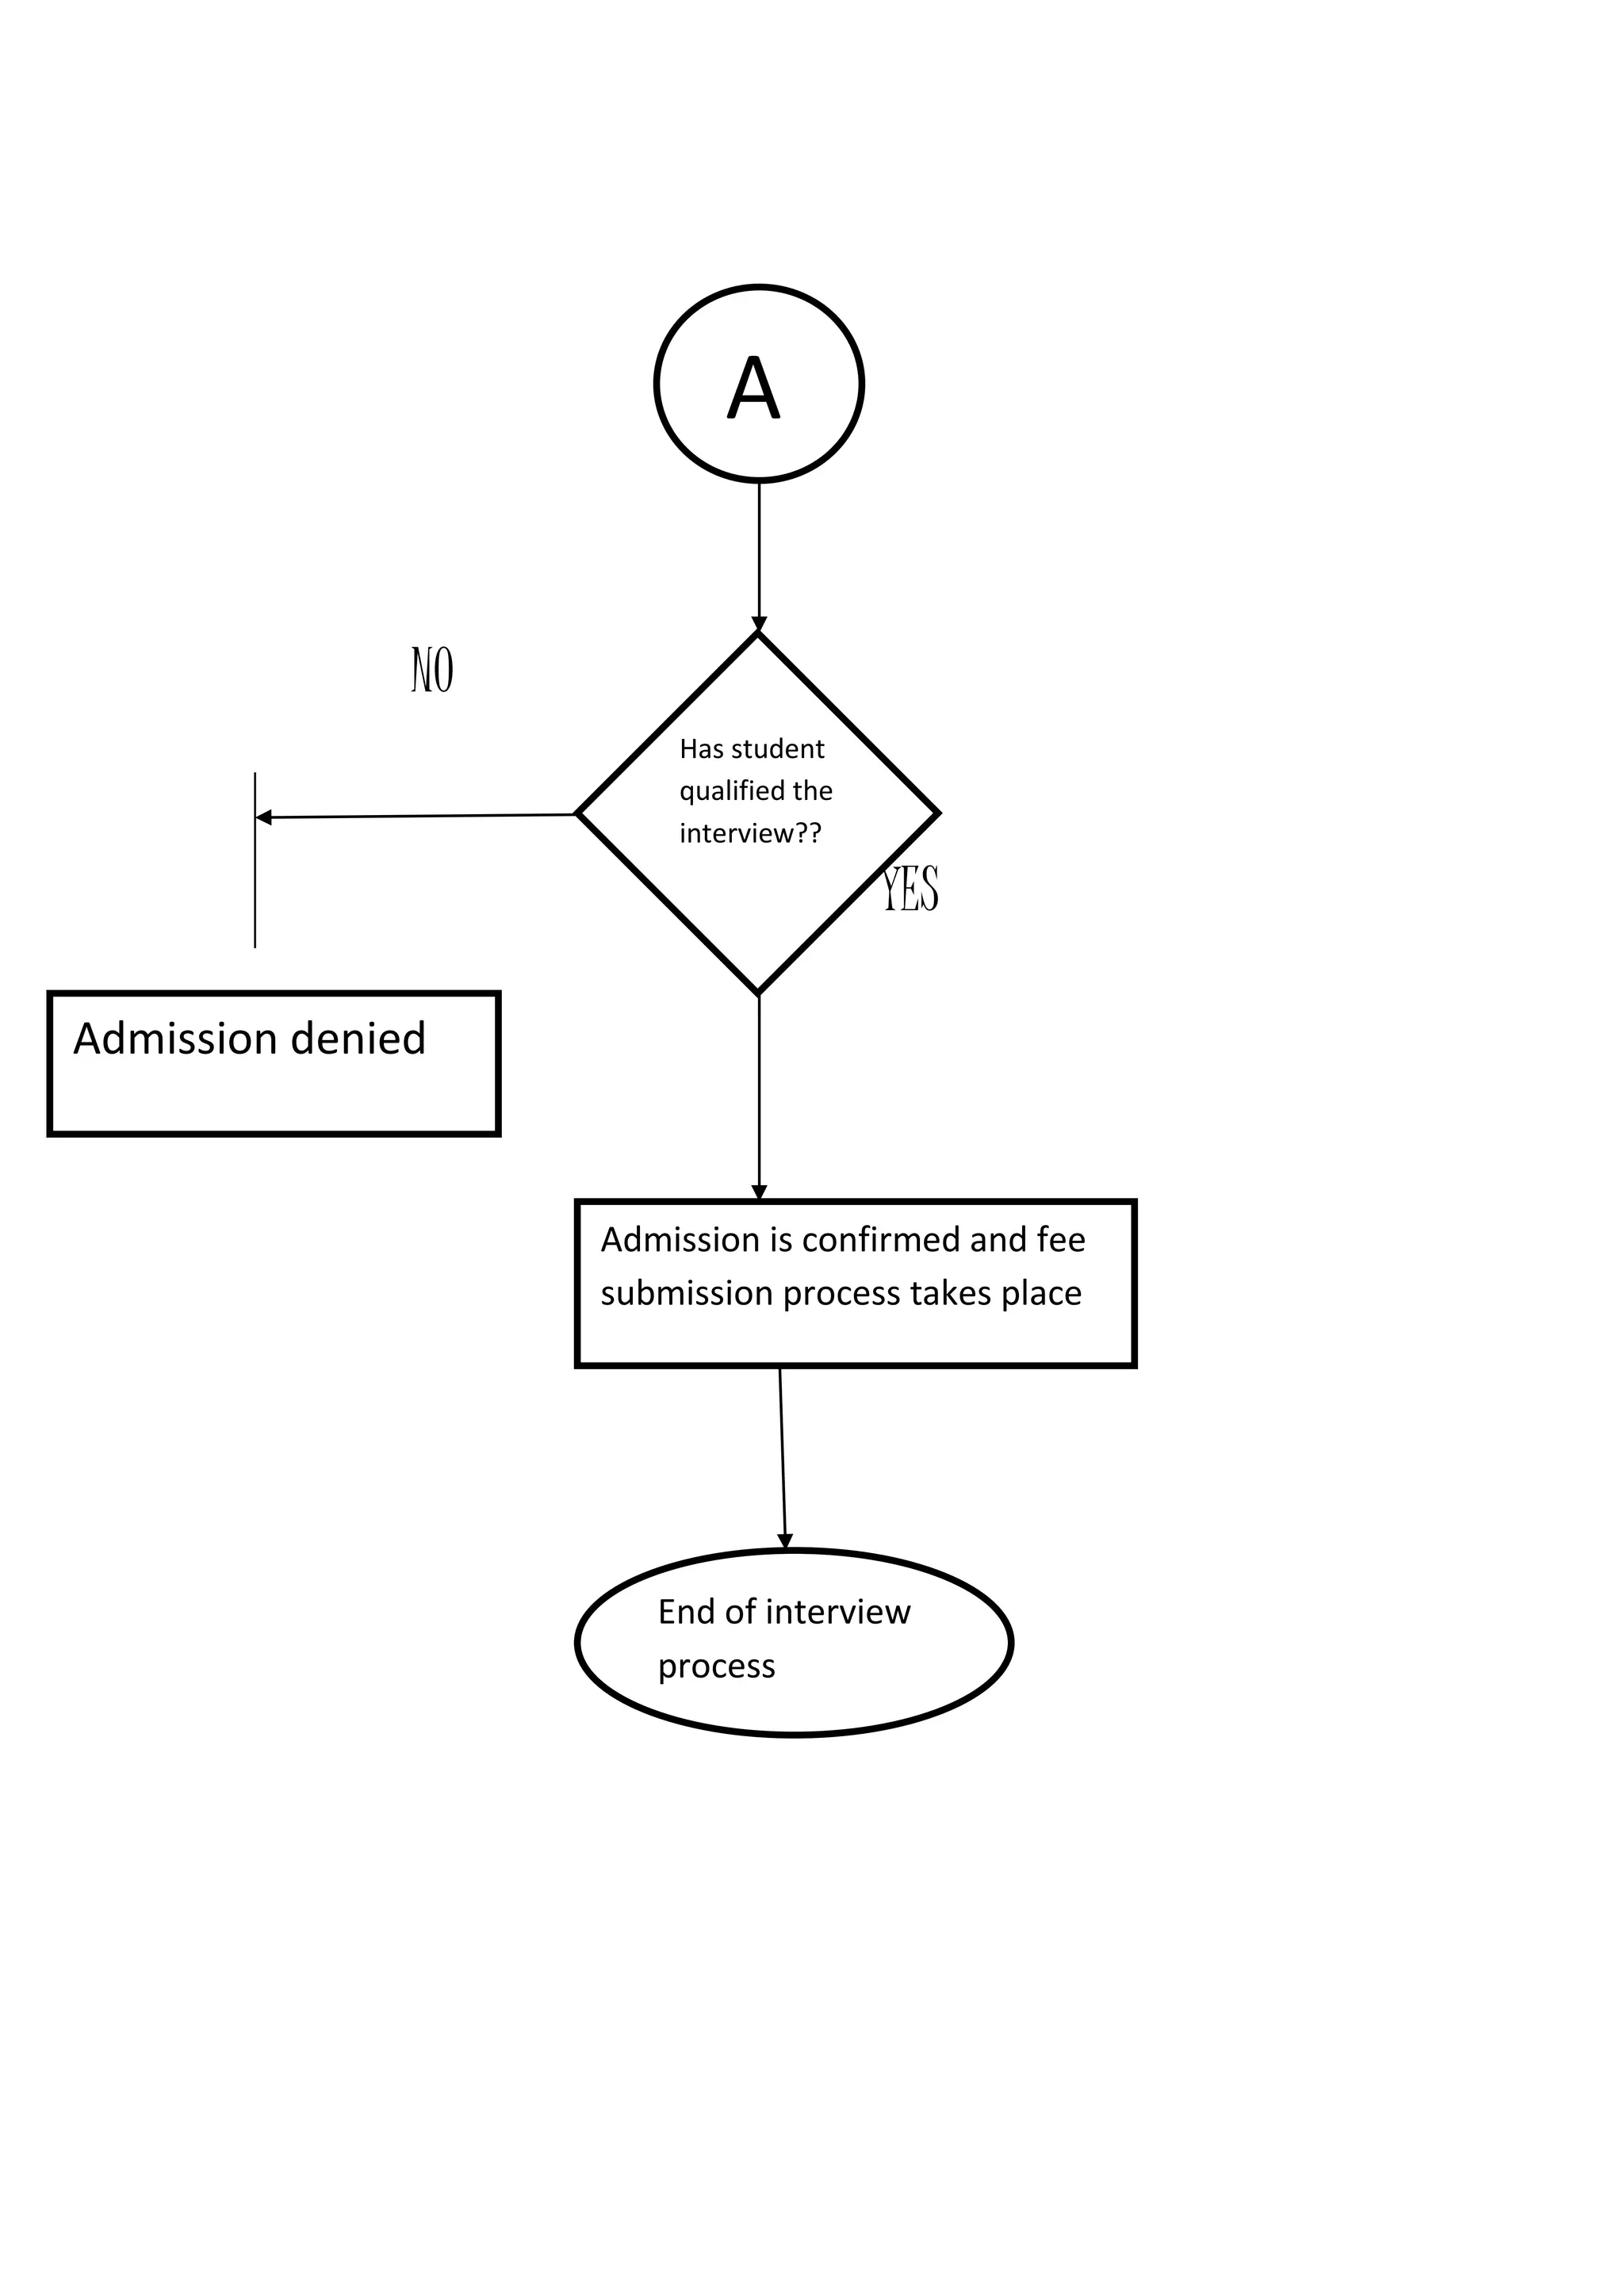
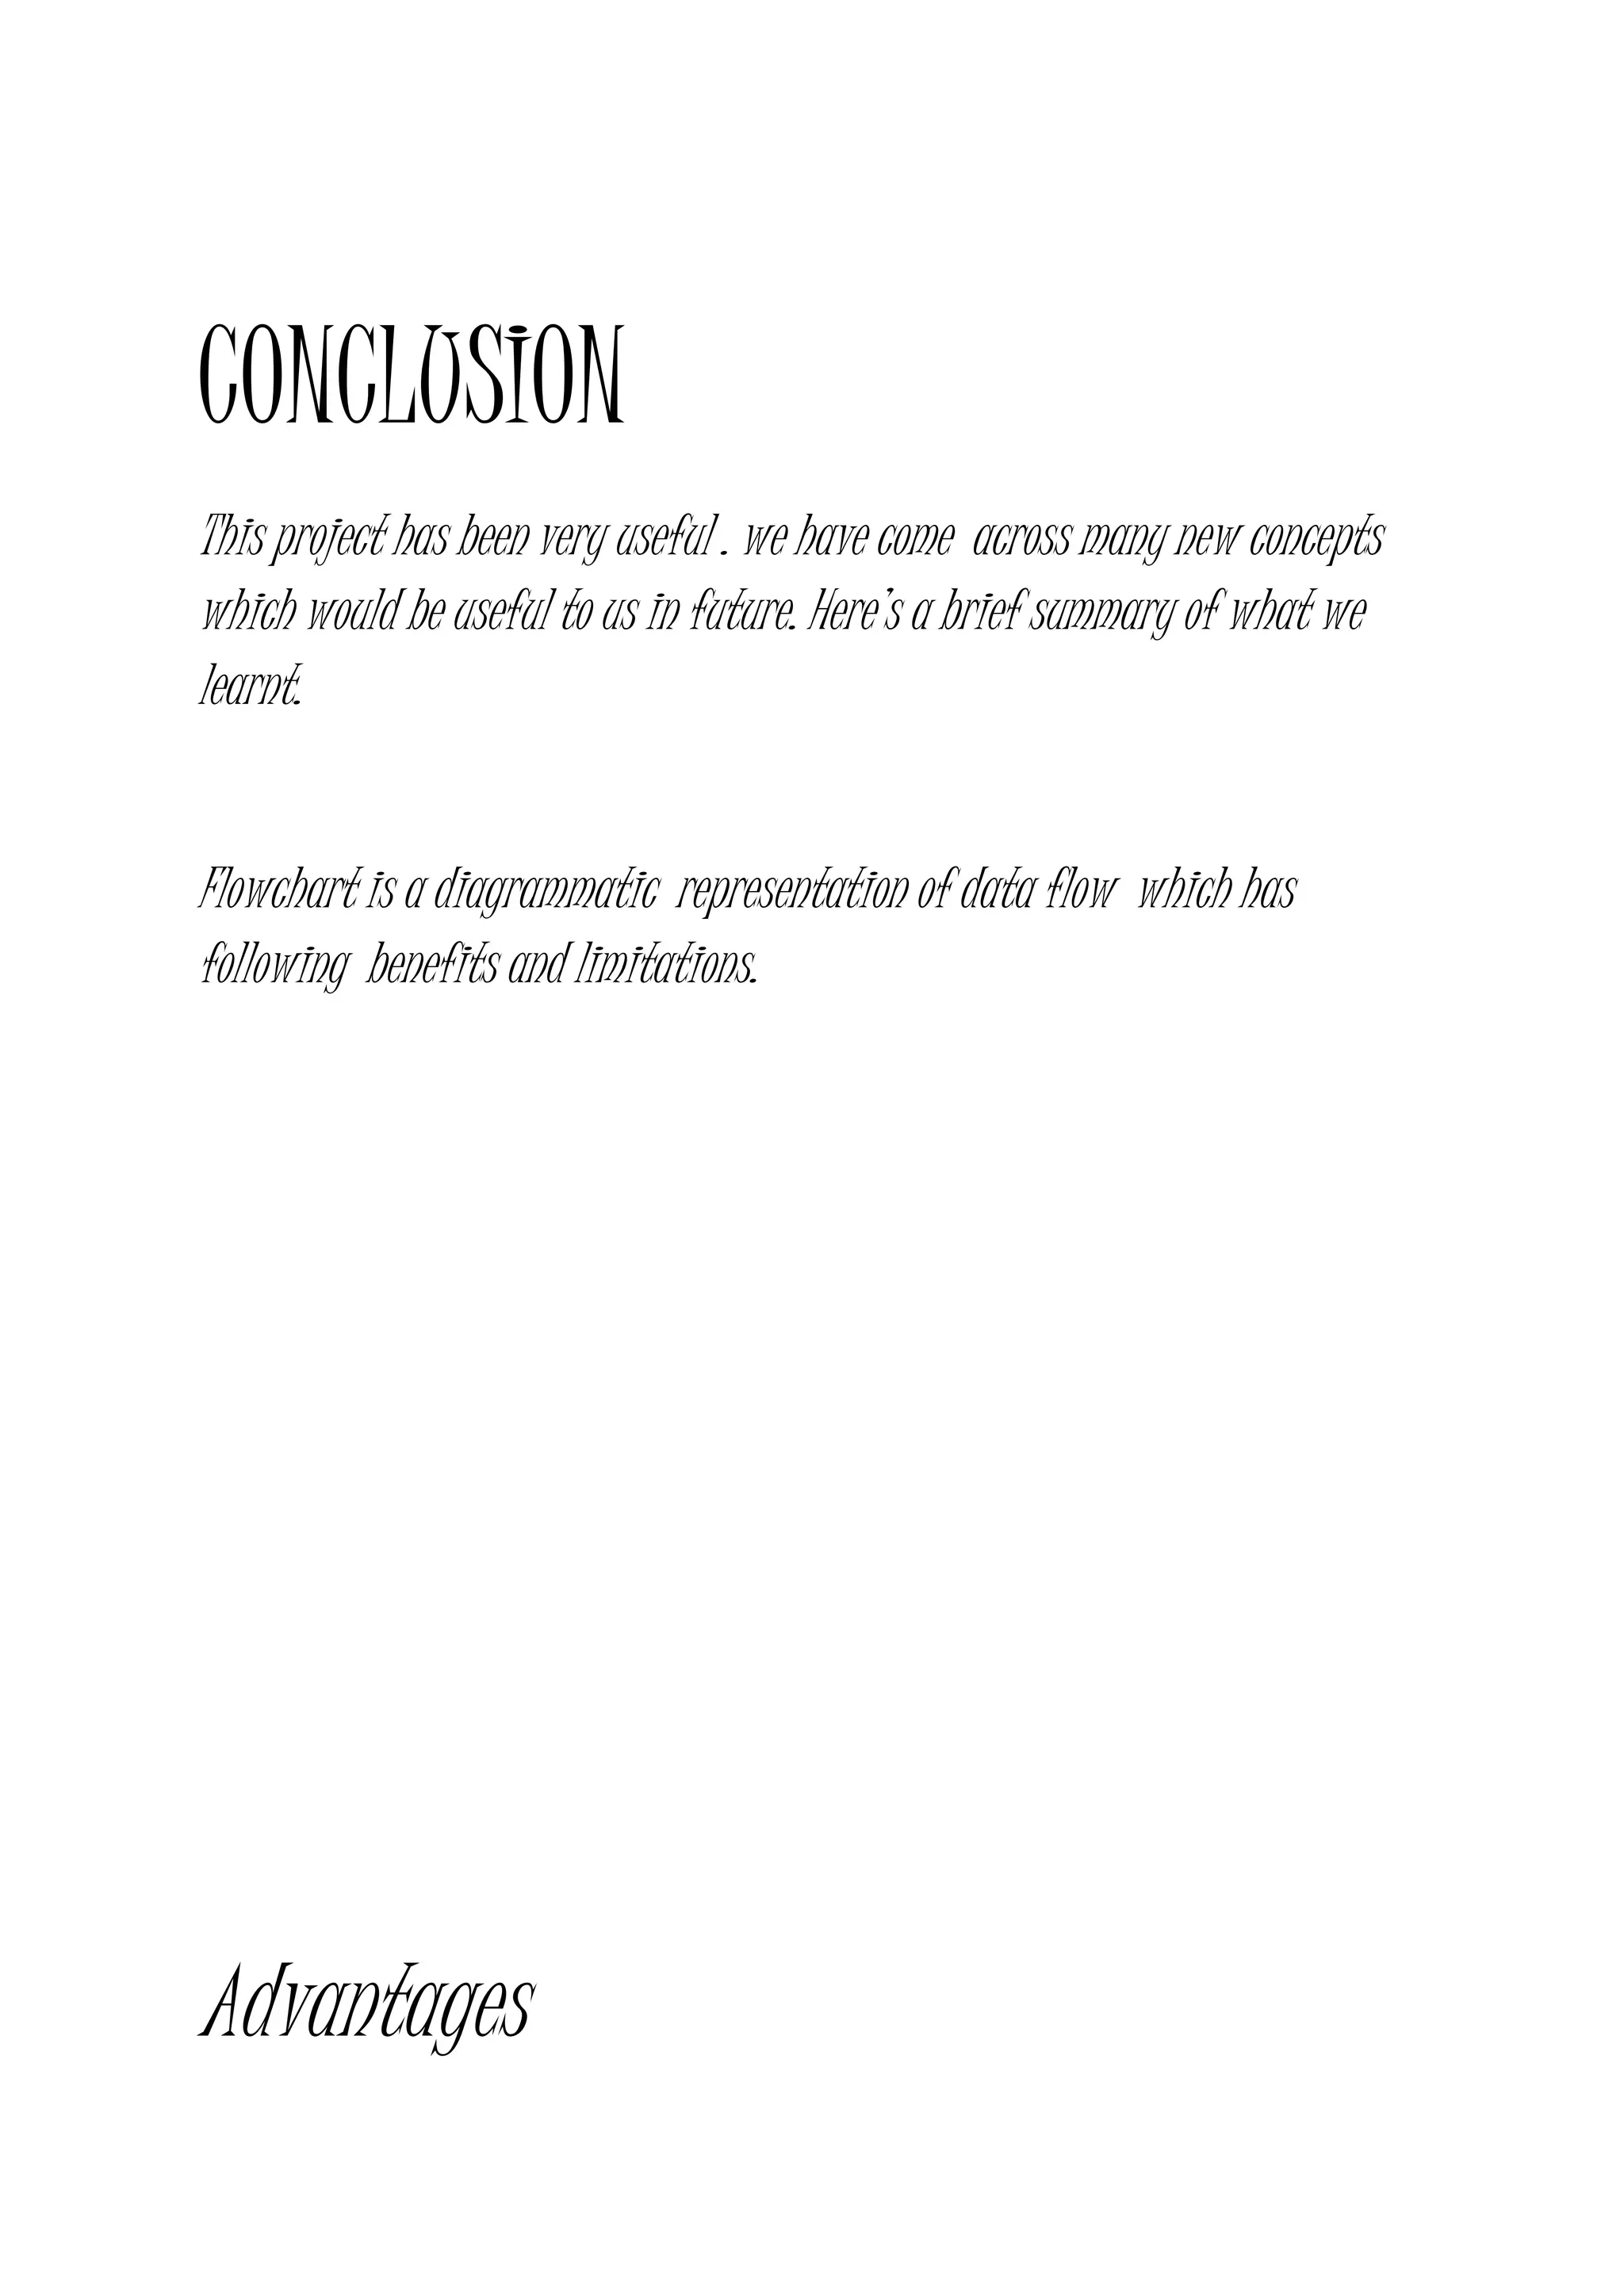
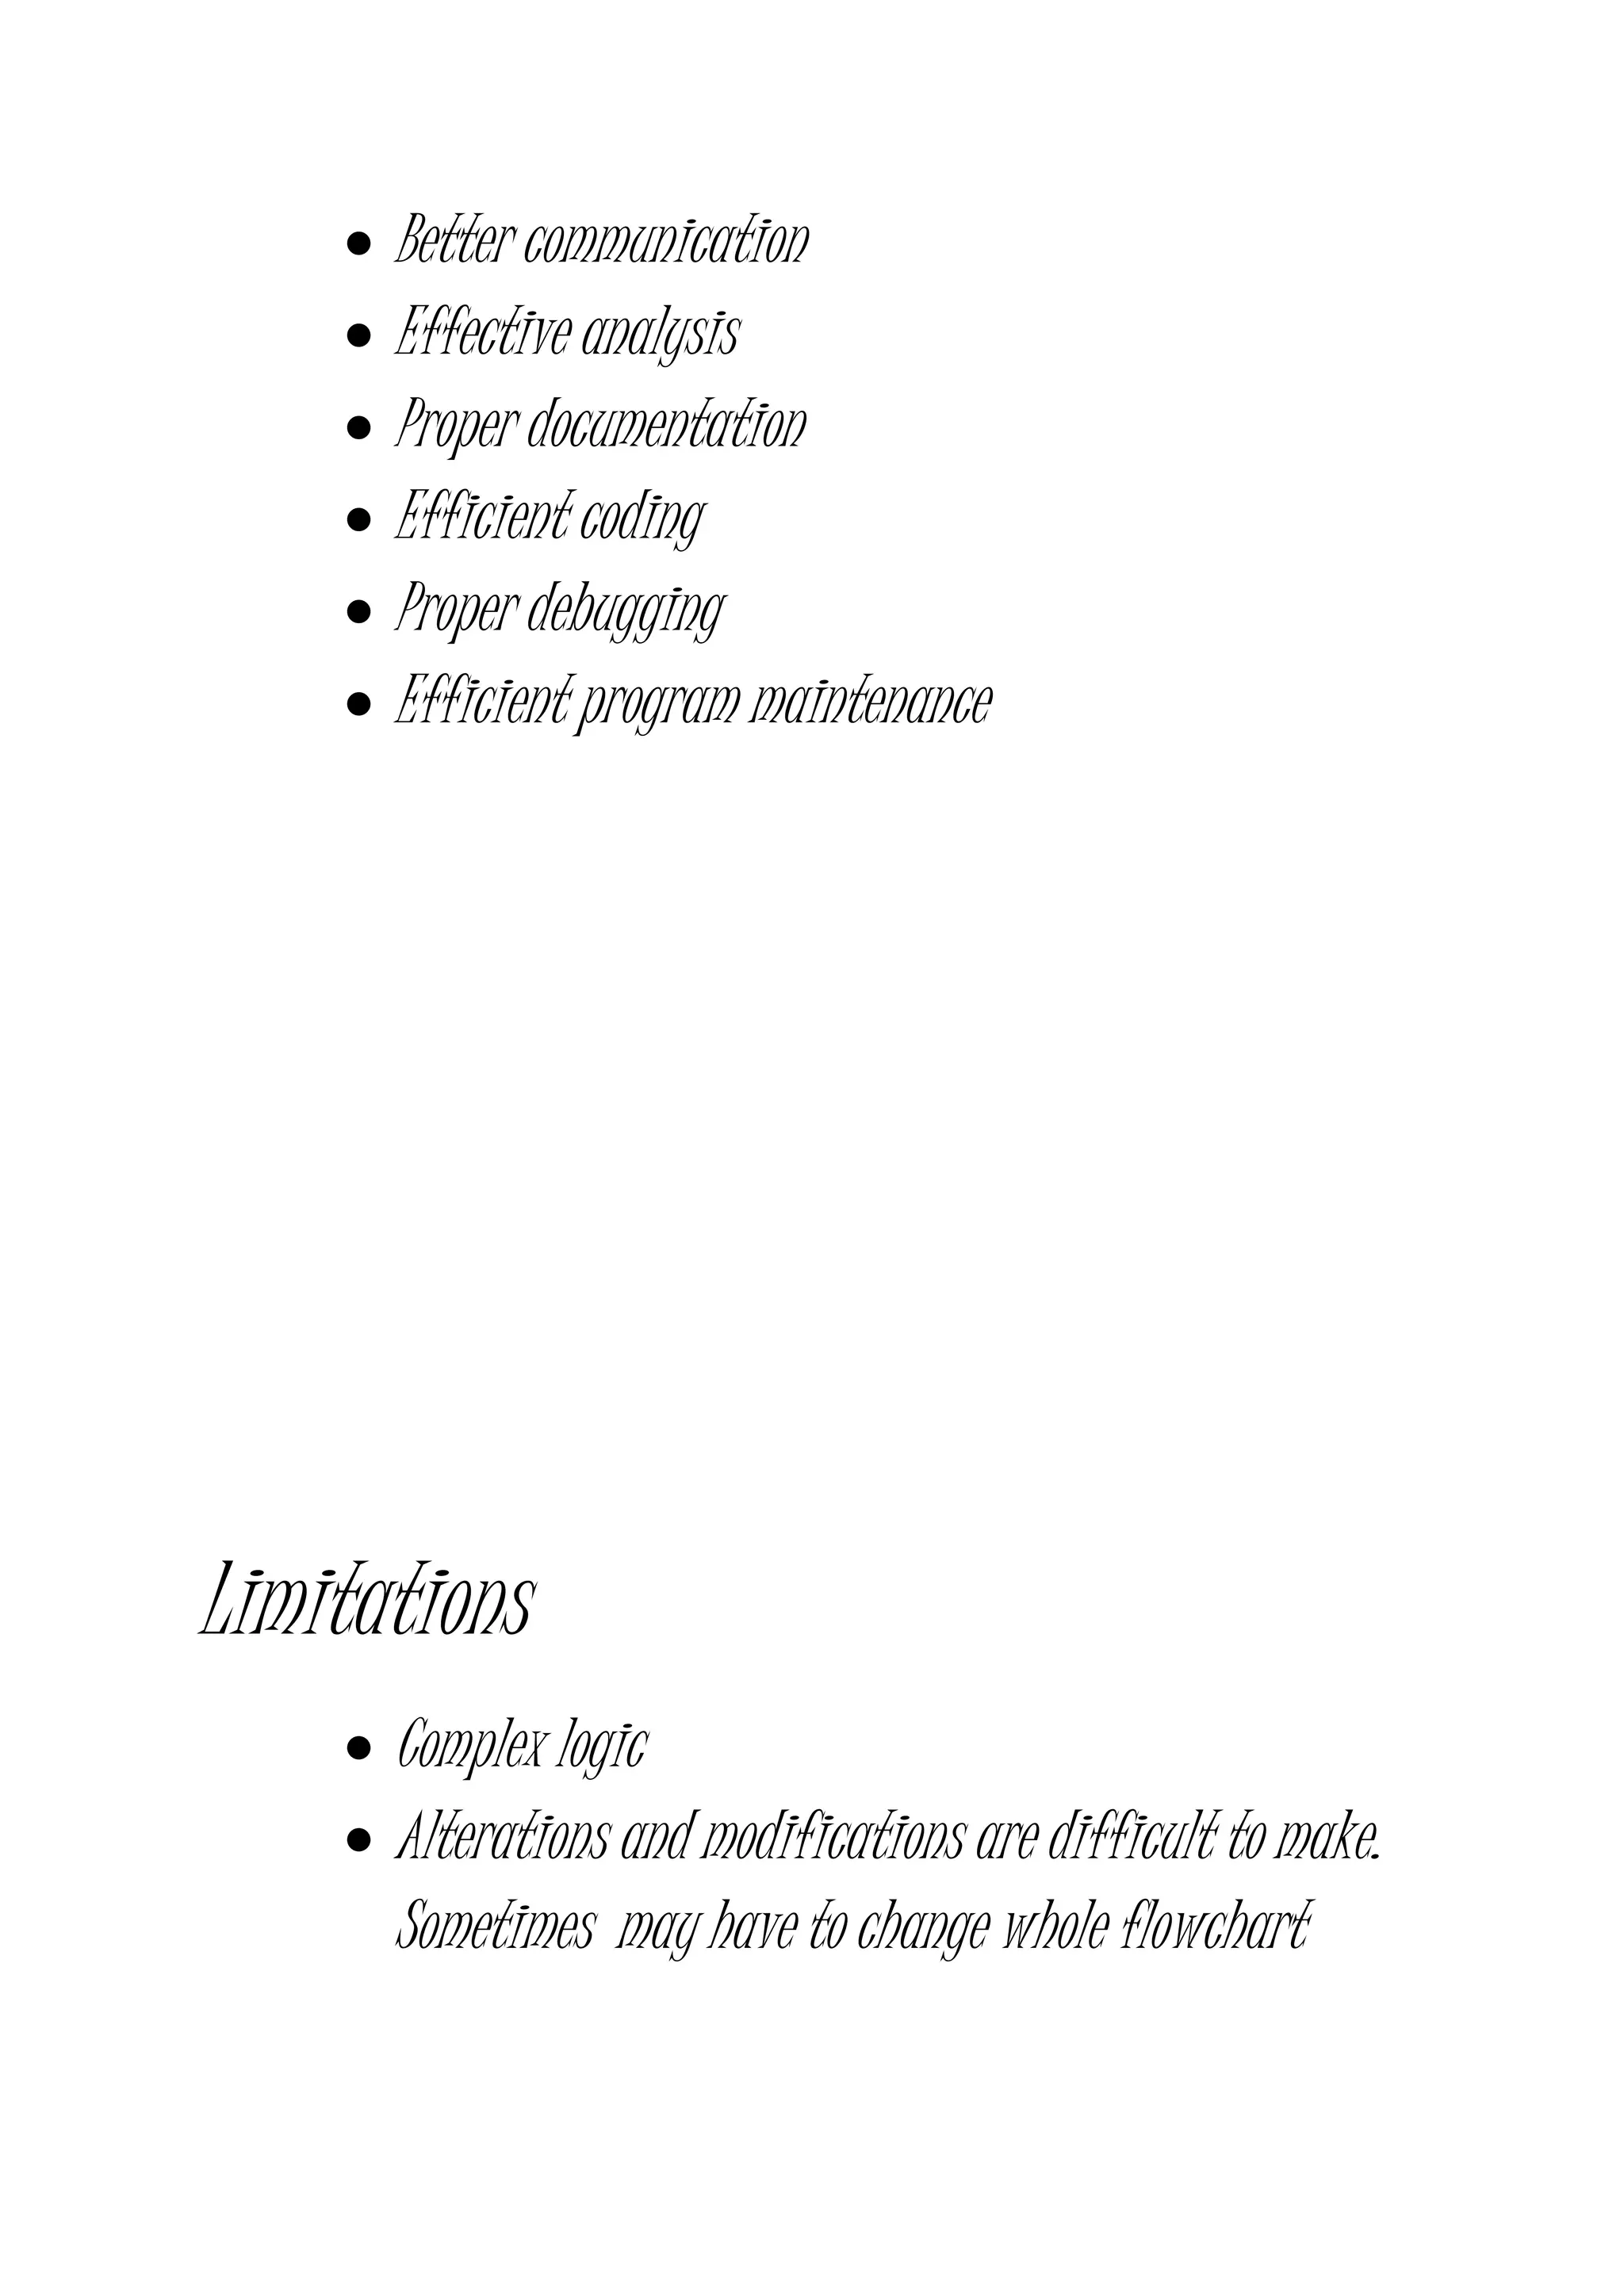
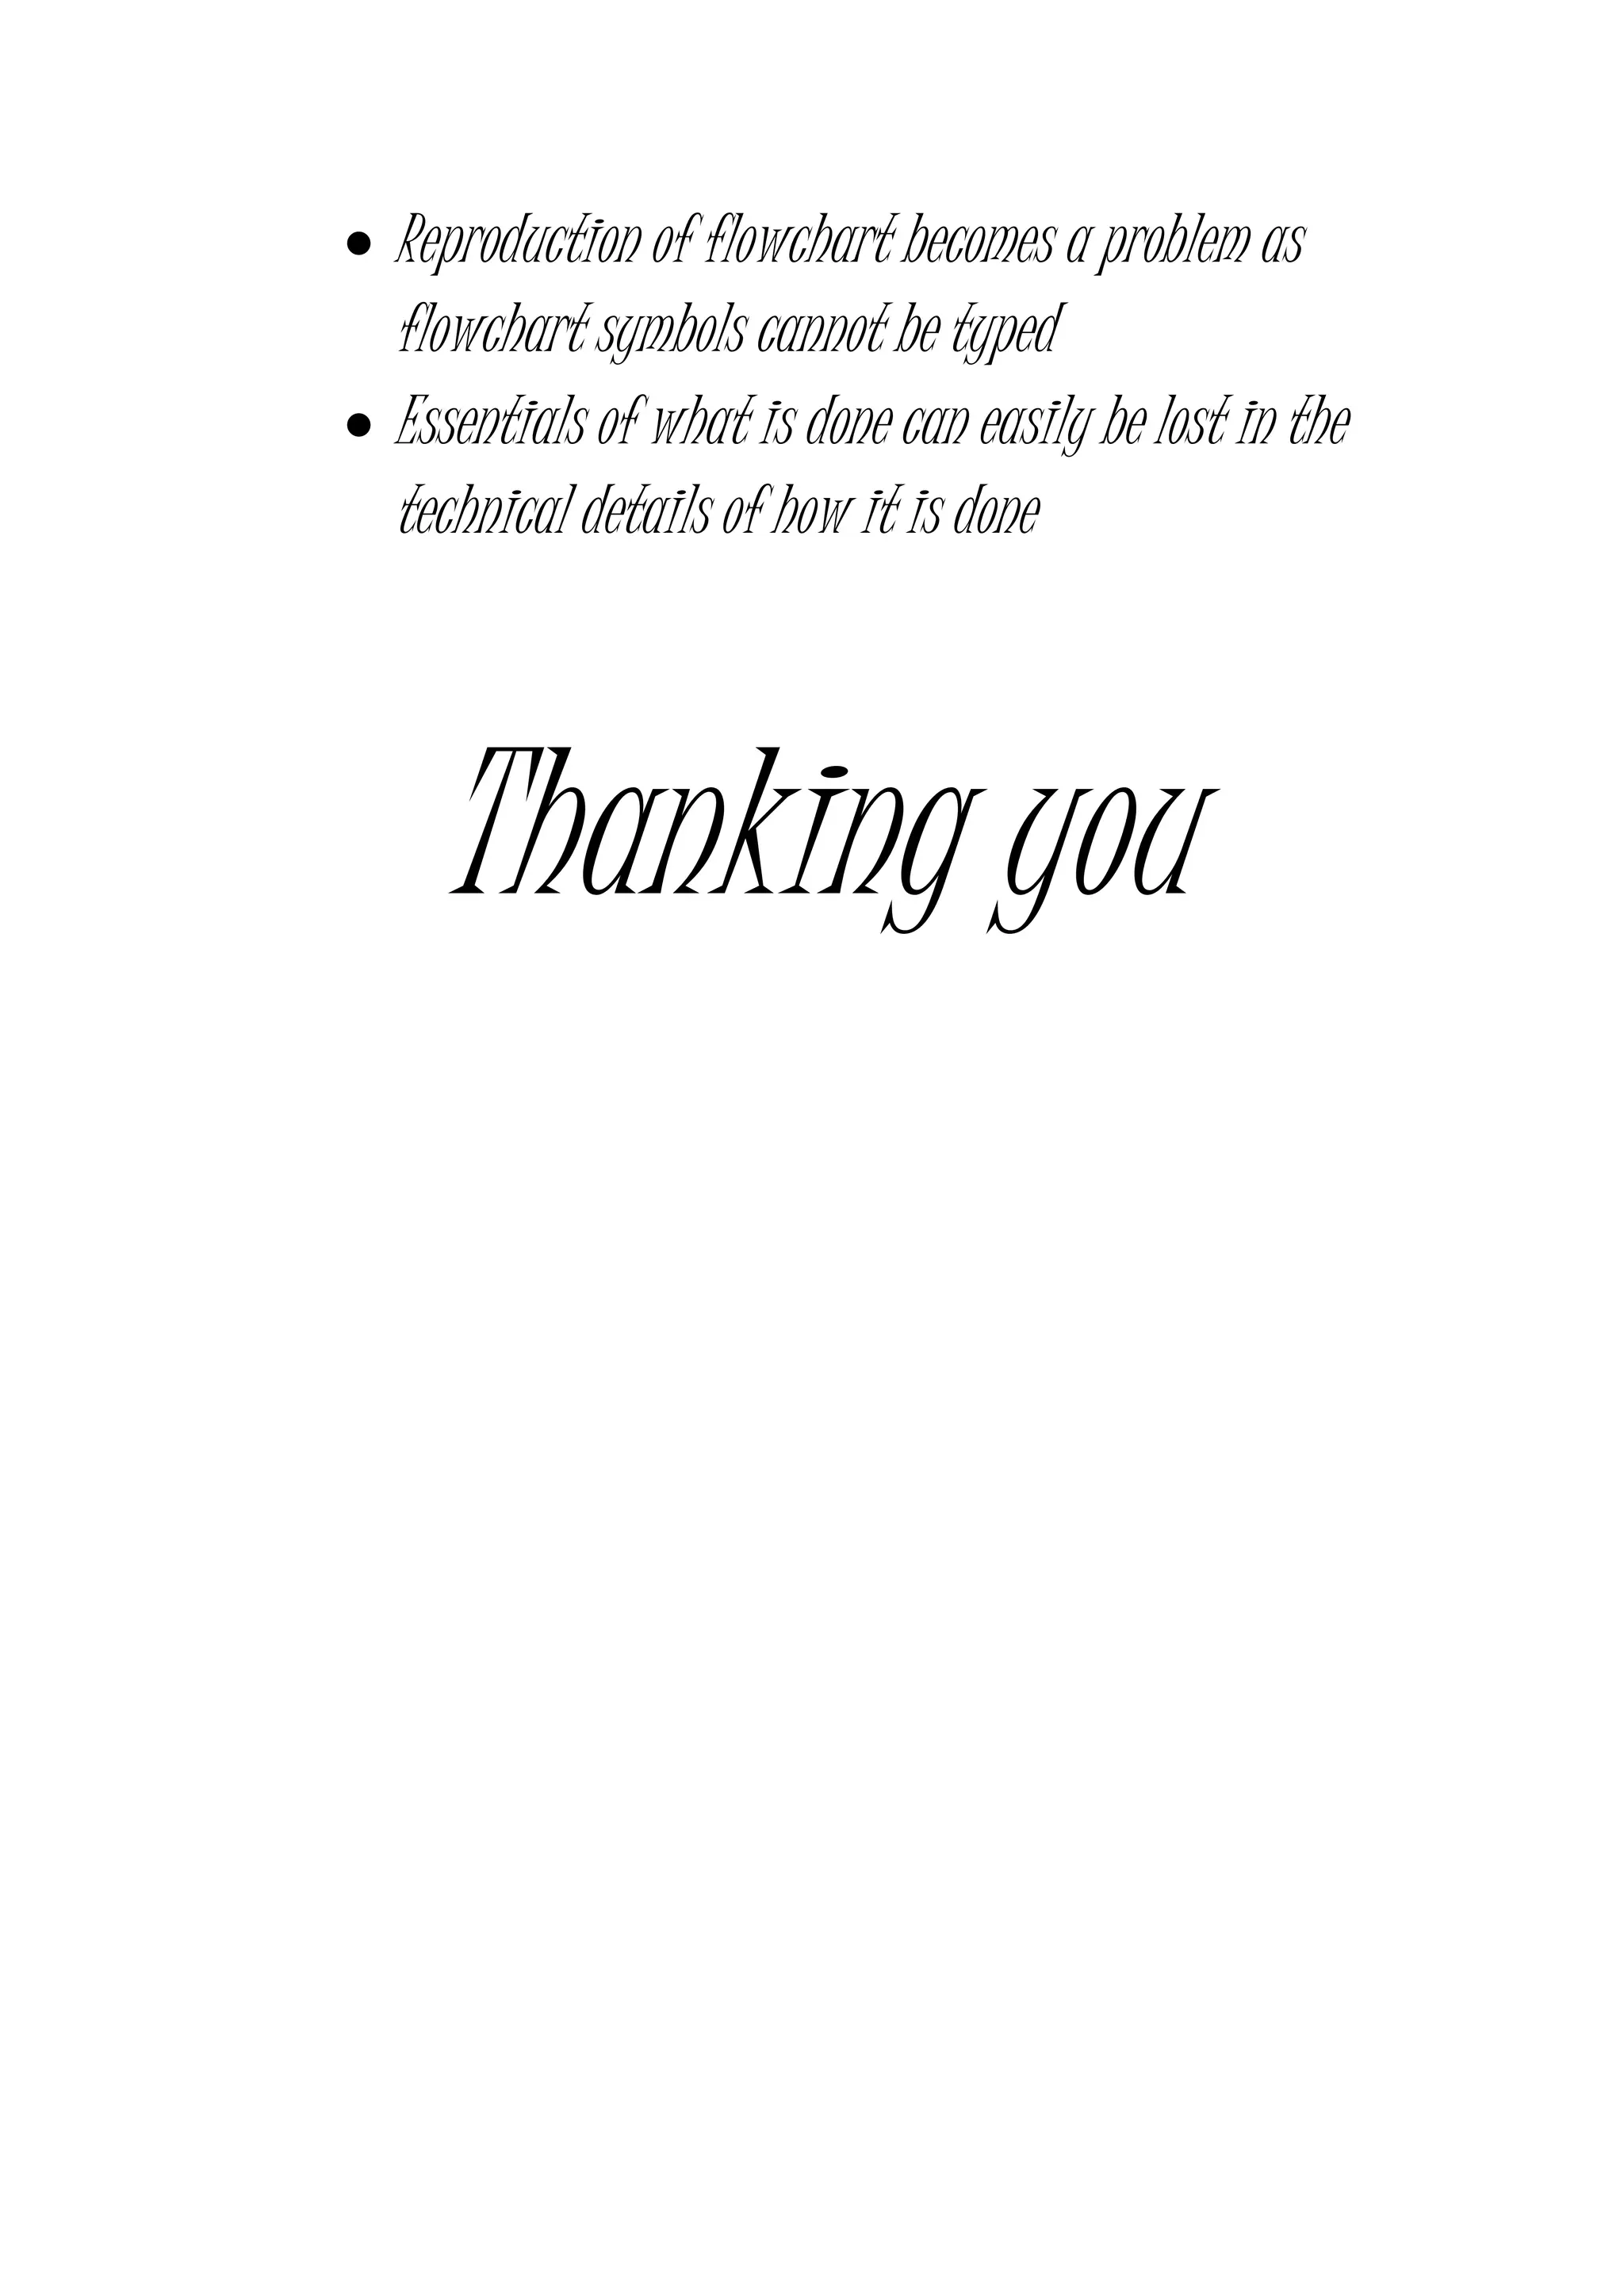
FLOWCHARTING
COLLEGE ADMISSION
PROCESS
PRESENTED BY
PARINITA DWIVEDI
PRAGYA
PRIYANKA TOGRA
(B.TECH 2ND YEAR)
(BANASTHALI UNIVERSITY)
Introduction to Flowchart
Flowchart-A flowchart is a diagram
that uses graphic symbols to depict
the nature and flow of the steps in
the process. Another name for this
tool is “flow diagram”.
Why we use flowcharts?
At the beginning of process
improvement efforts, an as-is
Flowchart helps team and others
involved in the process to understand
how it currently works. The team may
find it helpful to compare this as-is
Flowchart with a diagram of the way
the process is supposed to work.
Later, the team will develop a
Flowchart of the modified process—
again, to record how it actually
functions. At some point, your
process to be performed.
What symbols are used in Flowcharts?
The symbols that are commonly used in
Flowcharts have specific meanings and are
connected by arrows indicating the flow
from one step to another:
 Oval- Ovals indicate both the starting
point and the ending point of the
process steps.
 Box- Box represents an individual
step or activity in the process.
 Diamond- A diamond shows a decision
point, such as yes/no or go/no-go
.Each path emerging from the diamond
must be labelled with one of the
possible answers.
 Circle- A circle indicates that a
particular step is connected to
another page or part of the
Flowchart. A letter placed in the
circle clarifies the continuation.
 Triangle- A triangle shows where an
in- process measurement occurs.
Interpreting Your Flowchart
 Determine who is involved
 Form theories about root causes
 Identify ways to simplify and
refine
 Determine how to implement changes
 Locate cost-added-only steps
 Provide training
Interpretation Steps
 Step 1 - Examine each process step
Bottlenecks? Weak links? Poorly defined
steps? Cost-added-only steps?
 Step 2 - Examine each decision symbol
Can this step
be eliminated?
 Step 3 - Examine each rework loop
Can it be shortened or eliminated?
 Step 4 - Examine each activity symbol
Does the step add value for the end-
user?
Benefits of Using Flowcharts
 Promote process understanding.
 Provide tool for training.
 Identify problem areas and
improvement opportunities.
 Depict customer-supplier
relationships.
Keys to Success
 Start with the big picture
 Observe the current process
 Record process steps
 Arrange the sequence of steps
 Draw the Flowchart
Macro flowchart for admission
process
NO
YES
Student wants
admission in
Banasthali University
Fill online
application form
Fill offline
application form
Is student
eligible to give
entrance exam
Call letter sent by Banasthali to
the student providing information
about exam date and centre
AB
NO
YES
NO
YES
AB
Student gives
entrance exam
Is student
marks >
cut-off??
Student is called for
interview and interview is
held
Has student
cleared the
interview??
Fee submission is
done by the student
CD
Admission confirmed
CD
End of
process
Admission
denied
Micro flowchart for filling offline application form
Student has filled online
application form
Student sends an application requesting
for offline application form with a DD of
examination fee
On receipt of above, Banasthali sends
brochure and offline application form
to the student
On receiving the offline application form,
student fills it and it back to Banasthali where
it is process
End of filling offline
application form
Micro flowchart for interview process
Student has qualified the
entrance exam and gets a call
letter for interview
Document
verification is done
Mental ability of student is
checked via interview 1
Knowledge of student is
rechecked in interview 2
Medical test is held to
check the fitness of
student
A
NO
YES
A
Has student
qualified the
interview??
Admission is confirmed and fee
submission process takes place
Admission denied
End of interview
process
PROBLEMS FACED DURING ADMISSION PROCESS
1. Accomodation problem=
During admission times the no. Of students and their accompanying parents, coming to the
university campus , are much more that could be accommodated in the guest houses
2. too lengthy admission process=
Mere interview process continues for a whole day or two
3.improper communication between the university and students.
Sometimes the post sent to the university or to the students , doesn’t reach on time and it
hampers the admission process. The students have to fill 2 different application forms and it
creates problems. When to submit the dd is also a problem.
CONCLUSION
This project has been very useful . we have come across many new concepts
which would be useful to us in future. Here’s a brief summary of what we
learnt.
Flowchart is a diagrammatic representation of data flow which has
following benefits and limitations.
Advantages
 Better communication
 Effective analysis
 Proper documentation
 Efficient coding
 Proper debugging
 Efficient program maintenance
Limitations
 Complex logic
 Alterations and modifications are difficult to make.
Sometimes may have to change whole flowchart
 Reproduction of flowchart becomes a problem as
flowchart symbols cannot be typed
 Essentials of what is done can easily be lost in the
technical details of how it is done
Thanking you

Qcl 14-v3 [flowchart-college admission process]-[banasthali university]_[parinita dwiveedi]

  • 1.
  • 2.
    PRESENTED BY PARINITA DWIVEDI PRAGYA PRIYANKATOGRA (B.TECH 2ND YEAR) (BANASTHALI UNIVERSITY)
  • 3.
    Introduction to Flowchart Flowchart-Aflowchart is a diagram that uses graphic symbols to depict the nature and flow of the steps in the process. Another name for this tool is “flow diagram”. Why we use flowcharts?
  • 4.
    At the beginningof process improvement efforts, an as-is Flowchart helps team and others involved in the process to understand how it currently works. The team may find it helpful to compare this as-is Flowchart with a diagram of the way the process is supposed to work. Later, the team will develop a Flowchart of the modified process— again, to record how it actually functions. At some point, your process to be performed. What symbols are used in Flowcharts?
  • 5.
    The symbols thatare commonly used in Flowcharts have specific meanings and are connected by arrows indicating the flow from one step to another:  Oval- Ovals indicate both the starting point and the ending point of the process steps.  Box- Box represents an individual step or activity in the process.  Diamond- A diamond shows a decision point, such as yes/no or go/no-go .Each path emerging from the diamond must be labelled with one of the possible answers.  Circle- A circle indicates that a particular step is connected to another page or part of the Flowchart. A letter placed in the circle clarifies the continuation.  Triangle- A triangle shows where an in- process measurement occurs.
  • 9.
    Interpreting Your Flowchart Determine who is involved  Form theories about root causes  Identify ways to simplify and refine  Determine how to implement changes  Locate cost-added-only steps  Provide training Interpretation Steps
  • 10.
     Step 1- Examine each process step Bottlenecks? Weak links? Poorly defined steps? Cost-added-only steps?  Step 2 - Examine each decision symbol Can this step be eliminated?  Step 3 - Examine each rework loop Can it be shortened or eliminated?  Step 4 - Examine each activity symbol Does the step add value for the end- user? Benefits of Using Flowcharts
  • 11.
     Promote processunderstanding.  Provide tool for training.  Identify problem areas and improvement opportunities.  Depict customer-supplier relationships. Keys to Success
  • 12.
     Start withthe big picture  Observe the current process  Record process steps  Arrange the sequence of steps  Draw the Flowchart
  • 13.
    Macro flowchart foradmission process NO YES Student wants admission in Banasthali University Fill online application form Fill offline application form Is student eligible to give entrance exam Call letter sent by Banasthali to the student providing information about exam date and centre AB
  • 14.
    NO YES NO YES AB Student gives entrance exam Isstudent marks > cut-off?? Student is called for interview and interview is held Has student cleared the interview?? Fee submission is done by the student CD
  • 15.
  • 16.
    Micro flowchart forfilling offline application form Student has filled online application form Student sends an application requesting for offline application form with a DD of examination fee On receipt of above, Banasthali sends brochure and offline application form to the student On receiving the offline application form, student fills it and it back to Banasthali where it is process End of filling offline application form
  • 17.
    Micro flowchart forinterview process Student has qualified the entrance exam and gets a call letter for interview Document verification is done Mental ability of student is checked via interview 1 Knowledge of student is rechecked in interview 2 Medical test is held to check the fitness of student A
  • 18.
    NO YES A Has student qualified the interview?? Admissionis confirmed and fee submission process takes place Admission denied End of interview process
  • 19.
    PROBLEMS FACED DURINGADMISSION PROCESS 1. Accomodation problem= During admission times the no. Of students and their accompanying parents, coming to the university campus , are much more that could be accommodated in the guest houses 2. too lengthy admission process= Mere interview process continues for a whole day or two 3.improper communication between the university and students. Sometimes the post sent to the university or to the students , doesn’t reach on time and it hampers the admission process. The students have to fill 2 different application forms and it creates problems. When to submit the dd is also a problem.
  • 20.
    CONCLUSION This project hasbeen very useful . we have come across many new concepts which would be useful to us in future. Here’s a brief summary of what we learnt. Flowchart is a diagrammatic representation of data flow which has following benefits and limitations. Advantages
  • 21.
     Better communication Effective analysis  Proper documentation  Efficient coding  Proper debugging  Efficient program maintenance Limitations  Complex logic  Alterations and modifications are difficult to make. Sometimes may have to change whole flowchart
  • 22.
     Reproduction offlowchart becomes a problem as flowchart symbols cannot be typed  Essentials of what is done can easily be lost in the technical details of how it is done Thanking you