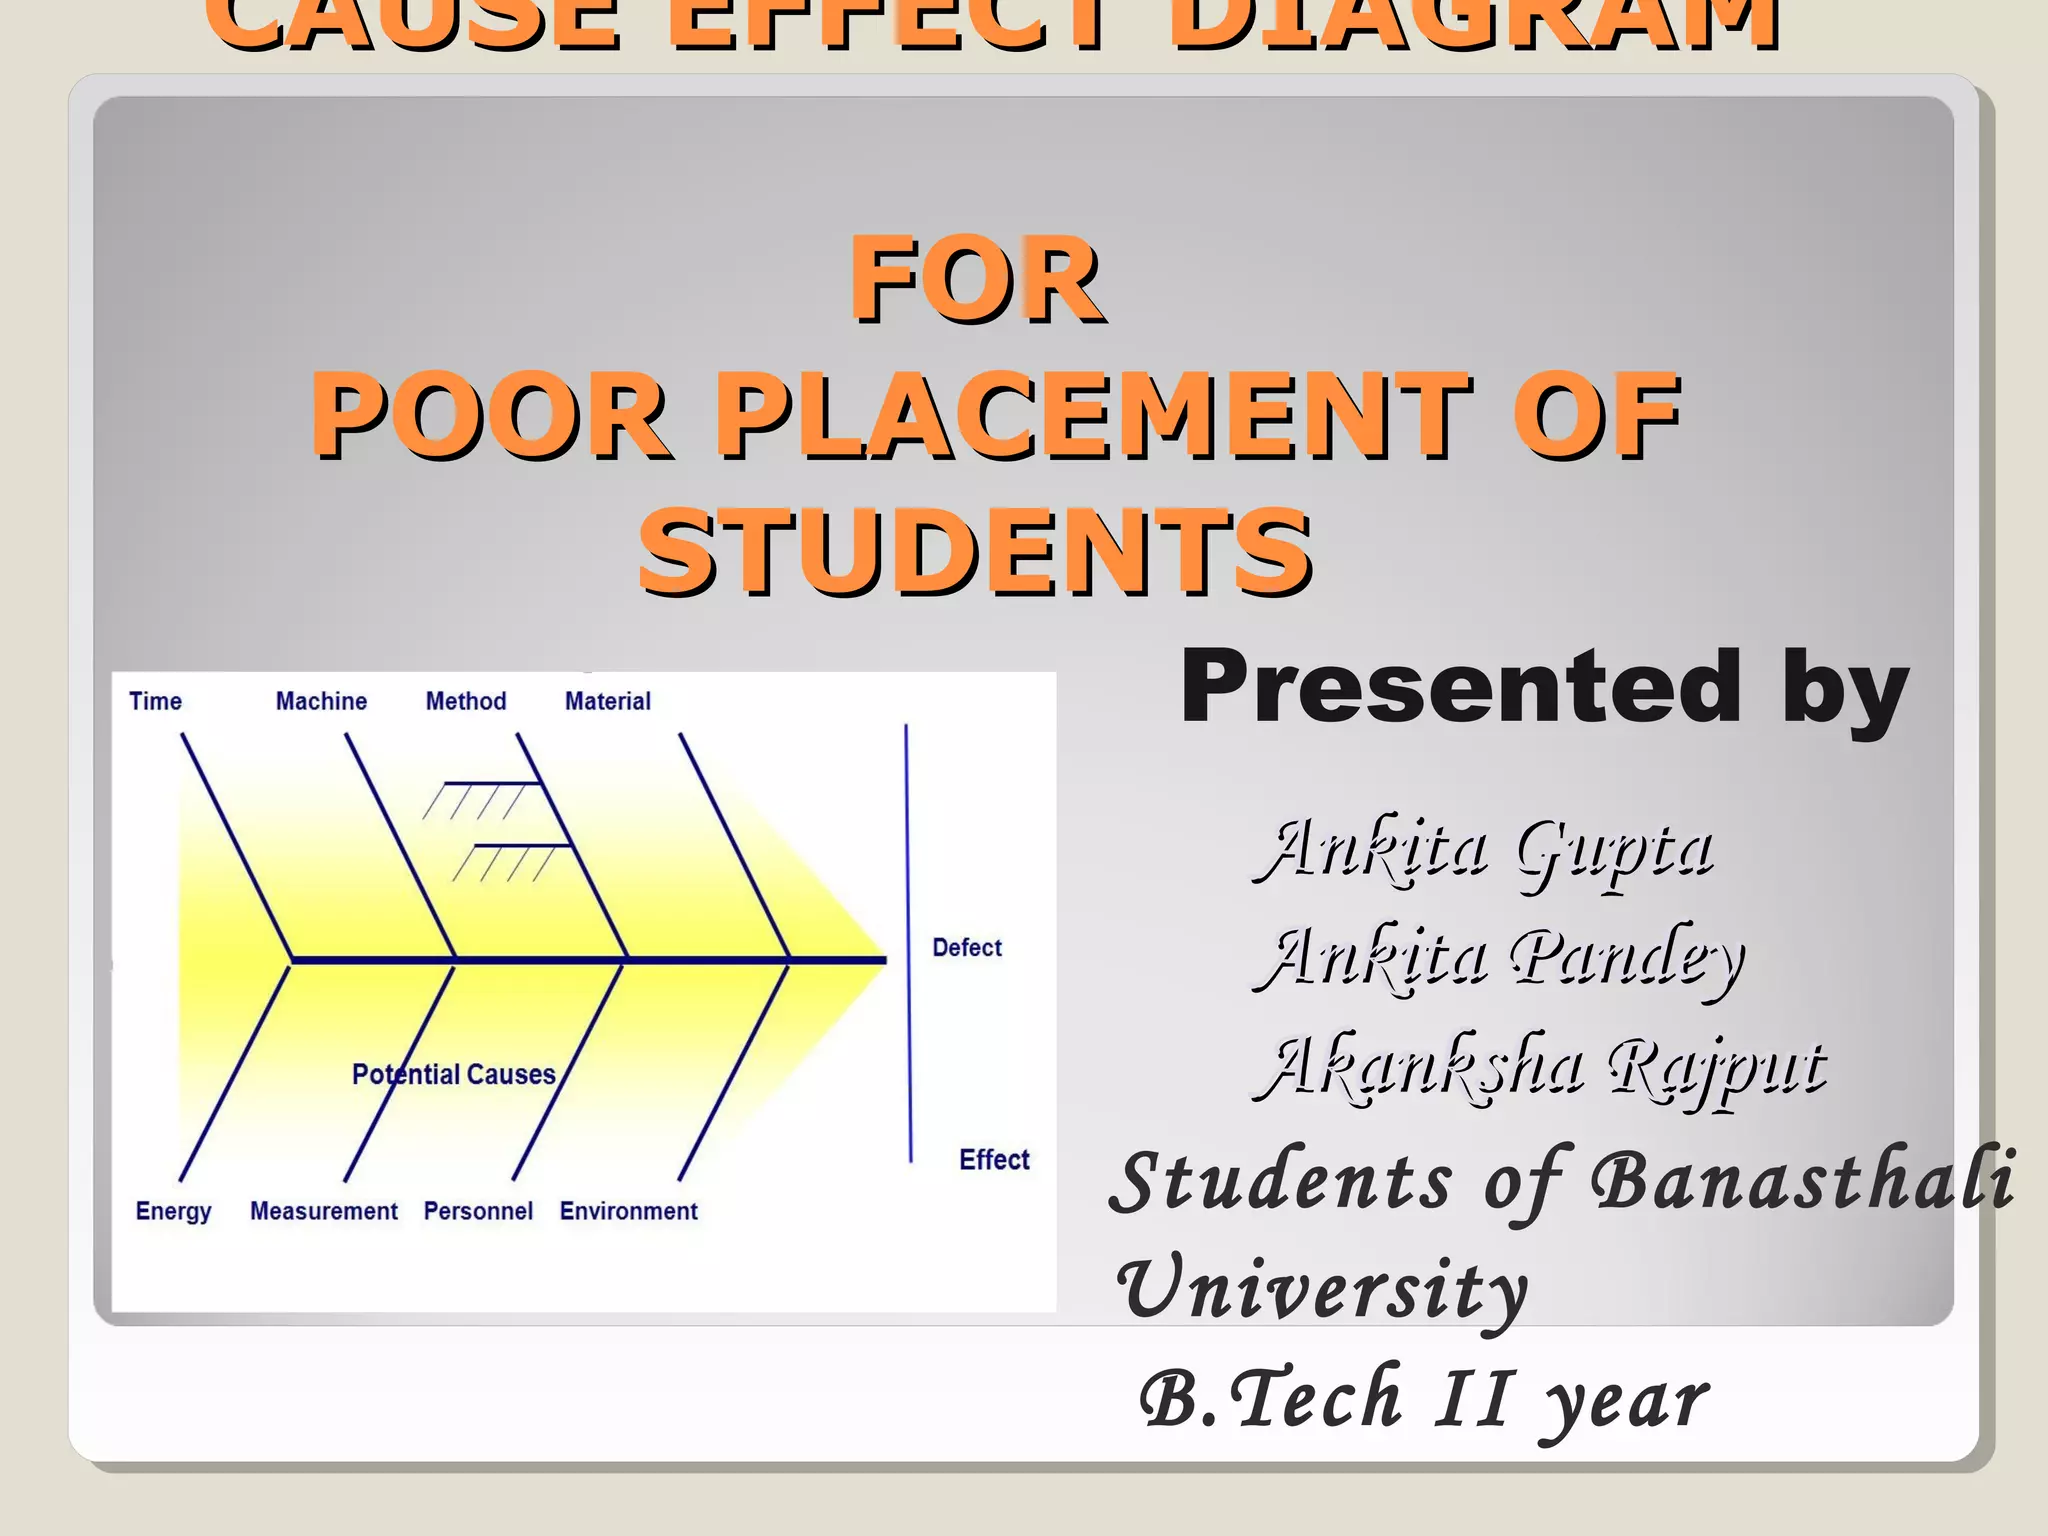
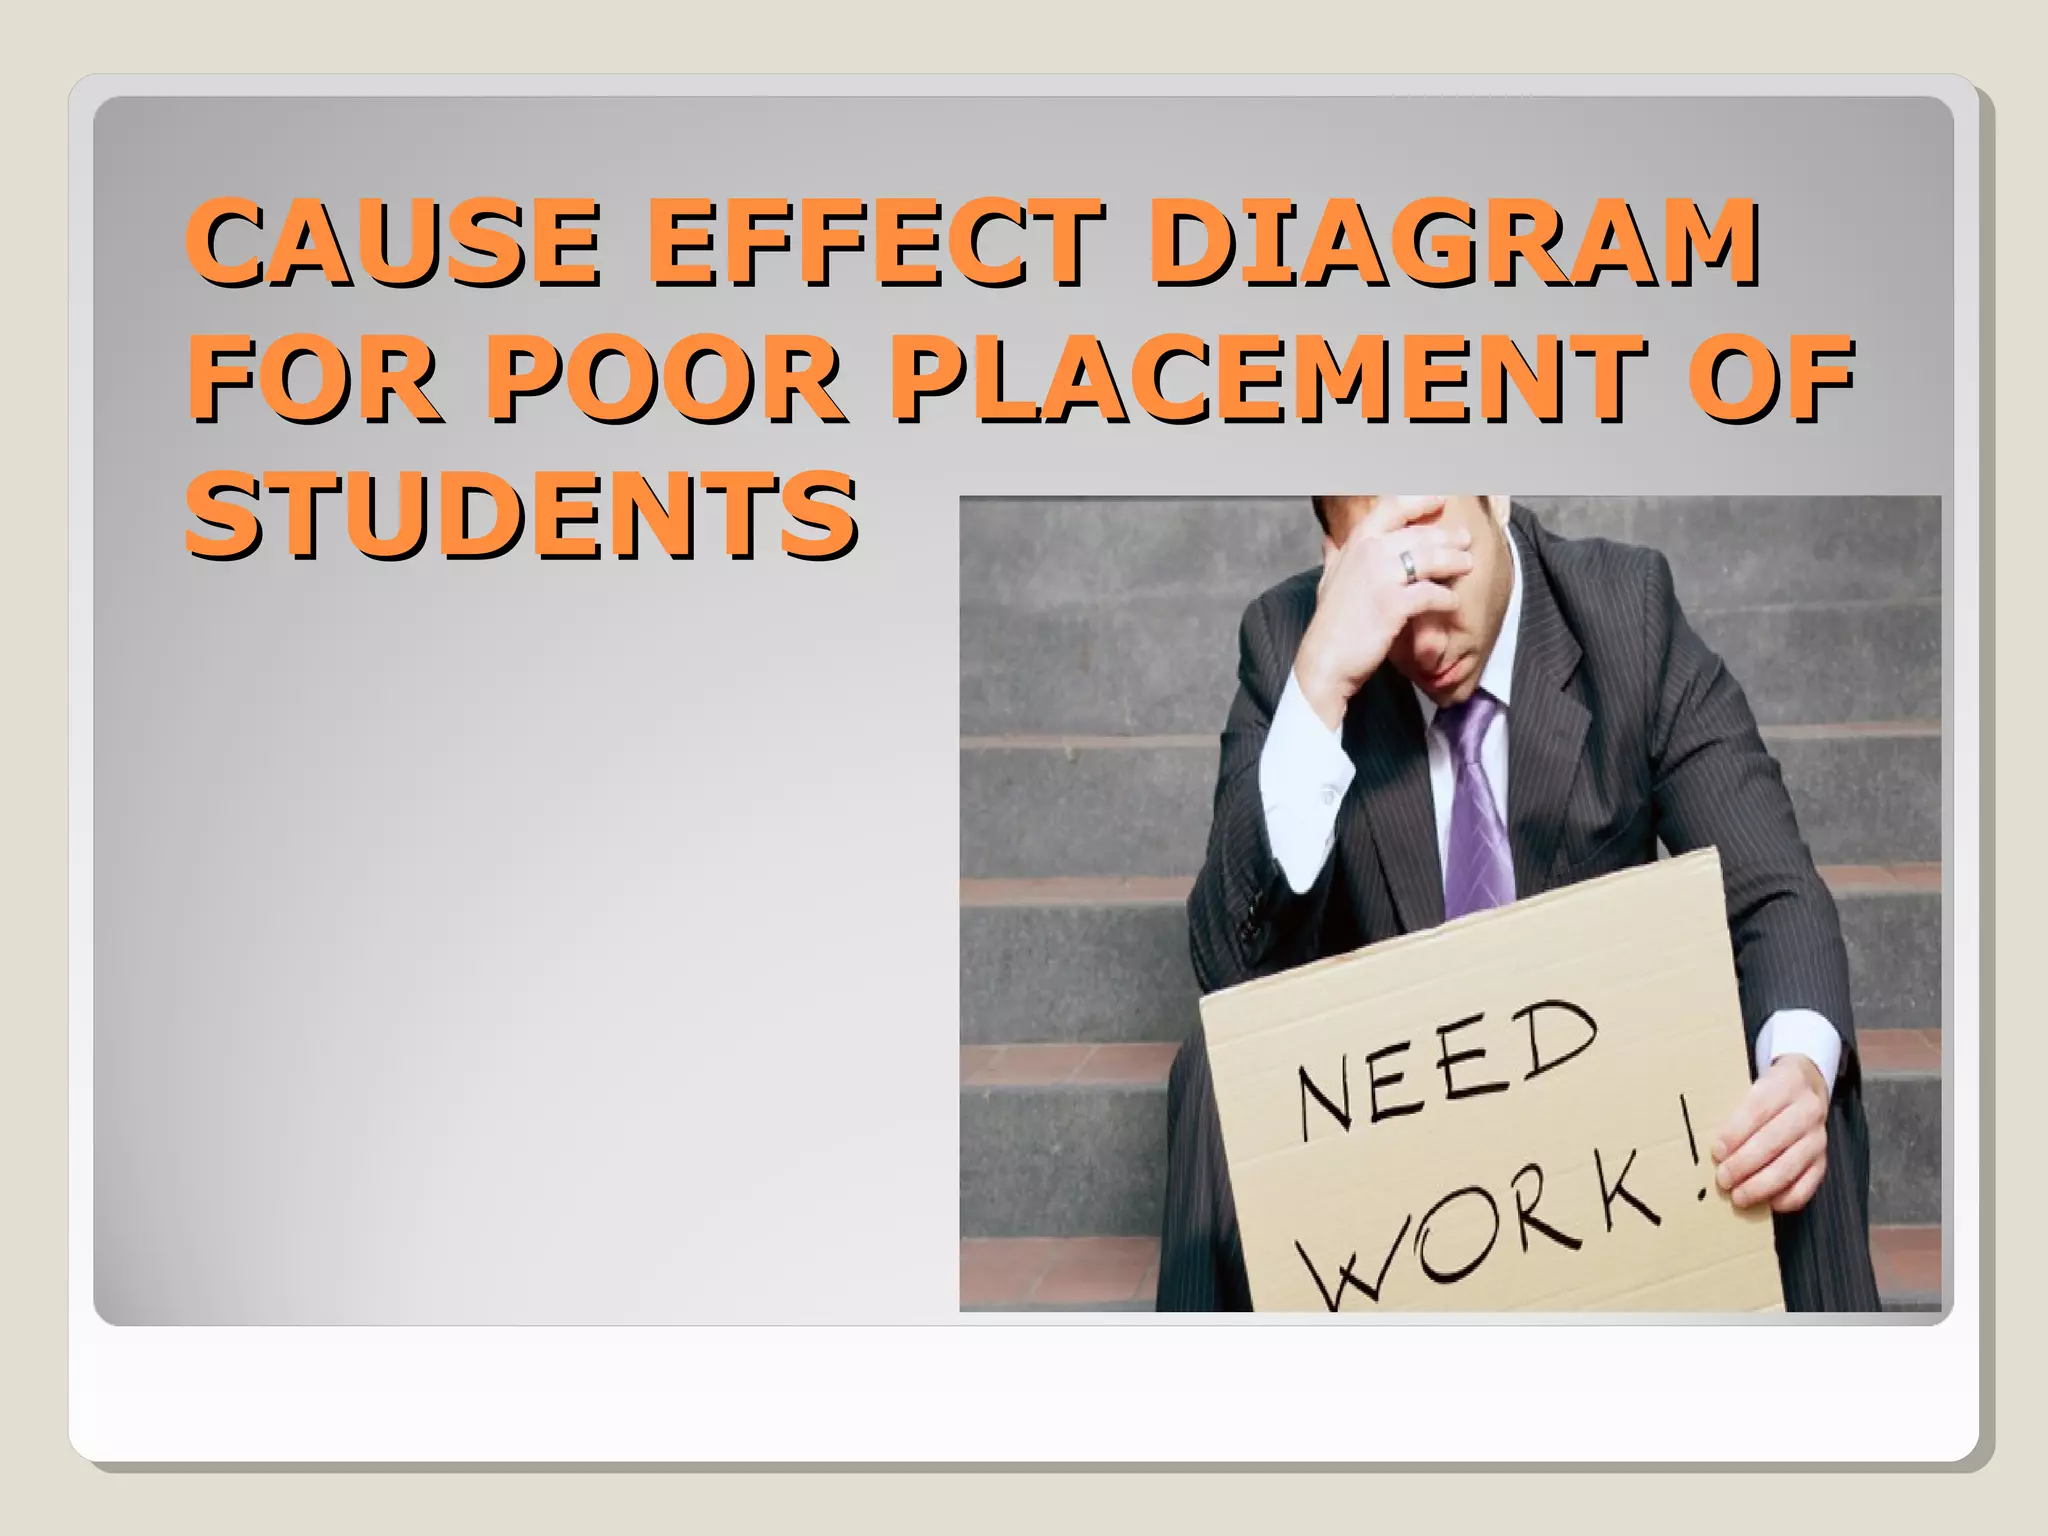
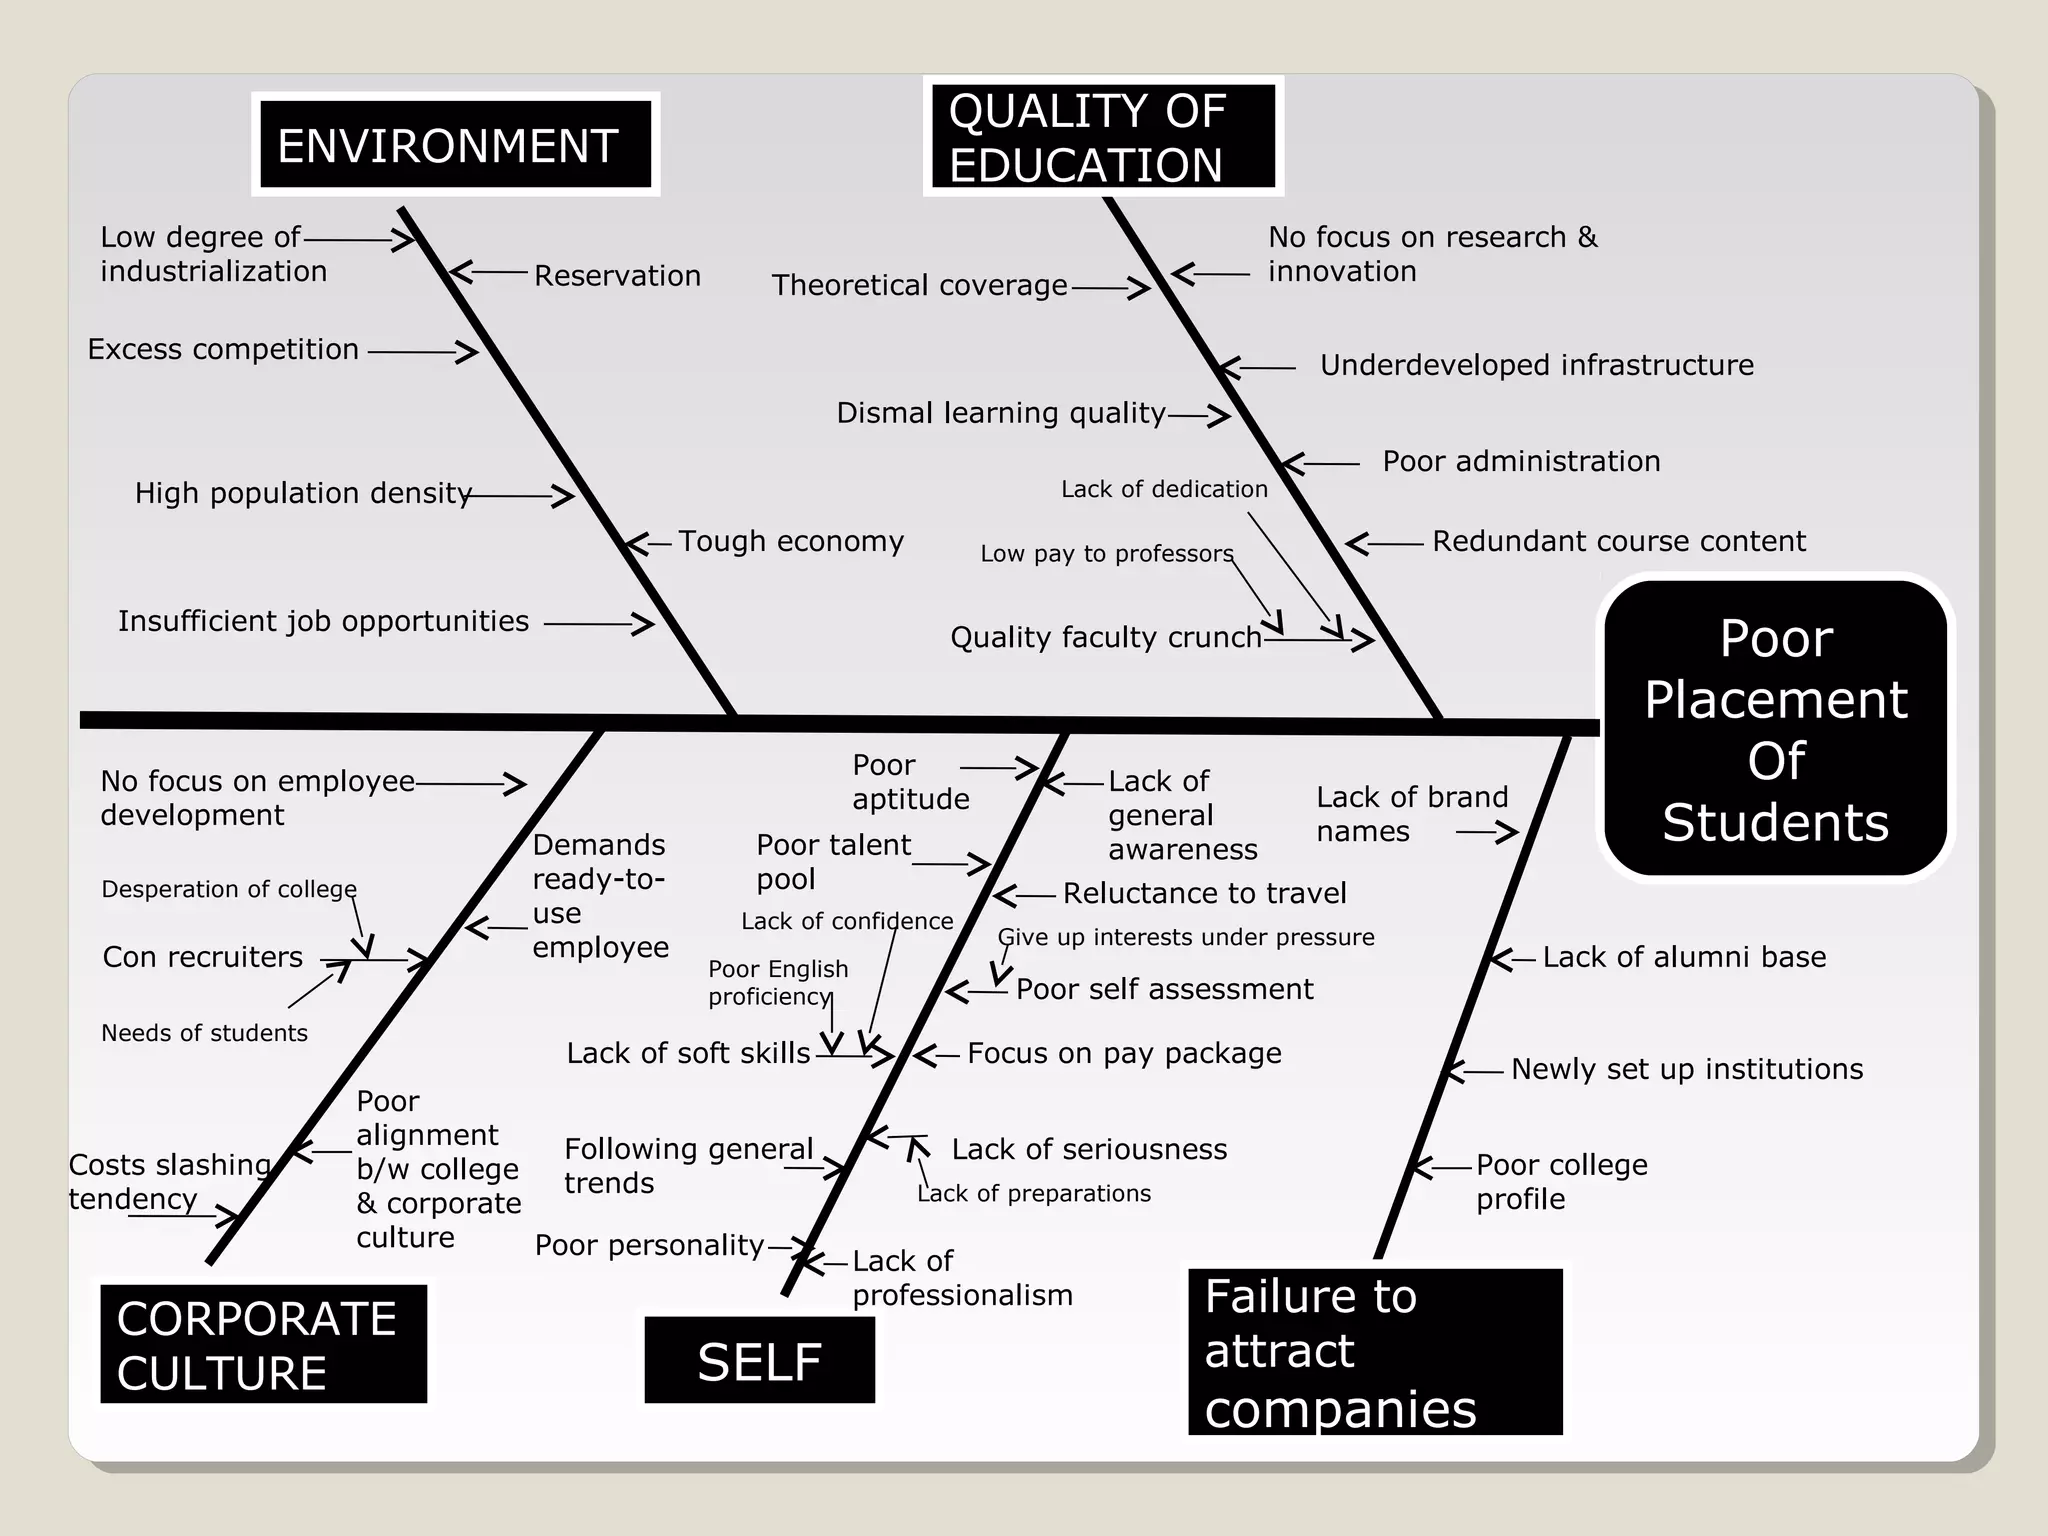
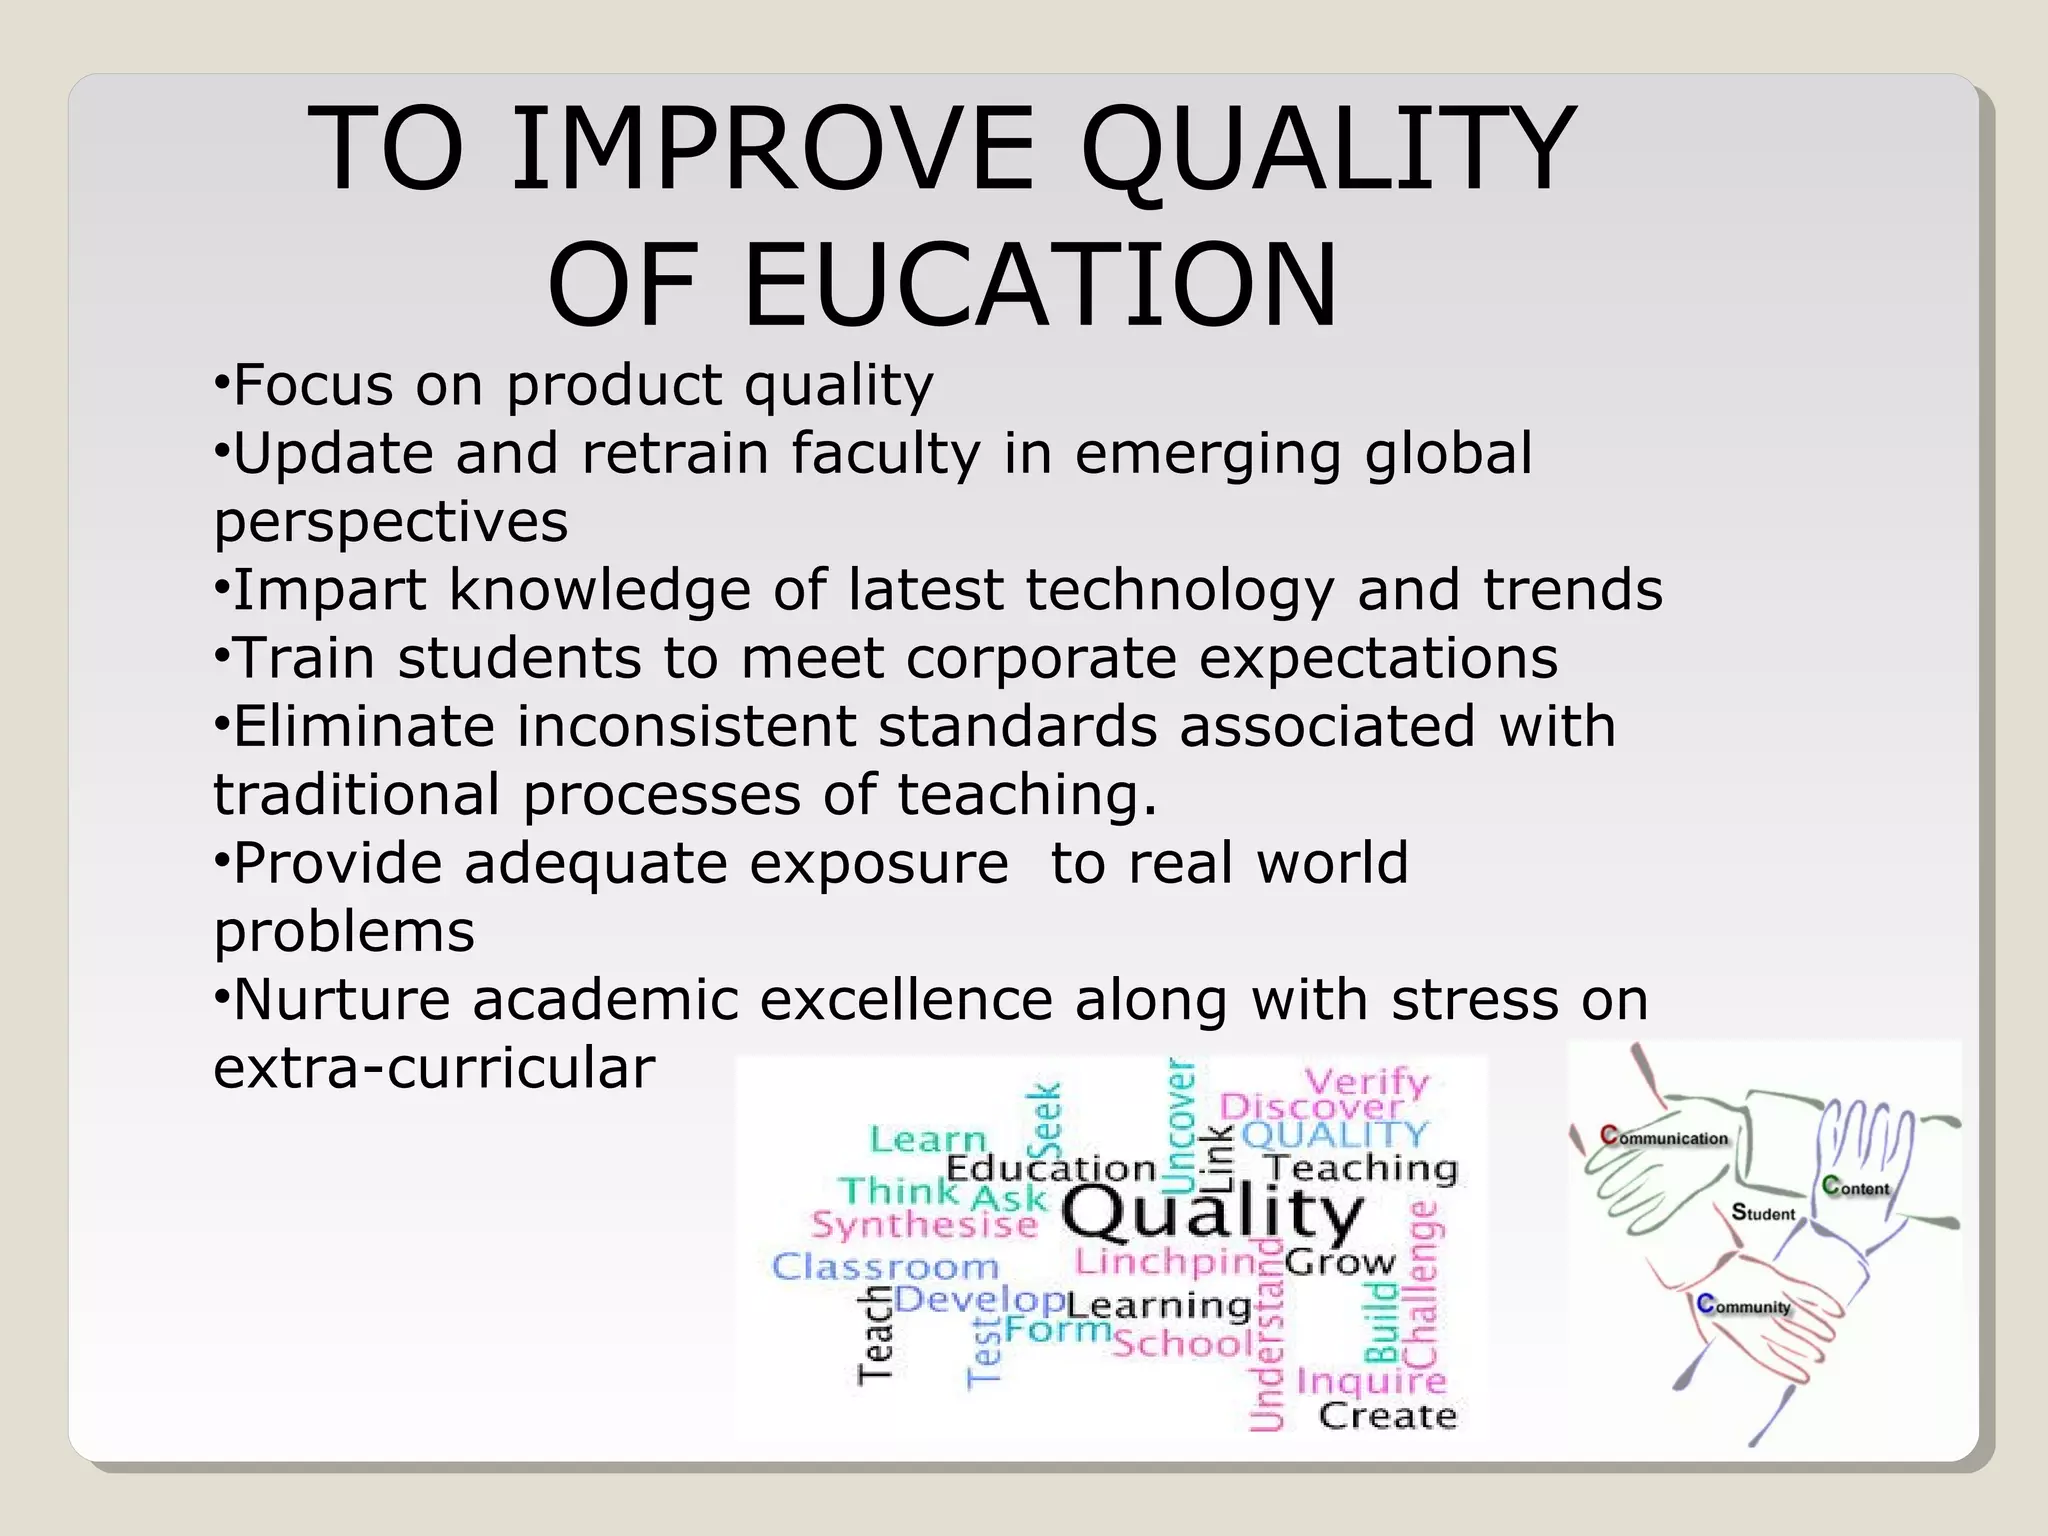
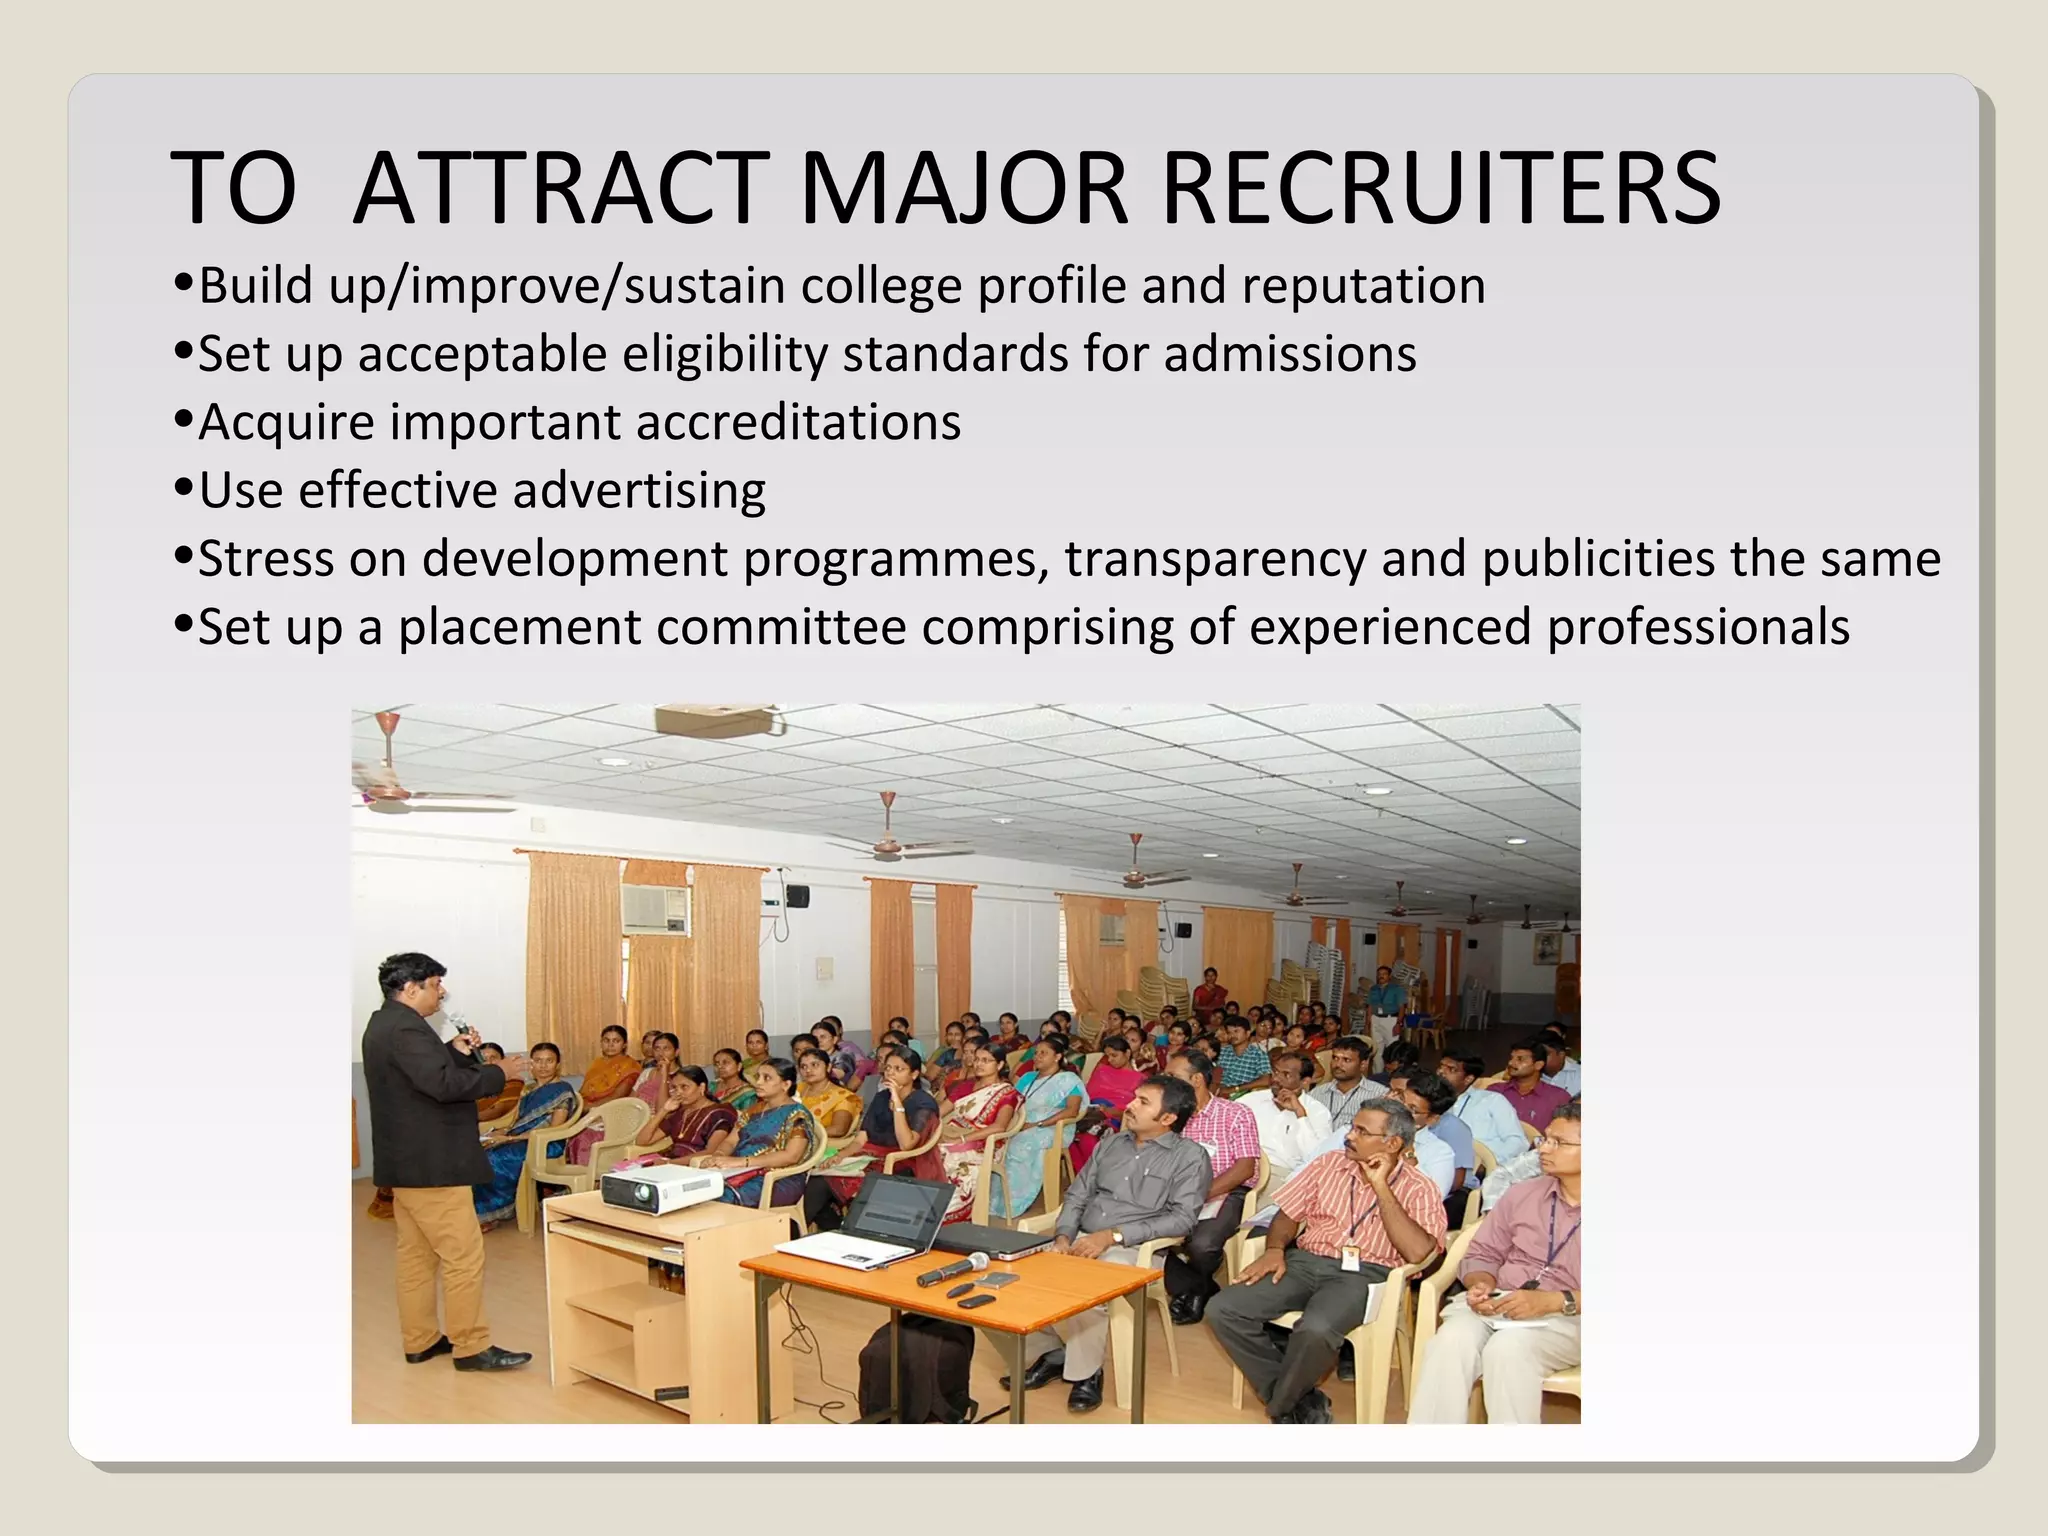
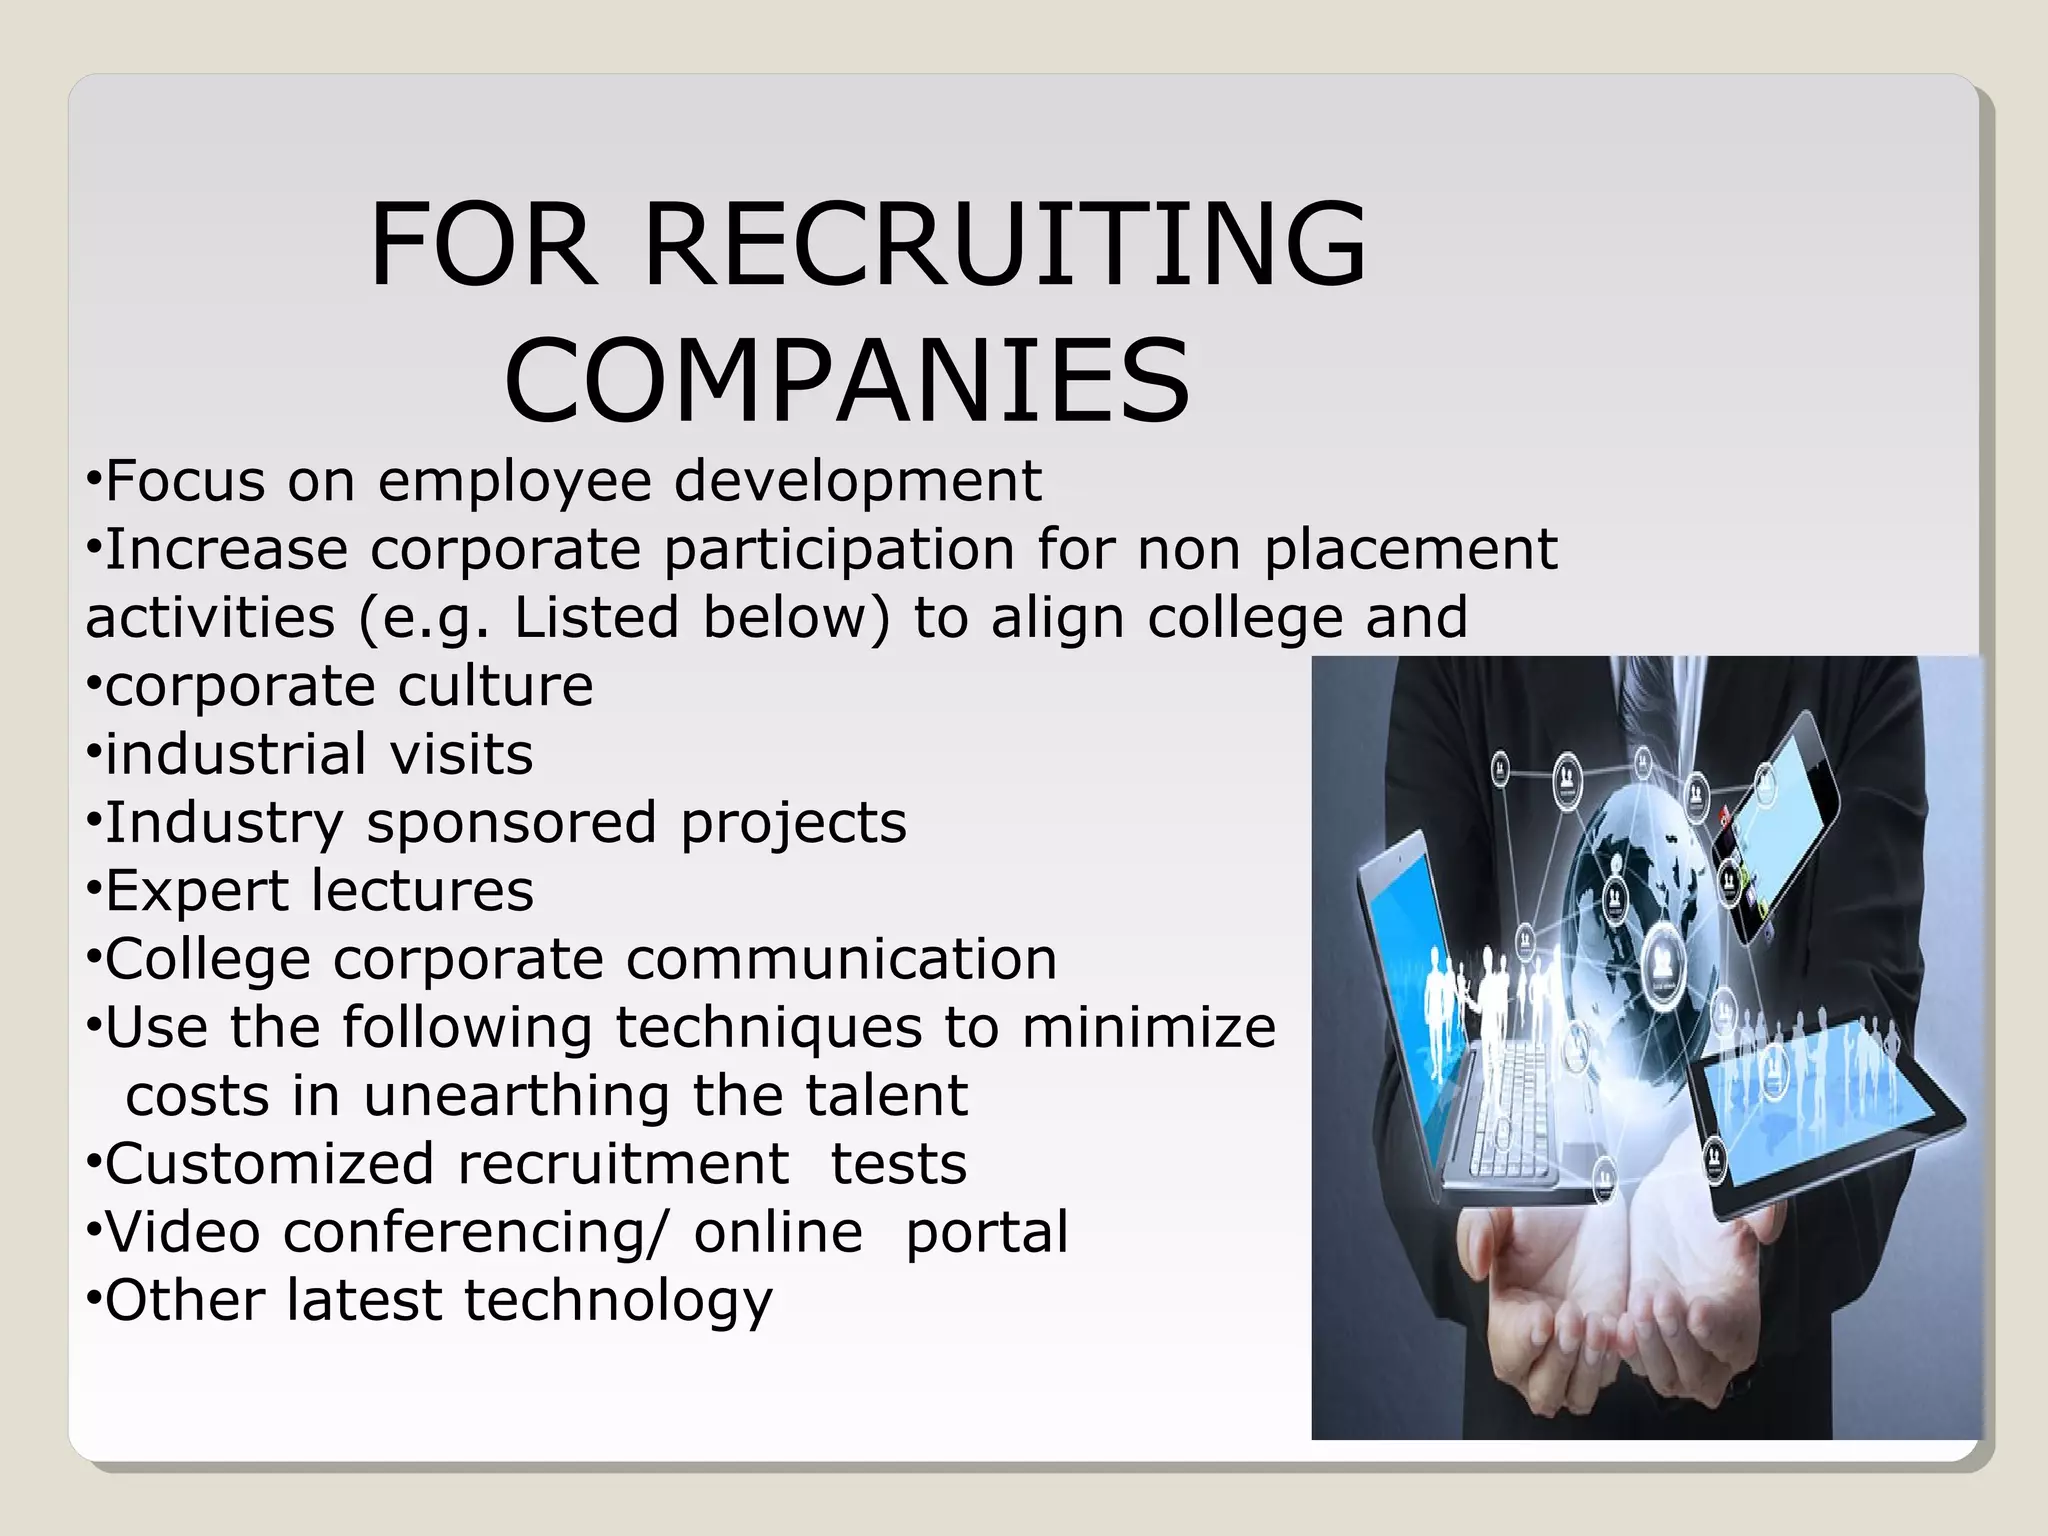
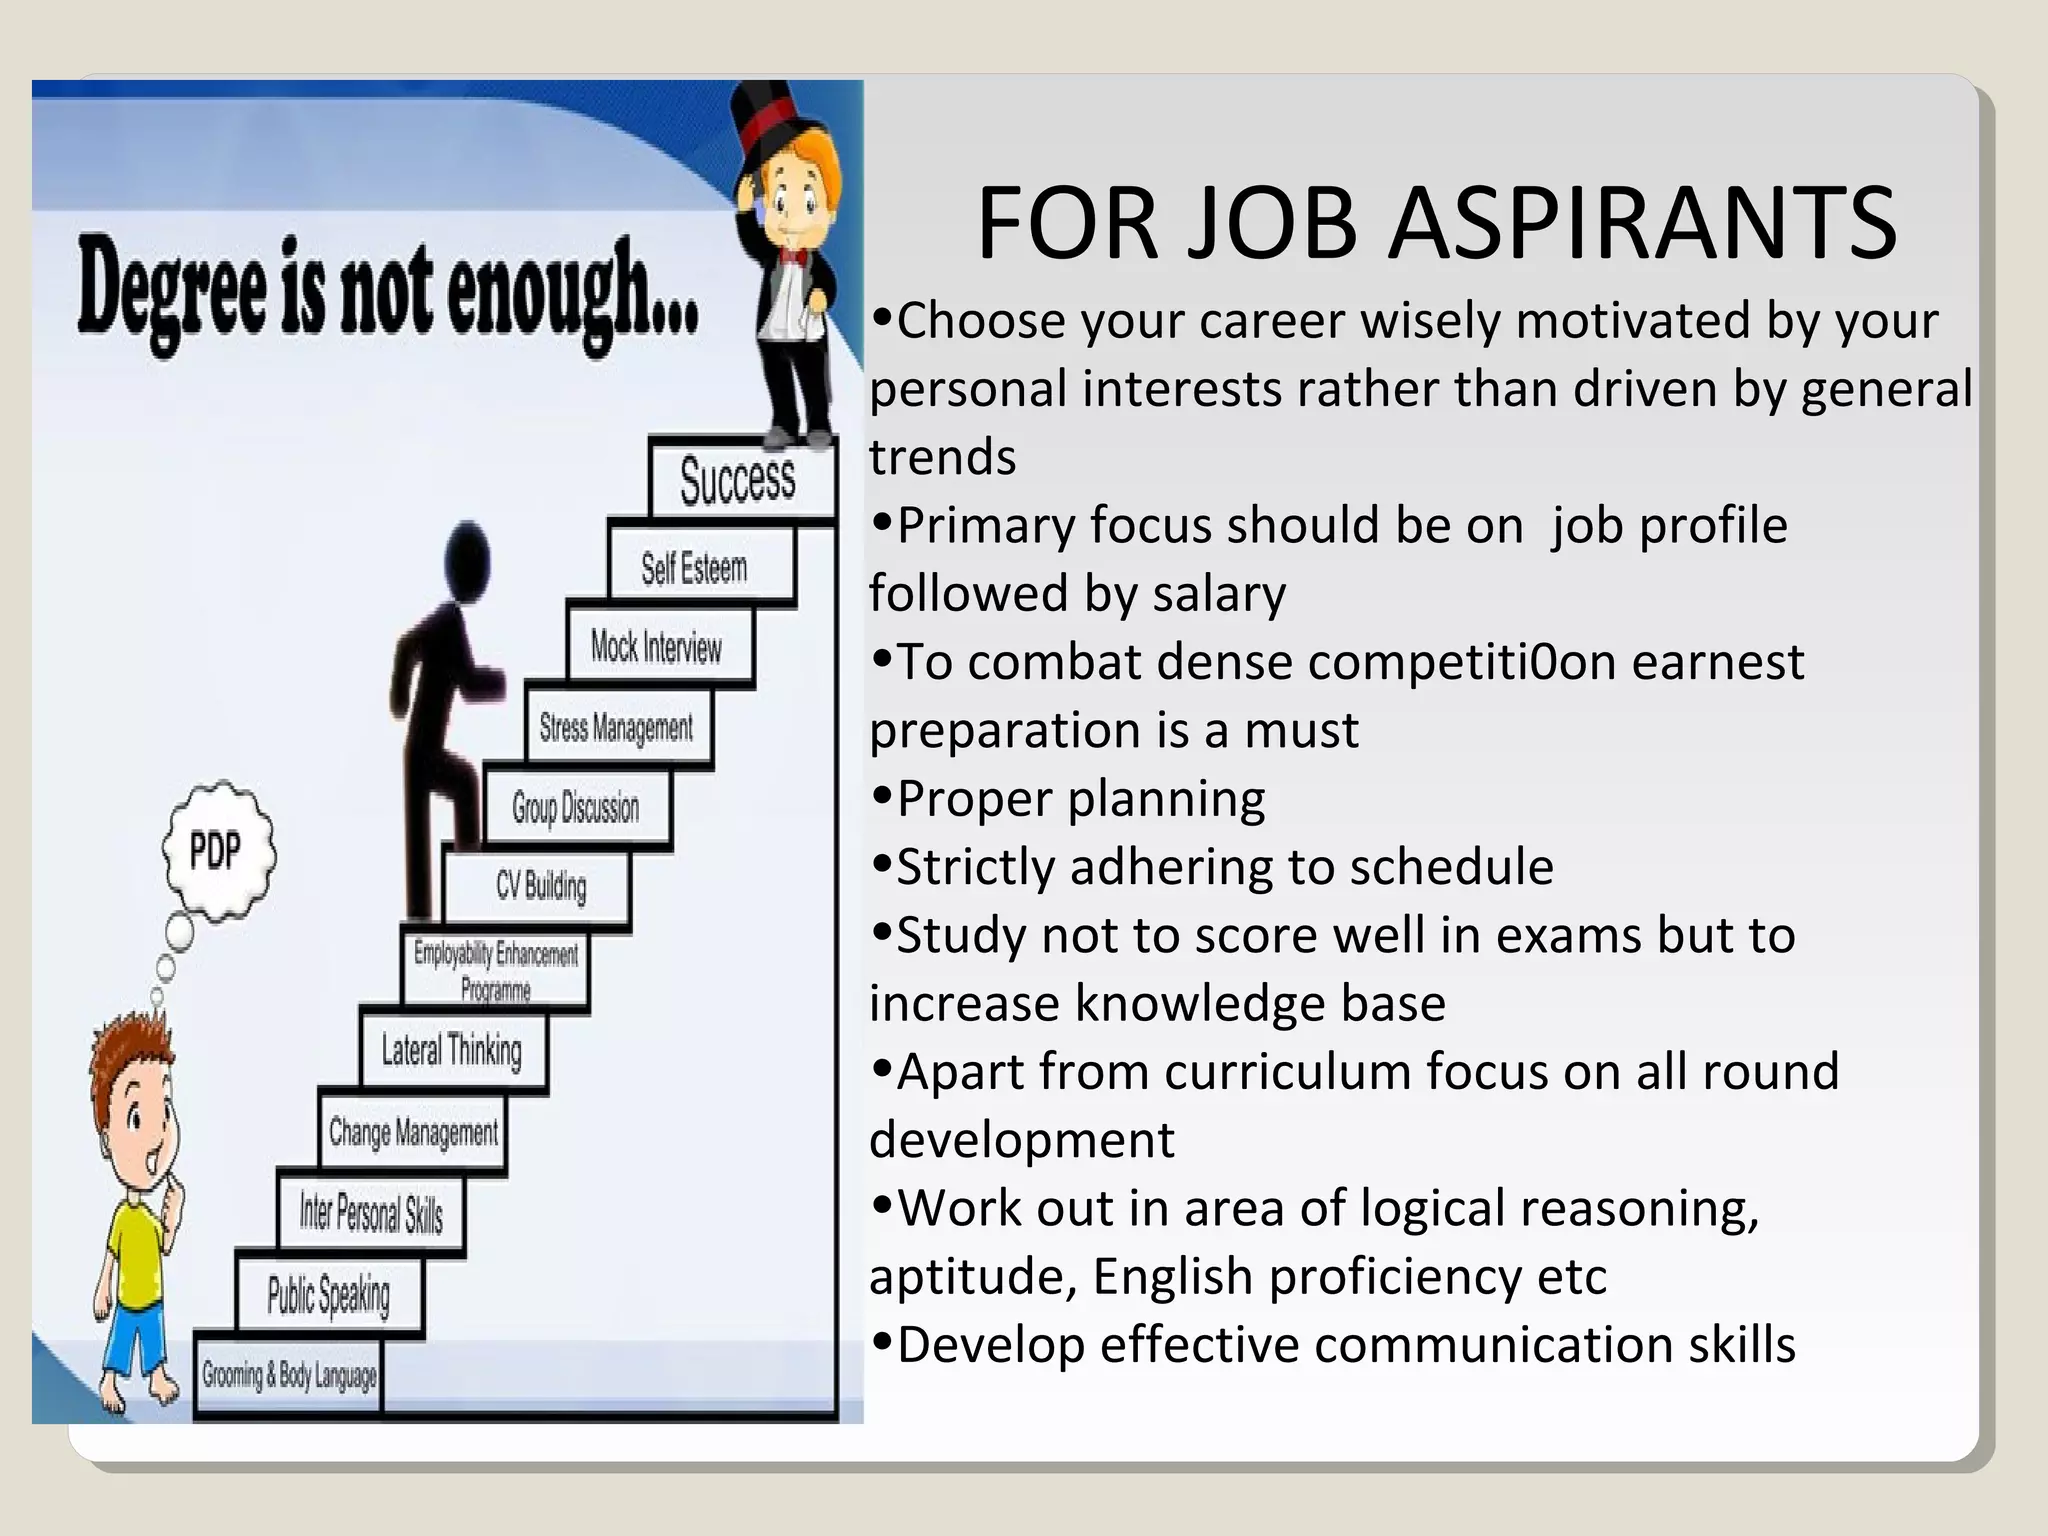
CAUSE EFFECT DIAGRAMCAUSE EFFECT DIAGRAM
FORFOR
POOR PLACEMENT OFPOOR PLACEMENT OF
STUDENTSSTUDENTS
Presented by
Ankita GuptaAnkita Gupta
Ankita PandeyAnkita Pandey
Akanksha RajputAkanksha Rajput
Students of Banasthali
University
B.Tech II year
Created in 1943 by Professor Kaoru
Ishikawa of Tokyo University and
adopted by Dr. W. Edwards Deming
A visual tool to identify, explore and
graphically display, in increasing detail,
all of the suspected possible causes
related to a problem or condition to
discover its root causes.
Not a quantitative tool
INTRODUCTION TOINTRODUCTION TO
CAUSE EFFECT DIAGRAMCAUSE EFFECT DIAGRAM
Causes Effect
Shows various influences on a process to identify
most likely root causes of problem
Problem
Main Category
Cause
Sub-Cause
Fishbone - Cause andFishbone - Cause and
Effect DiagramEffect Diagram
4
Why Use Cause &Why Use Cause &
Effect Diagrams?Effect Diagrams?
Focuses team on the content of the
problem
Creates a snapshot of the collective
knowledge of team
Creates consensus of the causes of a
problem
Builds support for resulting solutions
Focuses the team on causes not
symptoms
To discover the most probable causes
for further analysis
To visualize possible relationships
between causes for any problem current
or future
To pinpoint conditions causing customer
complaints, process errors or non-
conforming products
To provide focus for discussion
Use in OrganizationsUse in Organizations
Can be used to improve any product,
process, or service
◦ Any area of the company that is
experiencing a problem
◦ Isolates all relevant causes
Helps bring a problem into light
◦ Group discussion and brainstorming
◦ Finds reasons for quality variations,
and the relationships between them
CAUSE EFFECT DIAGRAMCAUSE EFFECT DIAGRAM
FOR POOR PLACEMENT OFFOR POOR PLACEMENT OF
STUDENTSSTUDENTS
Poor
Placement
Of
Students
QUALITY OF
EDUCATIONENVIRONMENT
CORPORATE
CULTURE SELF
Failure to
attract
companies
Quality faculty crunch
Dismal learning quality
No focus on research &
innovationTheoretical coverage
Underdeveloped infrastructure
Redundant course content
Poor administration
Tough economy
High population density
Excess competition
Insufficient job opportunities
Reservation
Low degree of
industrialization
No focus on employee
development
Demands
ready-to-
use
employee
Poor
alignment
b/w college
& corporate
culture
Costs slashing
tendency
Con recruiters
Lack of brand
names
Newly set up institutions
Lack of alumni base
Poor college
profile
Poor
aptitude
Poor personality
Following general
trends
Lack of soft skills
Poor talent
pool
Low pay to professors
Lack of dedication
Desperation of college
Needs of students
Poor English
proficiency
Lack of confidence
Lack of
general
awareness
Poor self assessment
Focus on pay package
Lack of preparations
Lack of seriousness
Lack of
professionalism
Reluctance to travel
Give up interests under pressure
RecommendedRecommended
solutions tosolutions to
overcome rootovercome root
causescauses
TO IMPROVE QUALITY
OF EUCATION
•Focus on product quality
•Update and retrain faculty in emerging global
perspectives
•Impart knowledge of latest technology and trends
•Train students to meet corporate expectations
•Eliminate inconsistent standards associated with
traditional processes of teaching.
•Provide adequate exposure to real world
problems
•Nurture academic excellence along with stress on
extra-curricular
TO INCREASE EMPLOYMENT
OPPORTUNITIES
•Industrialization
•Restricted import of finished goods
•Boost to manufacturing industries in the country
•Attract foreign direct investment
•Encourage entrepreneurship and self employment
TO ATTRACT MAJOR RECRUITERS
•Build up/improve/sustain college profile and reputation
•Set up acceptable eligibility standards for admissions
•Acquire important accreditations
•Use effective advertising
•Stress on development programmes, transparency and publicities the same
•Set up a placement committee comprising of experienced professionals
FOR RECRUITING
COMPANIES
•Focus on employee development
•Increase corporate participation for non placement
activities (e.g. Listed below) to align college and
•corporate culture
•industrial visits
•Industry sponsored projects
•Expert lectures
•College corporate communication
•Use the following techniques to minimize
costs in unearthing the talent
•Customized recruitment tests
•Video conferencing/ online portal
•Other latest technology
FOR JOB ASPIRANTS
•Choose your career wisely motivated by your
personal interests rather than driven by general
trends
•Primary focus should be on job profile
followed by salary
•To combat dense competiti0on earnest
preparation is a must
•Proper planning
•Strictly adhering to schedule
•Study not to score well in exams but to
increase knowledge base
•Apart from curriculum focus on all round
development
•Work out in area of logical reasoning,
aptitude, English proficiency etc
•Develop effective communication skills
Use fishbone diagram,
analysis and evaluations to
find causes that can be fixed
Take action to eliminate
and fix problem causes
To identify the relationship
between the effects in a
given situation and all of the
possible causes
Lessons Learned By The
Team
Used to improve any product, process,
or service
Important part of quality management
Coordination & cooperation among the
members.
Encouraging power of partners to
serve this energy well among each
other.
THANK YOUTHANK YOU

Qcl-14-v3 cause-effect diagram_banasthali university_ankita gupta

  • 1.
    CAUSE EFFECT DIAGRAMCAUSEEFFECT DIAGRAM FORFOR POOR PLACEMENT OFPOOR PLACEMENT OF STUDENTSSTUDENTS Presented by Ankita GuptaAnkita Gupta Ankita PandeyAnkita Pandey Akanksha RajputAkanksha Rajput Students of Banasthali University B.Tech II year
  • 2.
    Created in 1943by Professor Kaoru Ishikawa of Tokyo University and adopted by Dr. W. Edwards Deming A visual tool to identify, explore and graphically display, in increasing detail, all of the suspected possible causes related to a problem or condition to discover its root causes. Not a quantitative tool INTRODUCTION TOINTRODUCTION TO CAUSE EFFECT DIAGRAMCAUSE EFFECT DIAGRAM
  • 3.
    Causes Effect Shows variousinfluences on a process to identify most likely root causes of problem Problem Main Category Cause Sub-Cause Fishbone - Cause andFishbone - Cause and Effect DiagramEffect Diagram
  • 4.
    4 Why Use Cause&Why Use Cause & Effect Diagrams?Effect Diagrams? Focuses team on the content of the problem Creates a snapshot of the collective knowledge of team Creates consensus of the causes of a problem Builds support for resulting solutions Focuses the team on causes not symptoms
  • 5.
    To discover themost probable causes for further analysis To visualize possible relationships between causes for any problem current or future To pinpoint conditions causing customer complaints, process errors or non- conforming products To provide focus for discussion
  • 6.
    Use in OrganizationsUsein Organizations Can be used to improve any product, process, or service ◦ Any area of the company that is experiencing a problem ◦ Isolates all relevant causes Helps bring a problem into light ◦ Group discussion and brainstorming ◦ Finds reasons for quality variations, and the relationships between them
  • 7.
    CAUSE EFFECT DIAGRAMCAUSEEFFECT DIAGRAM FOR POOR PLACEMENT OFFOR POOR PLACEMENT OF STUDENTSSTUDENTS
  • 8.
    Poor Placement Of Students QUALITY OF EDUCATIONENVIRONMENT CORPORATE CULTURE SELF Failureto attract companies Quality faculty crunch Dismal learning quality No focus on research & innovationTheoretical coverage Underdeveloped infrastructure Redundant course content Poor administration Tough economy High population density Excess competition Insufficient job opportunities Reservation Low degree of industrialization No focus on employee development Demands ready-to- use employee Poor alignment b/w college & corporate culture Costs slashing tendency Con recruiters Lack of brand names Newly set up institutions Lack of alumni base Poor college profile Poor aptitude Poor personality Following general trends Lack of soft skills Poor talent pool Low pay to professors Lack of dedication Desperation of college Needs of students Poor English proficiency Lack of confidence Lack of general awareness Poor self assessment Focus on pay package Lack of preparations Lack of seriousness Lack of professionalism Reluctance to travel Give up interests under pressure
  • 9.
  • 10.
    TO IMPROVE QUALITY OFEUCATION •Focus on product quality •Update and retrain faculty in emerging global perspectives •Impart knowledge of latest technology and trends •Train students to meet corporate expectations •Eliminate inconsistent standards associated with traditional processes of teaching. •Provide adequate exposure to real world problems •Nurture academic excellence along with stress on extra-curricular
  • 11.
    TO INCREASE EMPLOYMENT OPPORTUNITIES •Industrialization •Restrictedimport of finished goods •Boost to manufacturing industries in the country •Attract foreign direct investment •Encourage entrepreneurship and self employment
  • 12.
    TO ATTRACT MAJORRECRUITERS •Build up/improve/sustain college profile and reputation •Set up acceptable eligibility standards for admissions •Acquire important accreditations •Use effective advertising •Stress on development programmes, transparency and publicities the same •Set up a placement committee comprising of experienced professionals
  • 13.
    FOR RECRUITING COMPANIES •Focus onemployee development •Increase corporate participation for non placement activities (e.g. Listed below) to align college and •corporate culture •industrial visits •Industry sponsored projects •Expert lectures •College corporate communication •Use the following techniques to minimize costs in unearthing the talent •Customized recruitment tests •Video conferencing/ online portal •Other latest technology
  • 14.
    FOR JOB ASPIRANTS •Chooseyour career wisely motivated by your personal interests rather than driven by general trends •Primary focus should be on job profile followed by salary •To combat dense competiti0on earnest preparation is a must •Proper planning •Strictly adhering to schedule •Study not to score well in exams but to increase knowledge base •Apart from curriculum focus on all round development •Work out in area of logical reasoning, aptitude, English proficiency etc •Develop effective communication skills
  • 15.
    Use fishbone diagram, analysisand evaluations to find causes that can be fixed Take action to eliminate and fix problem causes To identify the relationship between the effects in a given situation and all of the possible causes Lessons Learned By The Team
  • 16.
    Used to improveany product, process, or service Important part of quality management Coordination & cooperation among the members. Encouraging power of partners to serve this energy well among each other.
  • 17.