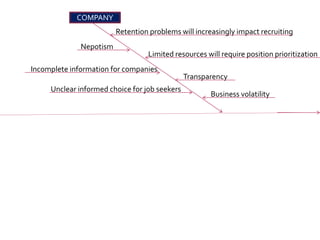
The document discusses a cause-effect diagram, also known as an Ishikawa or fishbone diagram, which is a tool used to identify and display potential causes of a problem or quality characteristic. It then provides an example cause-effect diagram analyzing the root causes of poor student placement. Some of the key causes identified include lack of student interest, poor soft skills, inadequate advising and career counseling, and limited course offerings. Finally, the conclusion states that creating this diagram increased understanding of the various factors responsible for poor student placement outcomes.


![Qcl 14-v3 [cause-effect_diagram]_[banathali_university]_[suyashi_rastogi]](https://cdn.slidesharecdn.com/ss_thumbnails/qcl-14-v3causeeffectdiagrambanathaliuniversitysuyashirastogi-141231044432-conversion-gate02-thumbnail.jpg?width=640&height=640&fit=bounds)
![Qcl 14-v3 [cause effect diagram-poor placement of students]-[banasthali unive...](https://cdn.slidesharecdn.com/ss_thumbnails/qcl-14-v3causeeffectdiagram-poorplacementofstudentsbanasthaliuniversityanshuverma-150110071924-conversion-gate01-thumbnail.jpg?width=640&height=640&fit=bounds)
![Qcl 14-v3[poor placement of student][banasthali university][reena arora]](https://cdn.slidesharecdn.com/ss_thumbnails/zlvionbftwq8djfu6dfz-signature-b580c36e7d924df6586b0b48da1b1c5c3e3b1dd34b587a65c370f4b6f8b2a2d4-poli-150103131548-conversion-gate02-thumbnail.jpg?width=640&height=640&fit=bounds)


![Qcl 14-v3 [cause-effect diagram]-[parinita dwivedi]_[banasthali university]](https://cdn.slidesharecdn.com/ss_thumbnails/qcl-14-v3cause-effectdiagramparinitadwivedibanasthaliuniversity-150117081348-conversion-gate02-thumbnail.jpg?width=640&height=640&fit=bounds)

![Qcl-14-v3_[cause-effectdiagram]_[banasthali university]_[Anu Vashisth]](https://cdn.slidesharecdn.com/ss_thumbnails/tl0575bjsy6avubkgosu-signature-5571bd2d1581c15a8f4867a498d476825e544c5a756e7b18a7145531bdb1a386-poli-141228034240-conversion-gate02-thumbnail.jpg?width=640&height=640&fit=bounds)


![Qcl 15-v4 [3]-[banasthali university]_[prabh simran kaur]](https://cdn.slidesharecdn.com/ss_thumbnails/qcl-14-v3cause-effectdiagrampoorplacementbanasthaliuniversityprabhsimrankaur-150113031047-conversion-gate01-thumbnail.jpg?width=640&height=640&fit=bounds)
![Qcl 14-v3 [cause and effect]-[nitie]_[ravali preethi]](https://cdn.slidesharecdn.com/ss_thumbnails/clksqxkhrryopxtkaslw-signature-f9e297912638ccb045e2894ba848aee3339ad56ea8fadc2b9bf14b5c8b979f49-poli-141226020446-conversion-gate02-thumbnail.jpg?width=640&height=640&fit=bounds)
![QCL-14-v3_[Cause effect diagram]_[Banasthali University]_[Radhika Sharma]](https://cdn.slidesharecdn.com/ss_thumbnails/chlng3-141231094901-conversion-gate02-thumbnail.jpg?width=640&height=640&fit=bounds)

![Qcl 14-v3 [cause-effect-diagram]-[banasthali university]_[devanshi agarwal] (1)](https://cdn.slidesharecdn.com/ss_thumbnails/qcl-14-v3cause-effect-diagrambanasthaliuniversitydevanshiagarwal1-150115005645-conversion-gate02-thumbnail.jpg?width=640&height=640&fit=bounds)
![Qcl 14-v3 [cause effect diagram on poor placement of students]-[banasthali vi...](https://cdn.slidesharecdn.com/ss_thumbnails/qcl-14-v3causeeffectdiagramonpoorplacementofstudentsbanasthalividyapithswatisharma-141228022342-conversion-gate01-thumbnail.jpg?width=640&height=640&fit=bounds)
![QCL-14-V3_[FISHBONEDIAGRAM(POORPLACEMENTOF STUDENTS]_[BANASTHALIUNIVERSITY]_[...](https://cdn.slidesharecdn.com/ss_thumbnails/poorplacement-150117112015-conversion-gate02-thumbnail.jpg?width=640&height=640&fit=bounds)
![QCL-14-V3_[FISHBONEDIAGRAM(POORPLACEMENT)]_[BANASTHALIUNIVERSITY]_[GARIMASRIV...](https://cdn.slidesharecdn.com/ss_thumbnails/poorplacement-150117113536-conversion-gate02-thumbnail.jpg?width=640&height=640&fit=bounds)
![Qcl 14-v3[cause effect diagram] [banasthali university]-[kumari shalini]](https://cdn.slidesharecdn.com/ss_thumbnails/qcl-14-v3causeeffectdiagrambanasthaliuniversitykumarishalini-150117070418-conversion-gate01-thumbnail.jpg?width=640&height=640&fit=bounds)
![Qcl 14-v3 [cause-effect diagram]-[banasthali university]_[shreya gupta]](https://cdn.slidesharecdn.com/ss_thumbnails/qcl-14-v3cause-effectdiagrambanasthaliuniversityshreyagupta-150121060516-conversion-gate01-thumbnail.jpg?width=640&height=640&fit=bounds)


