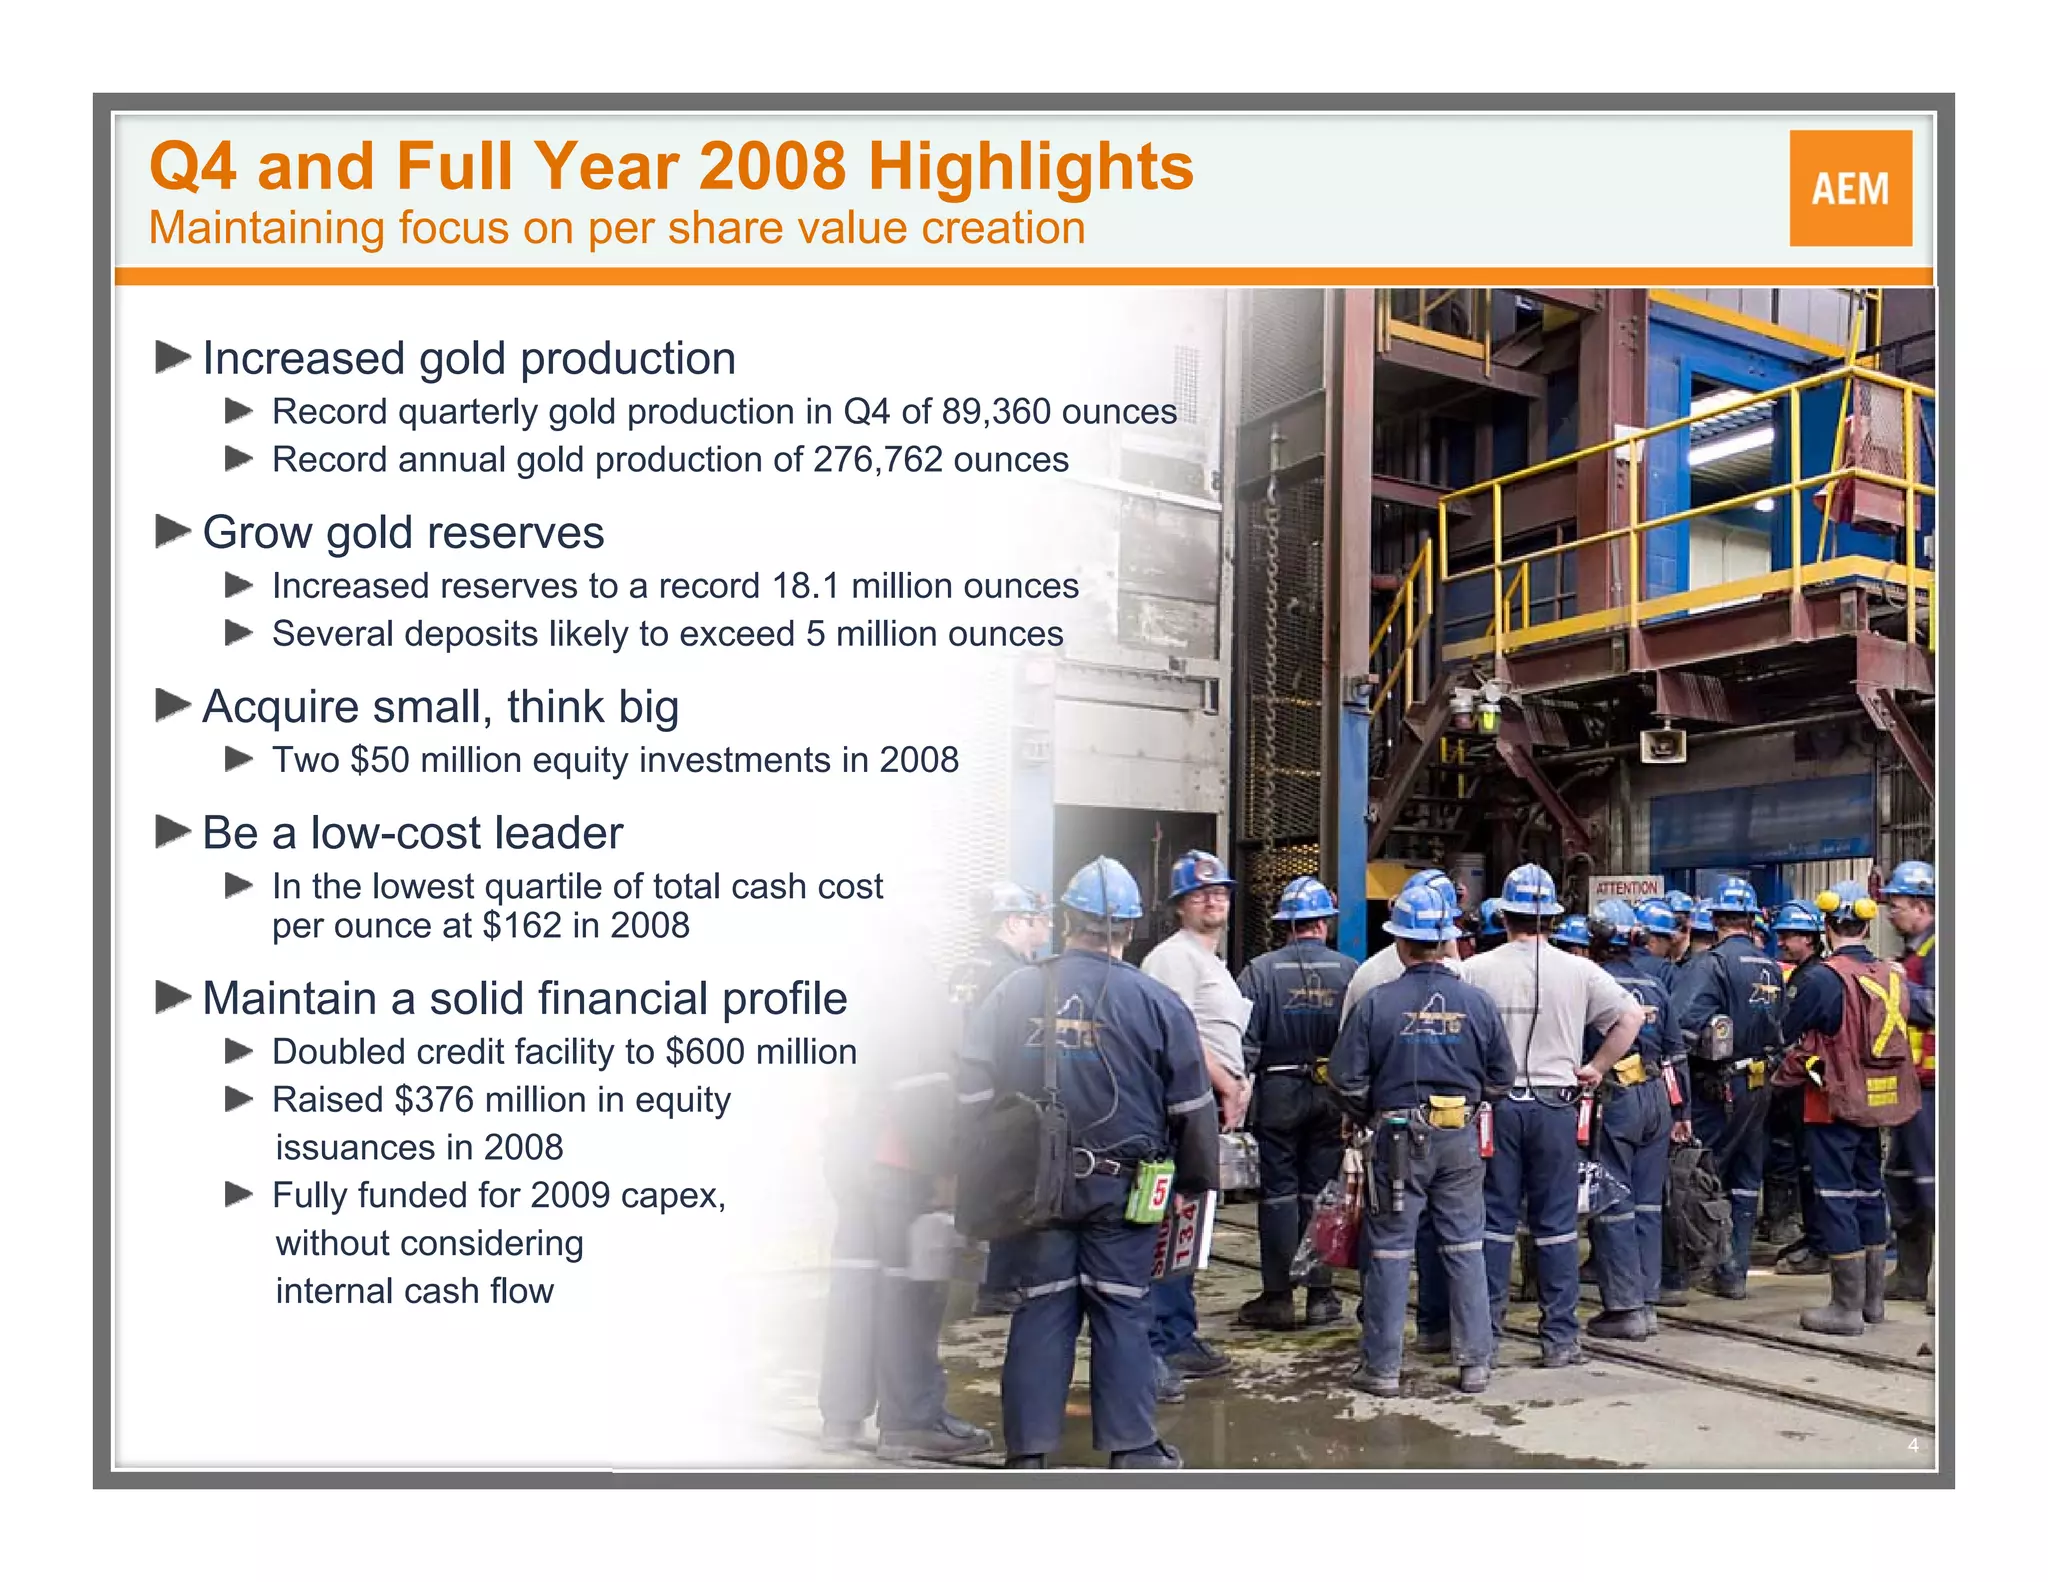
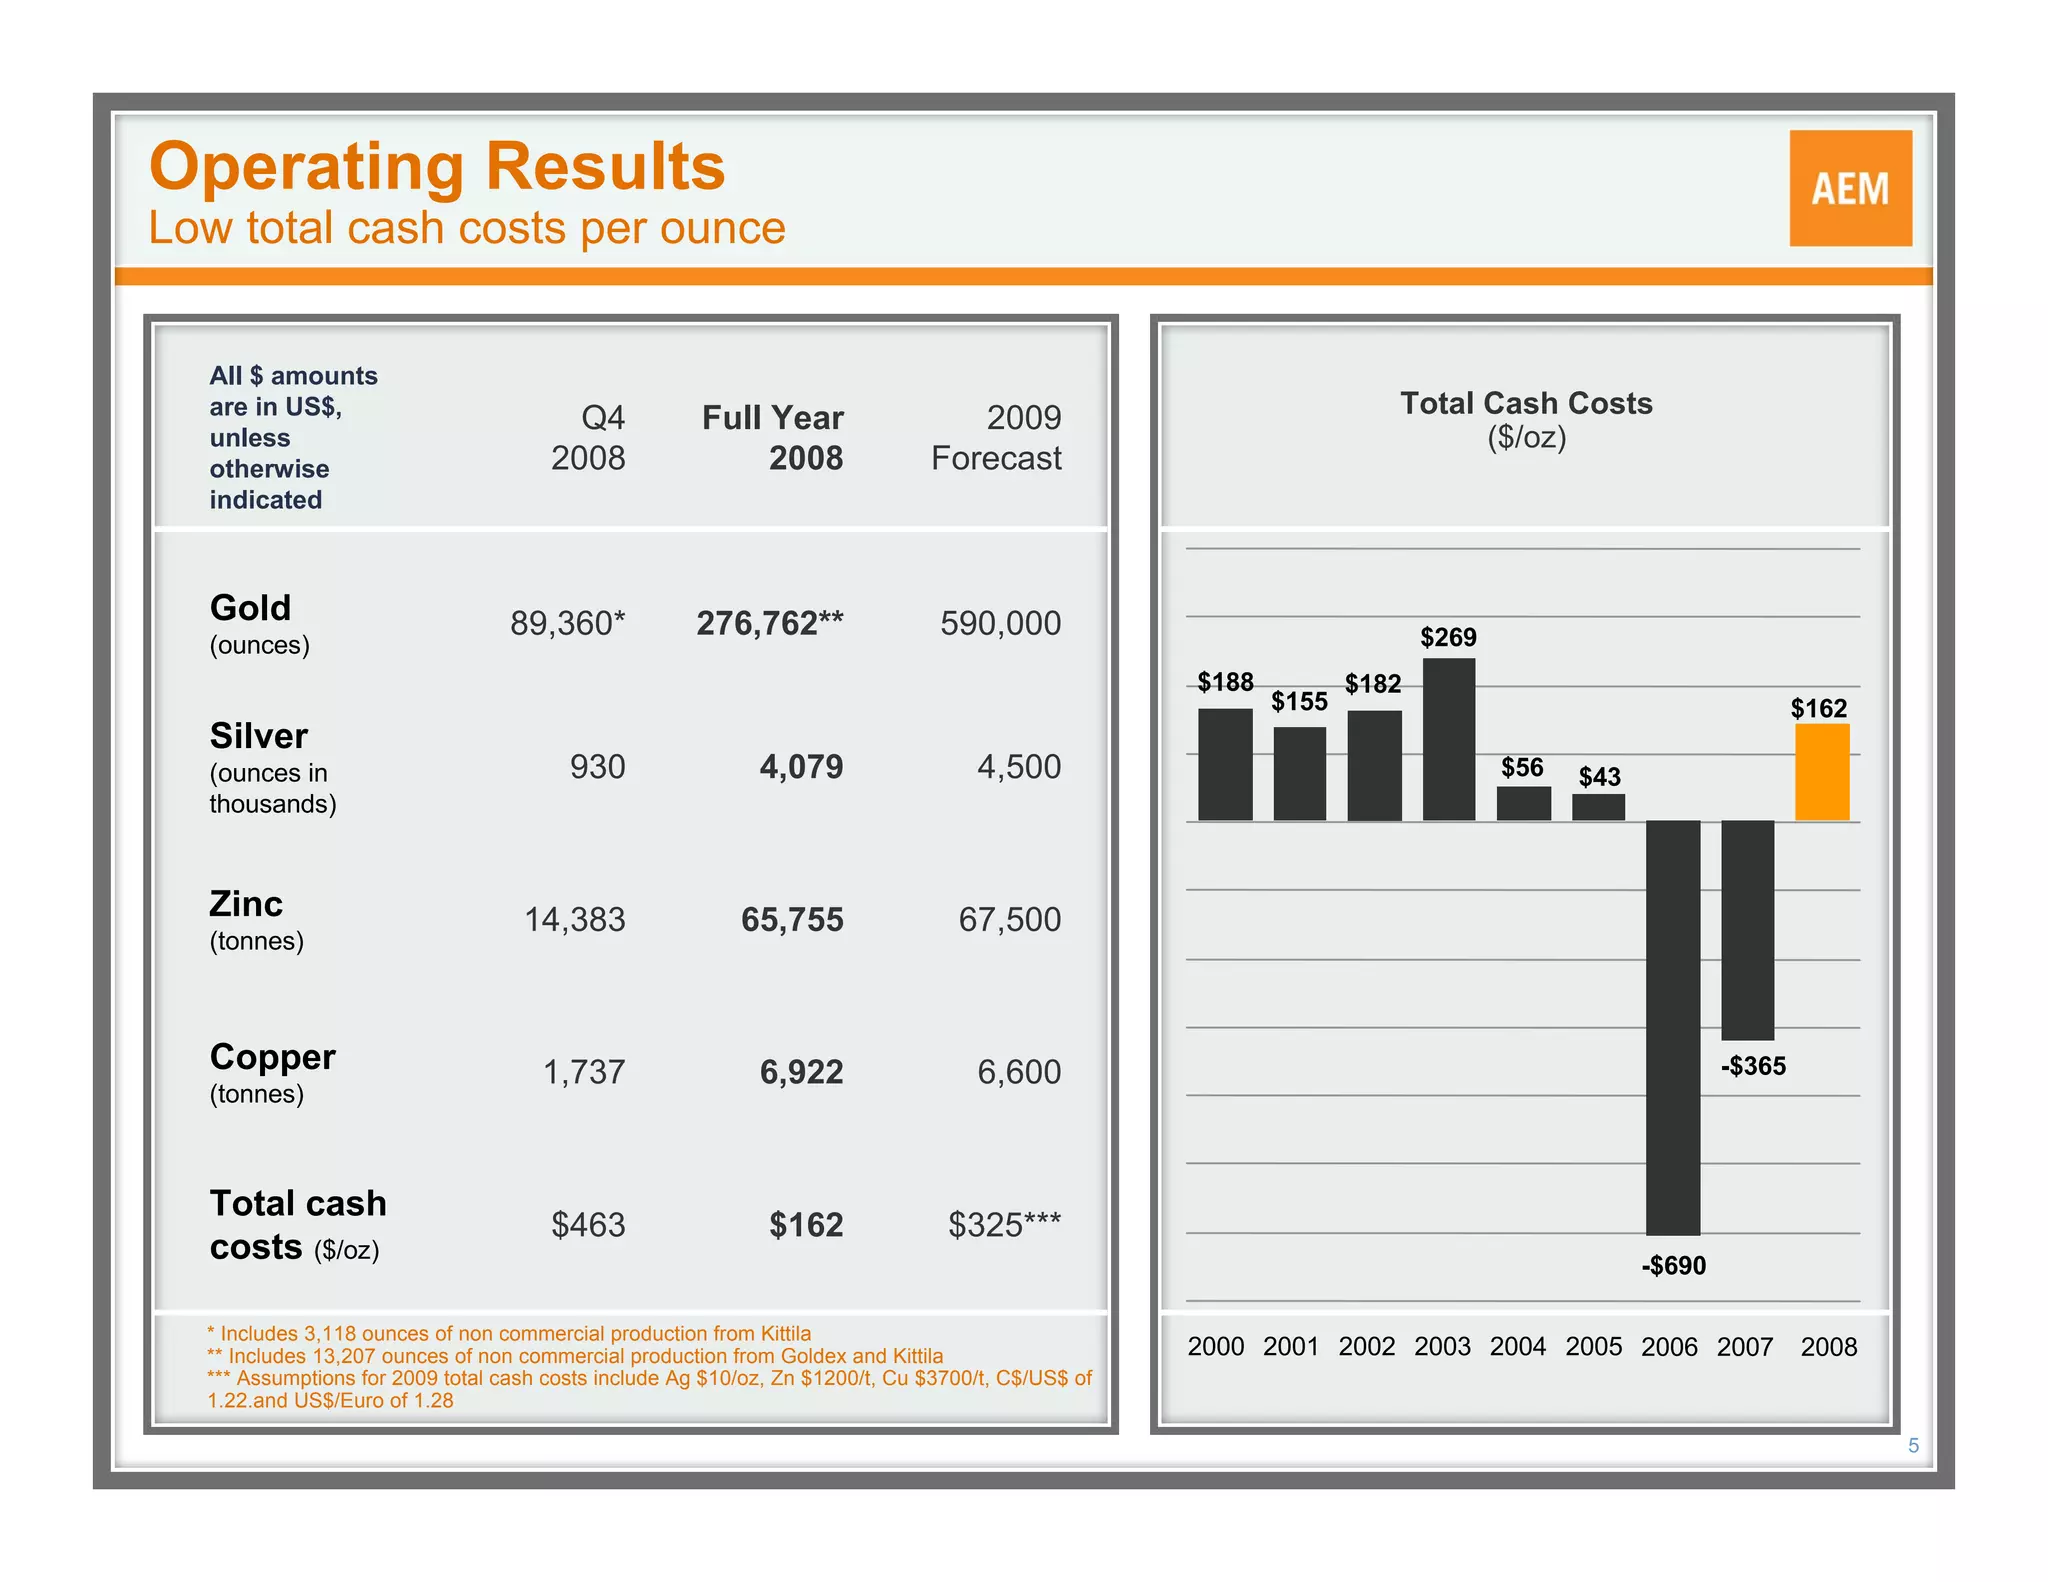
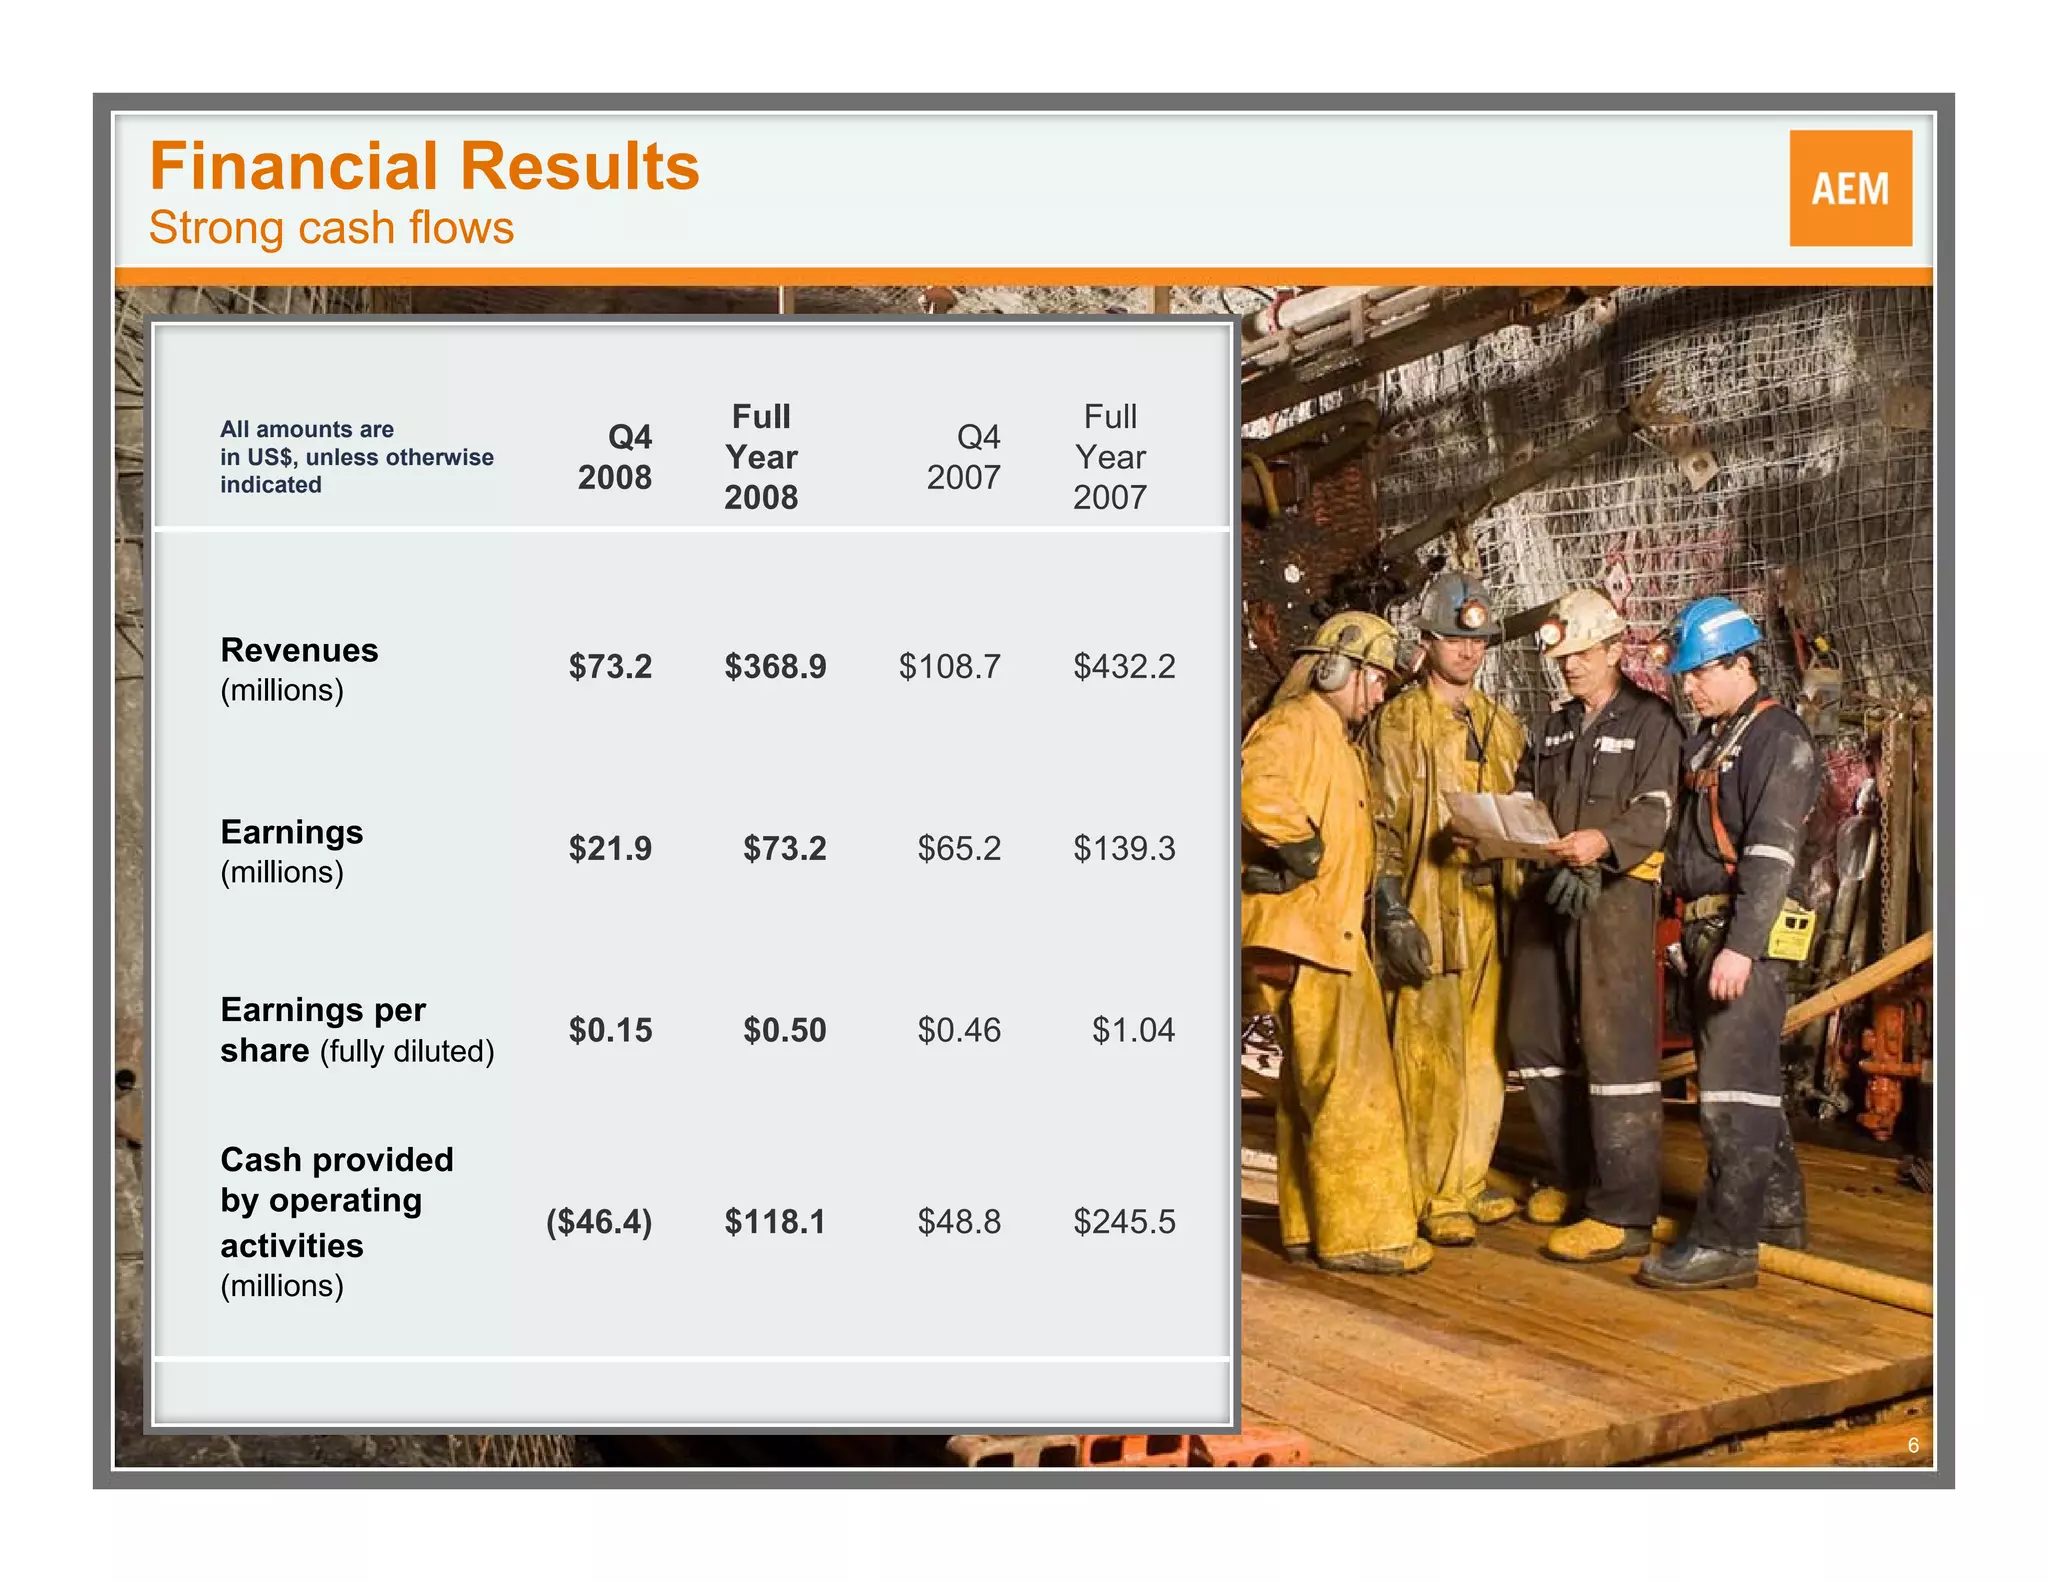
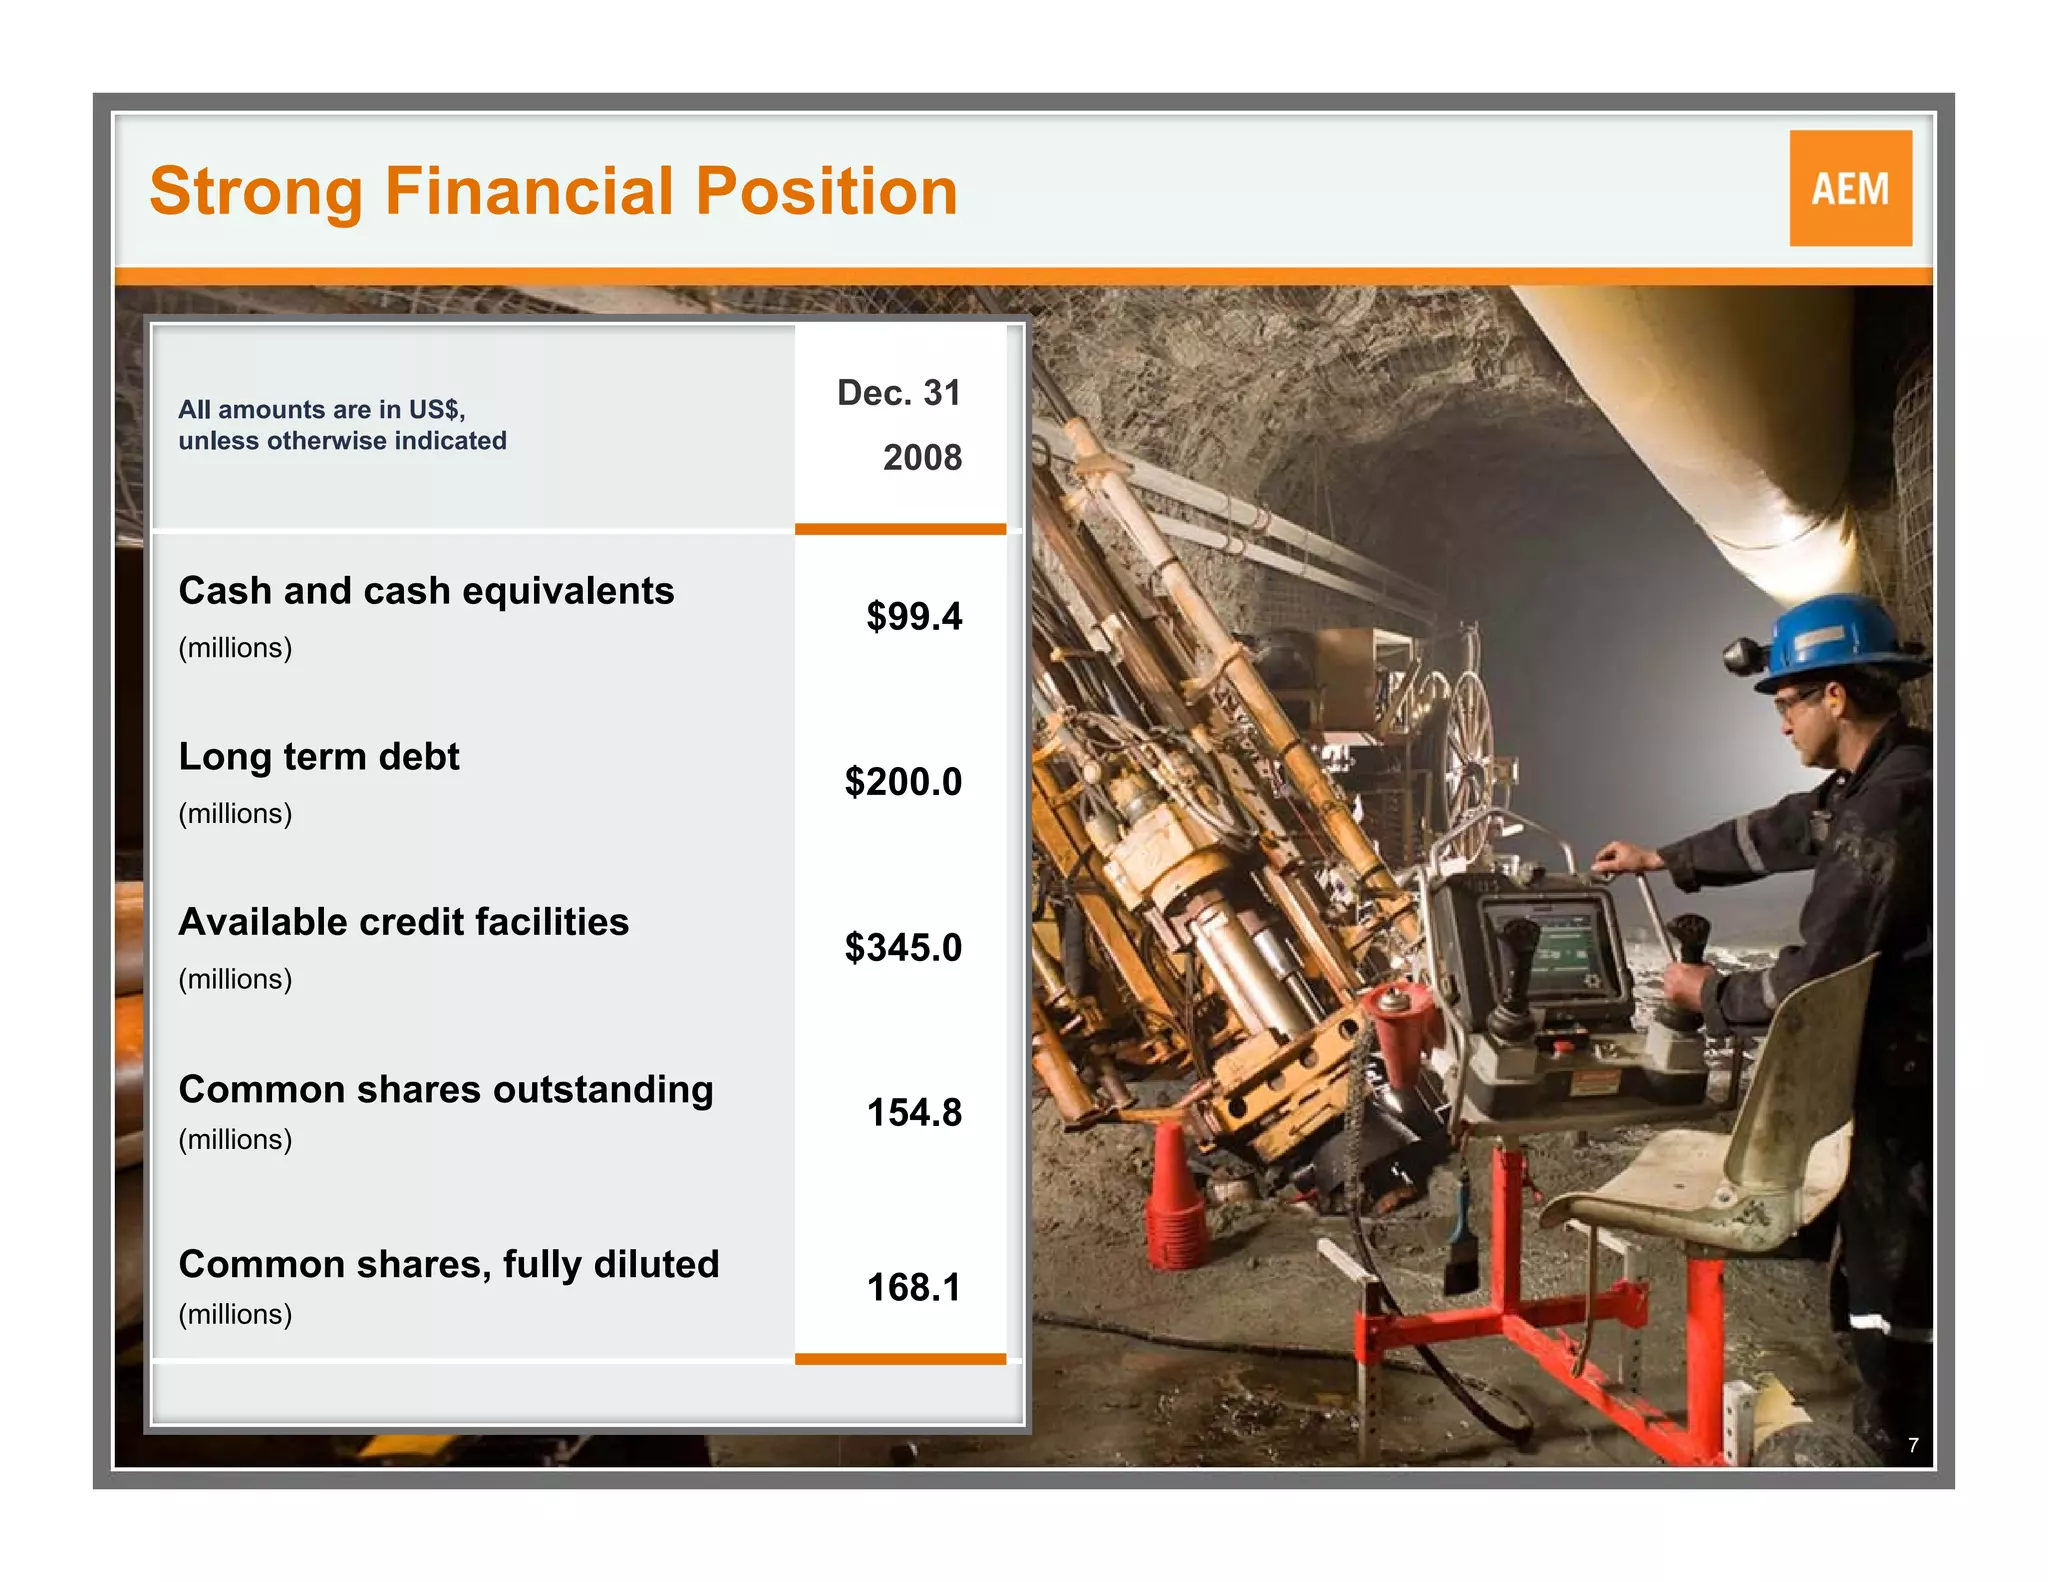
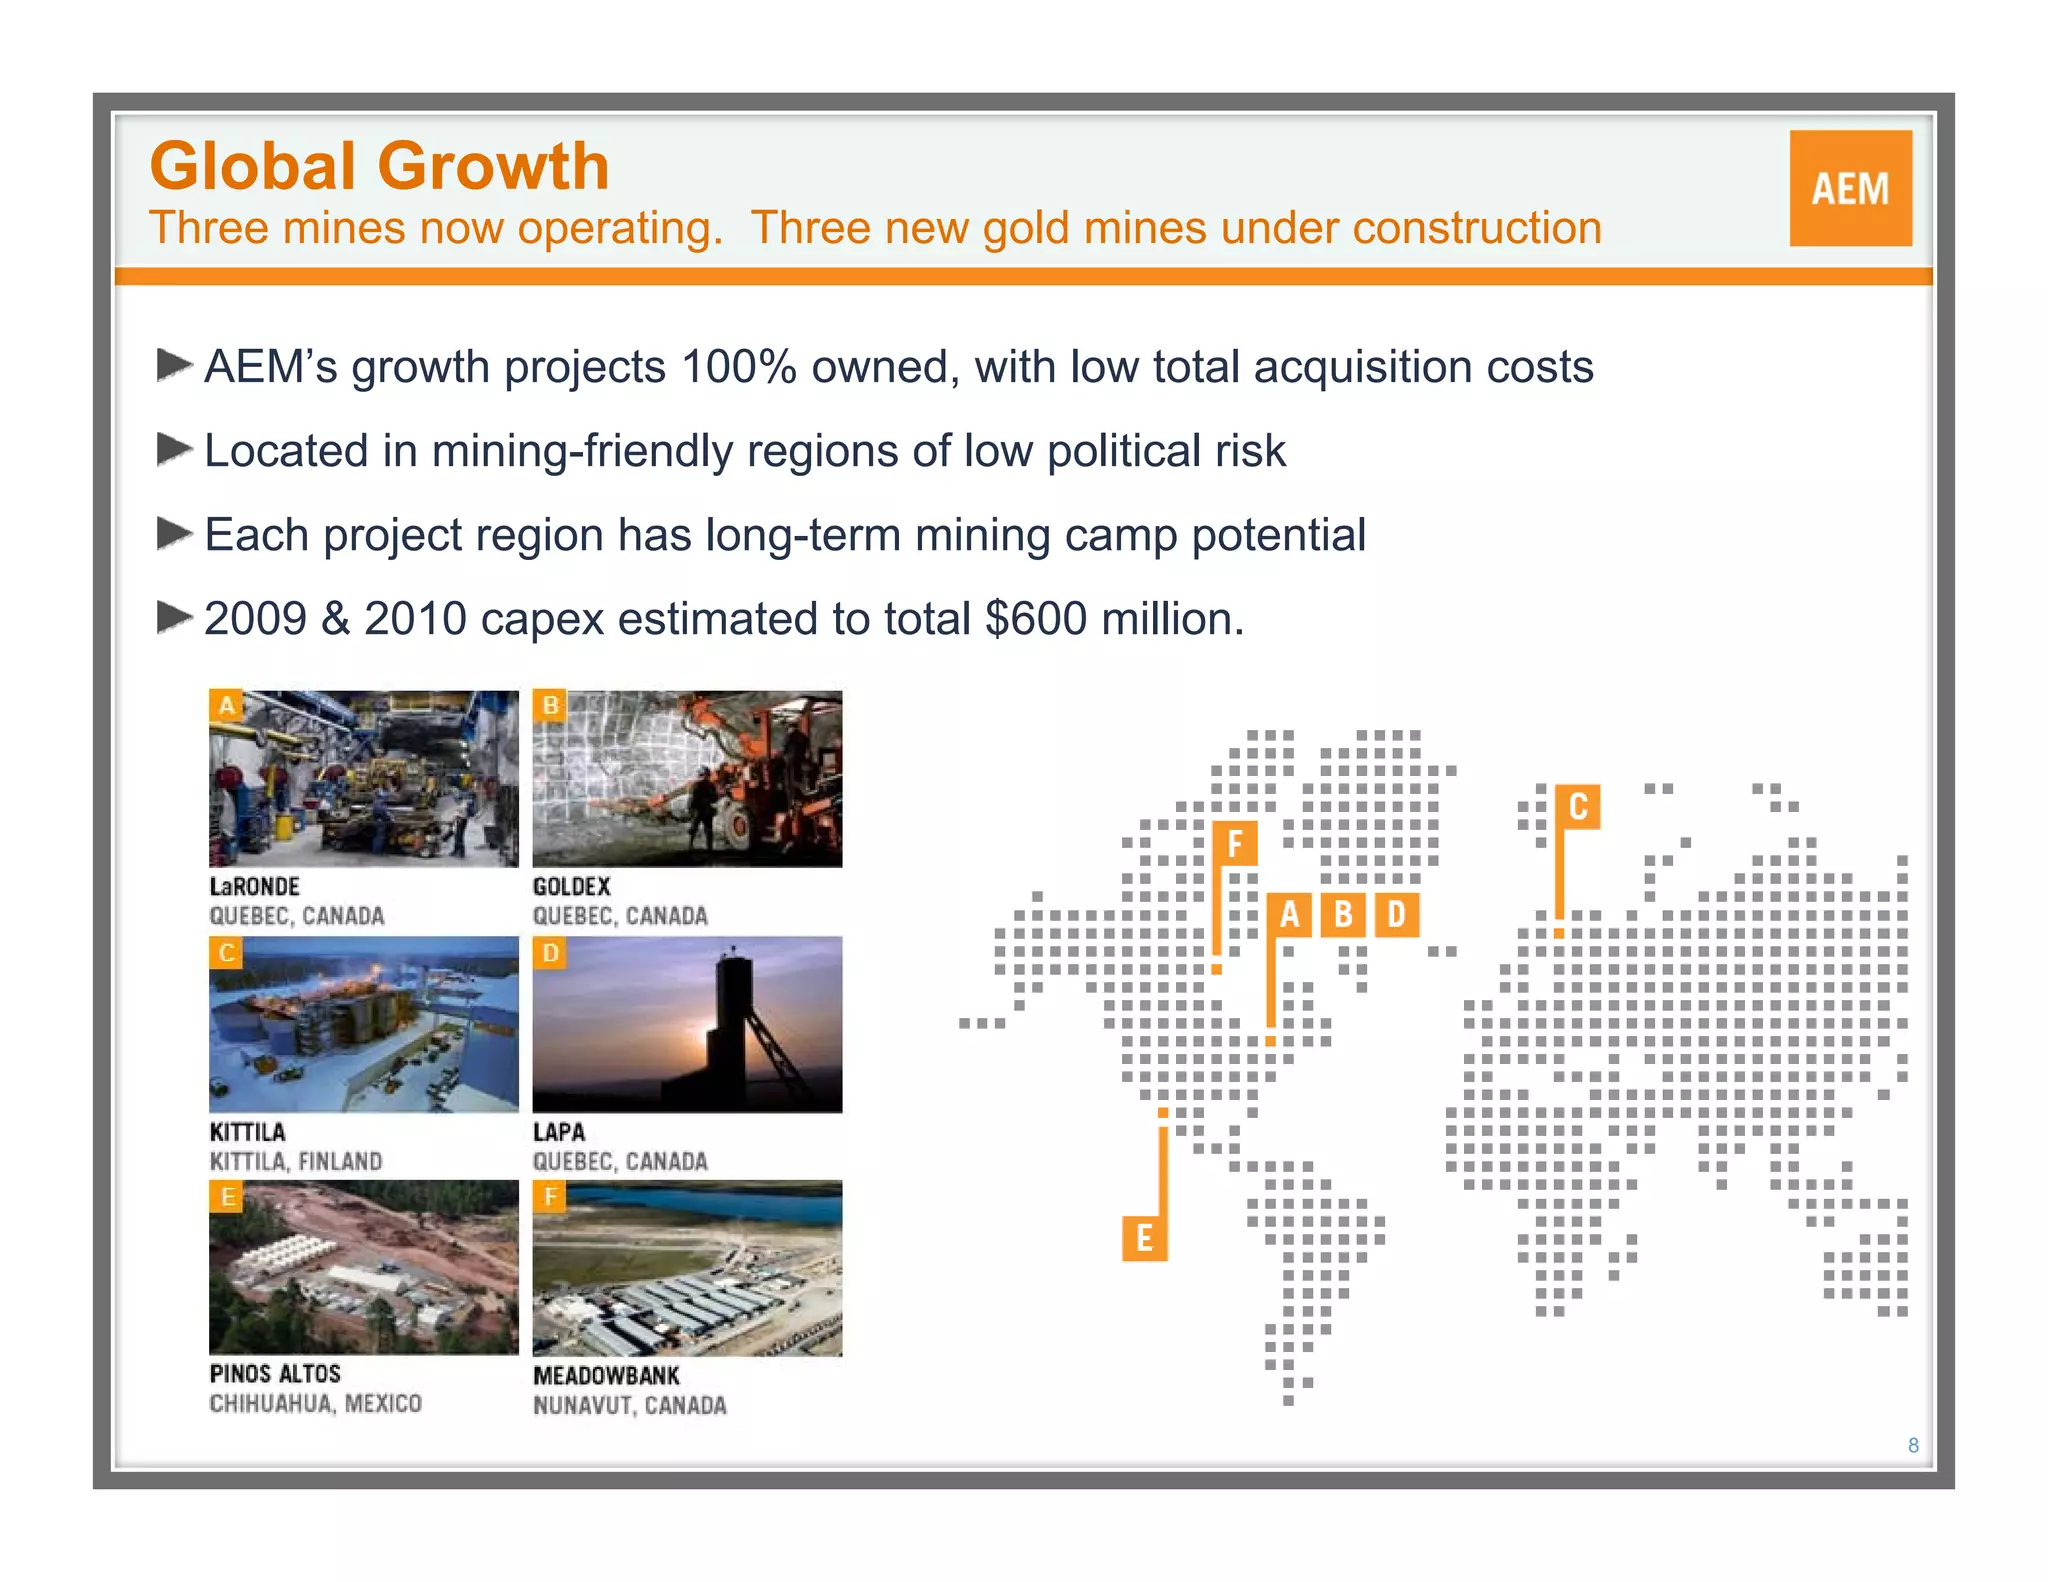
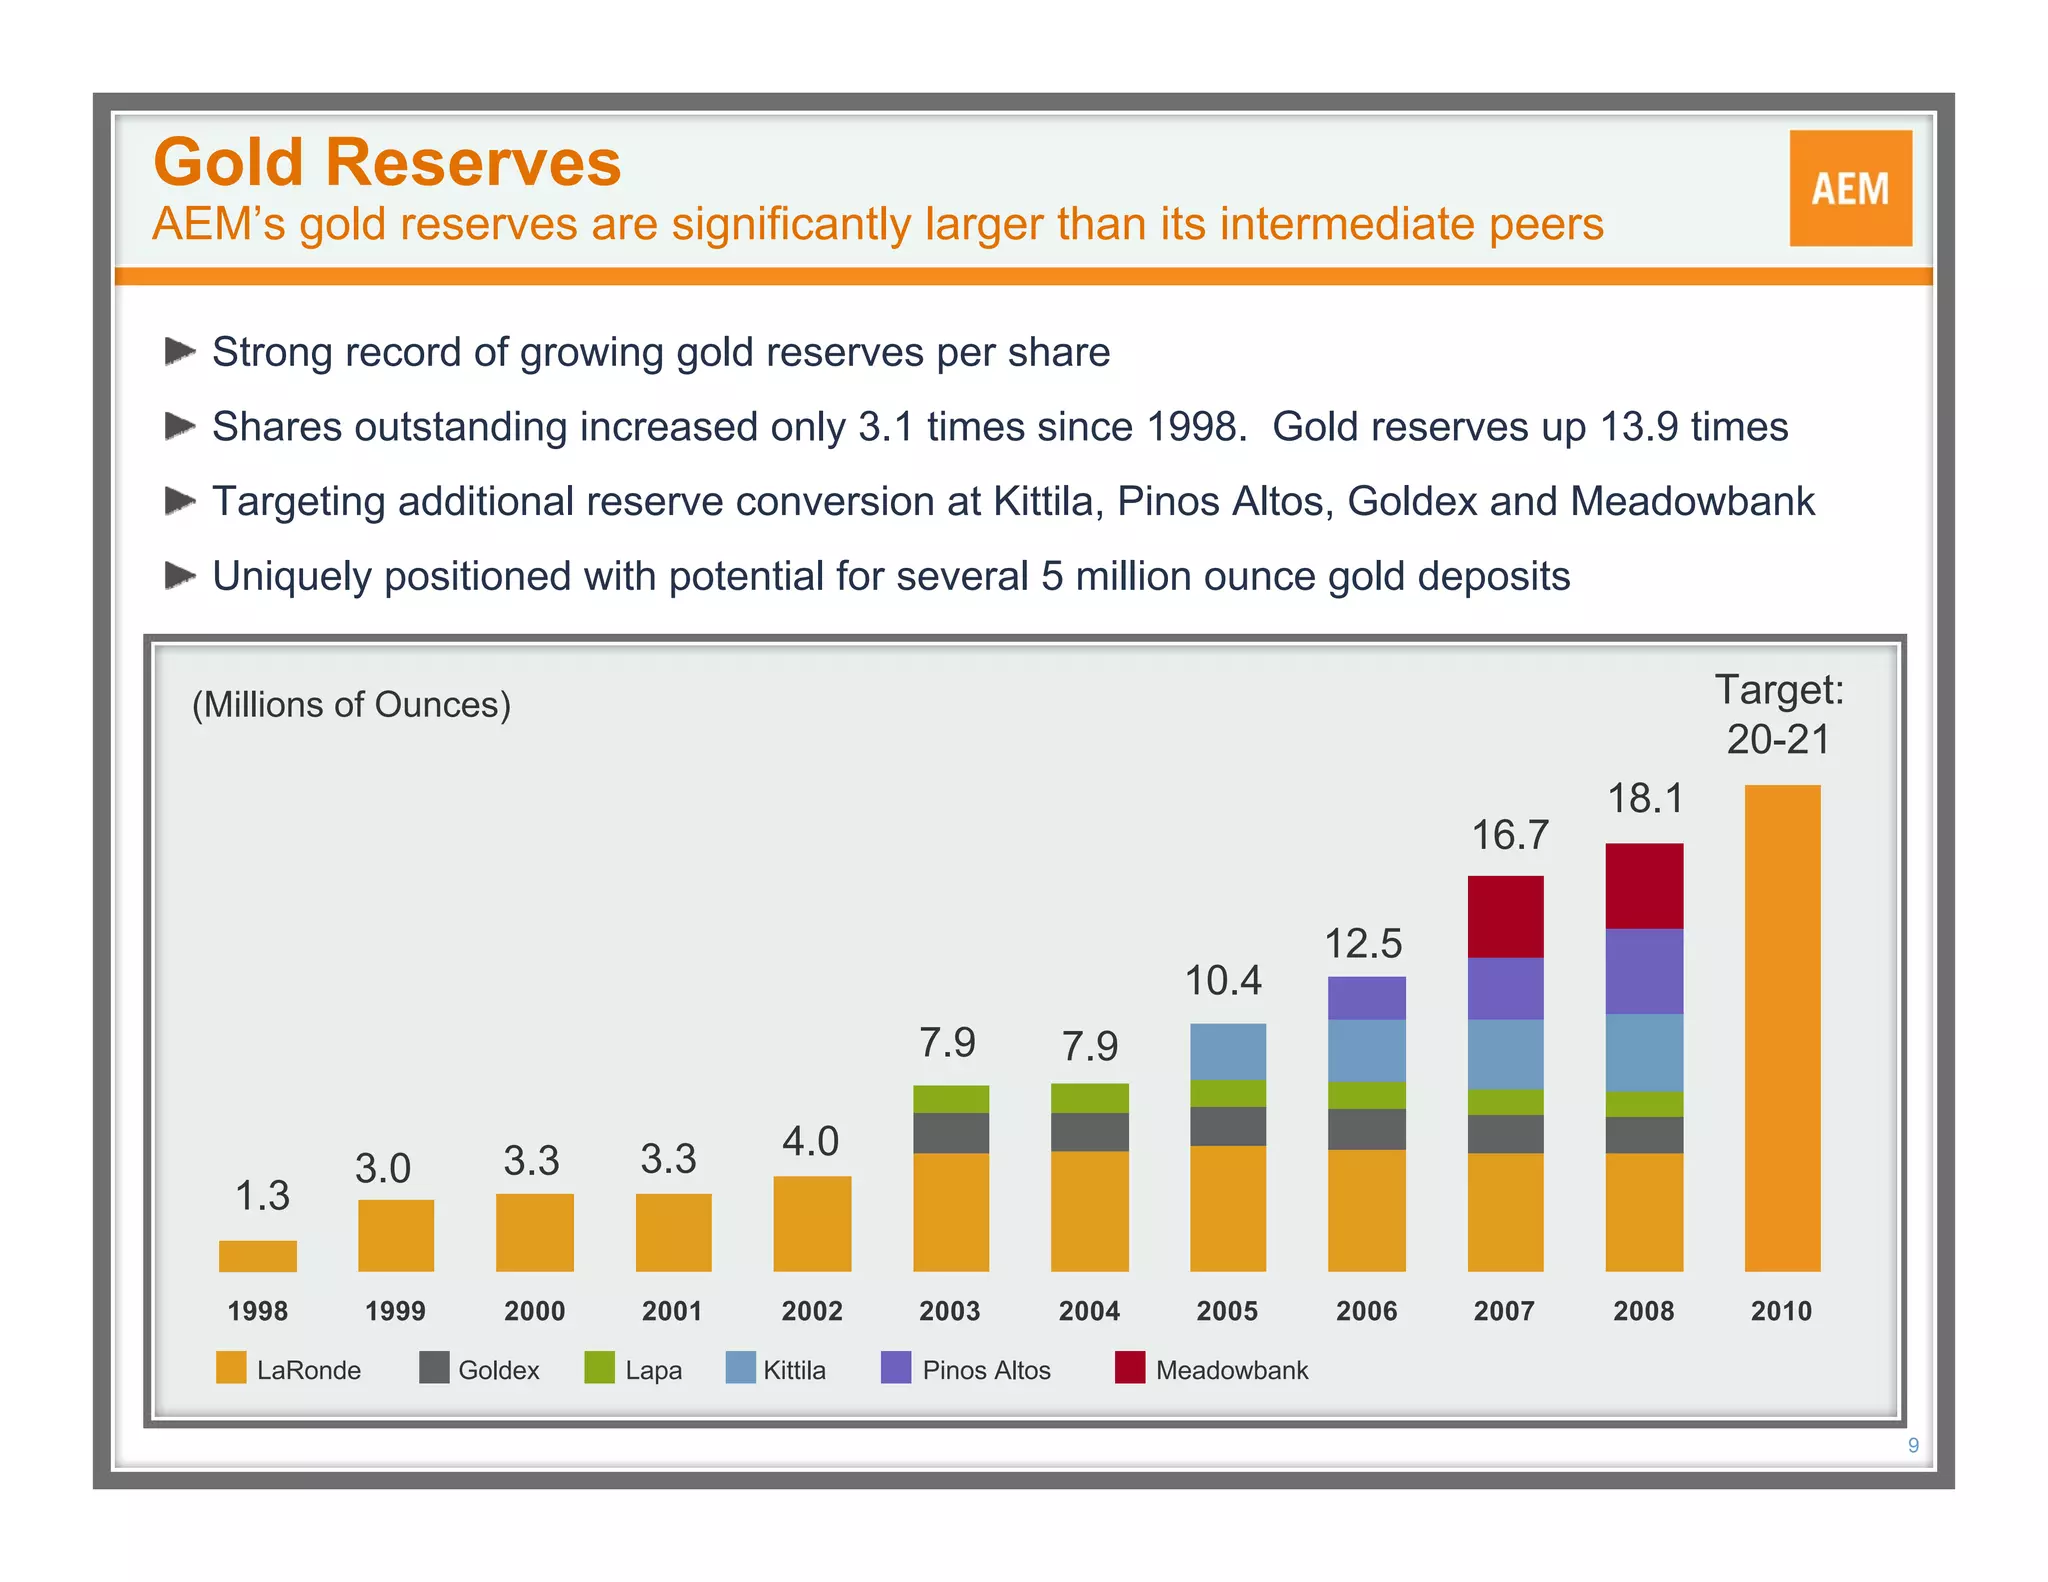
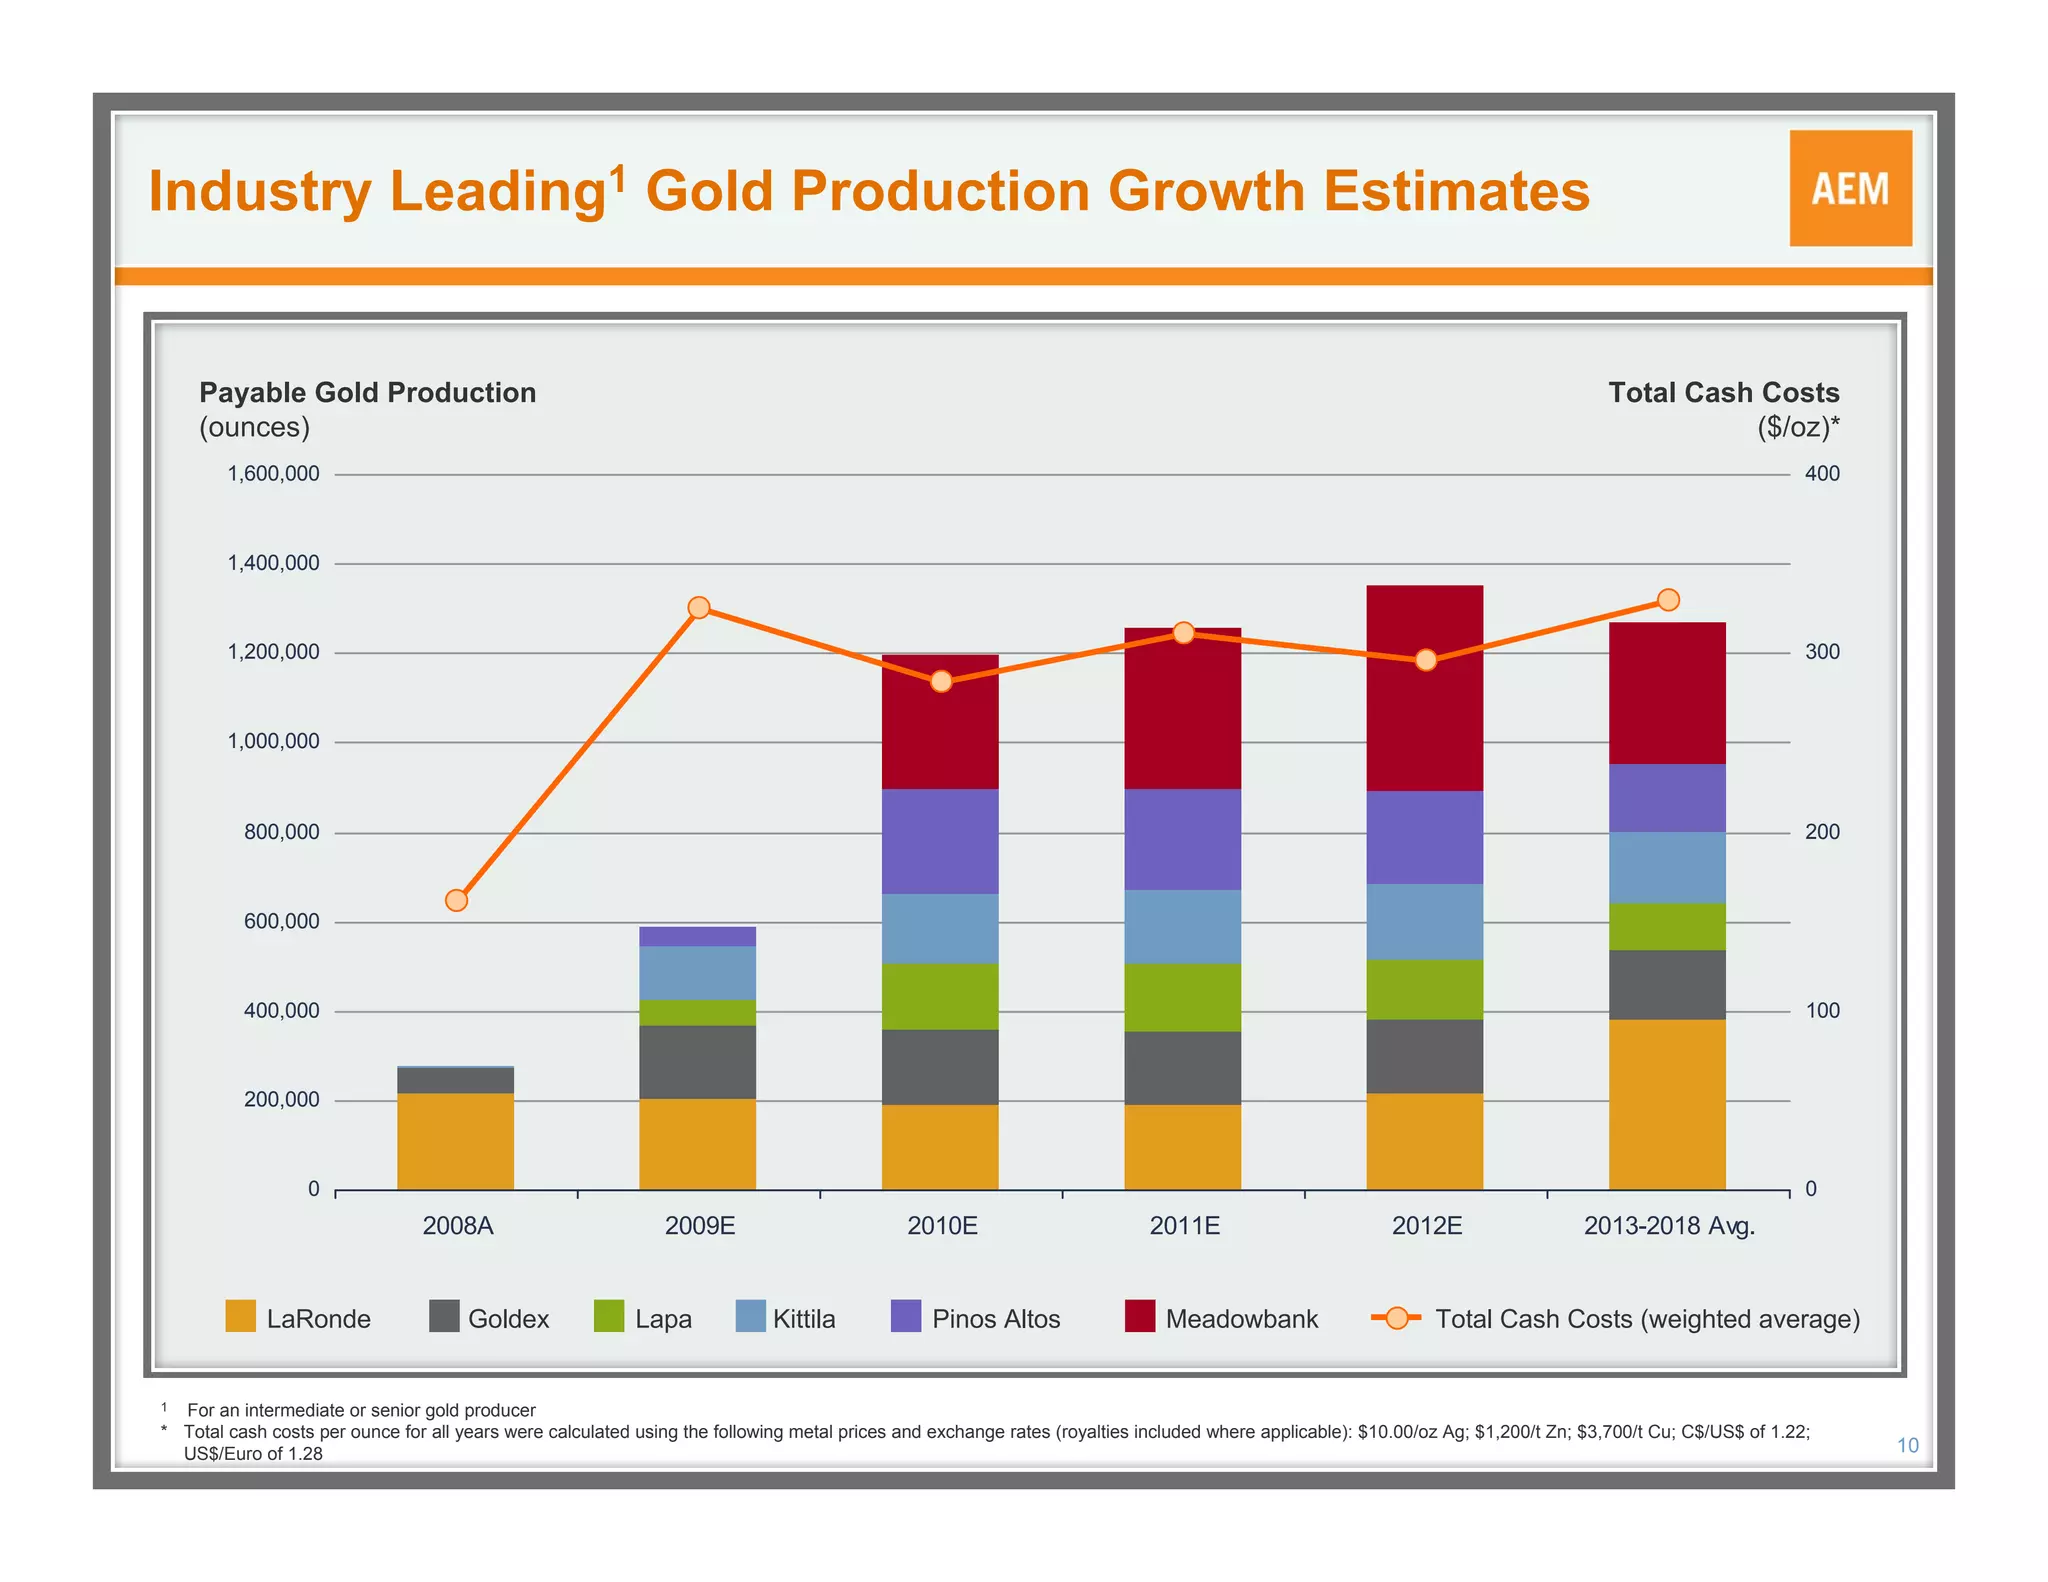
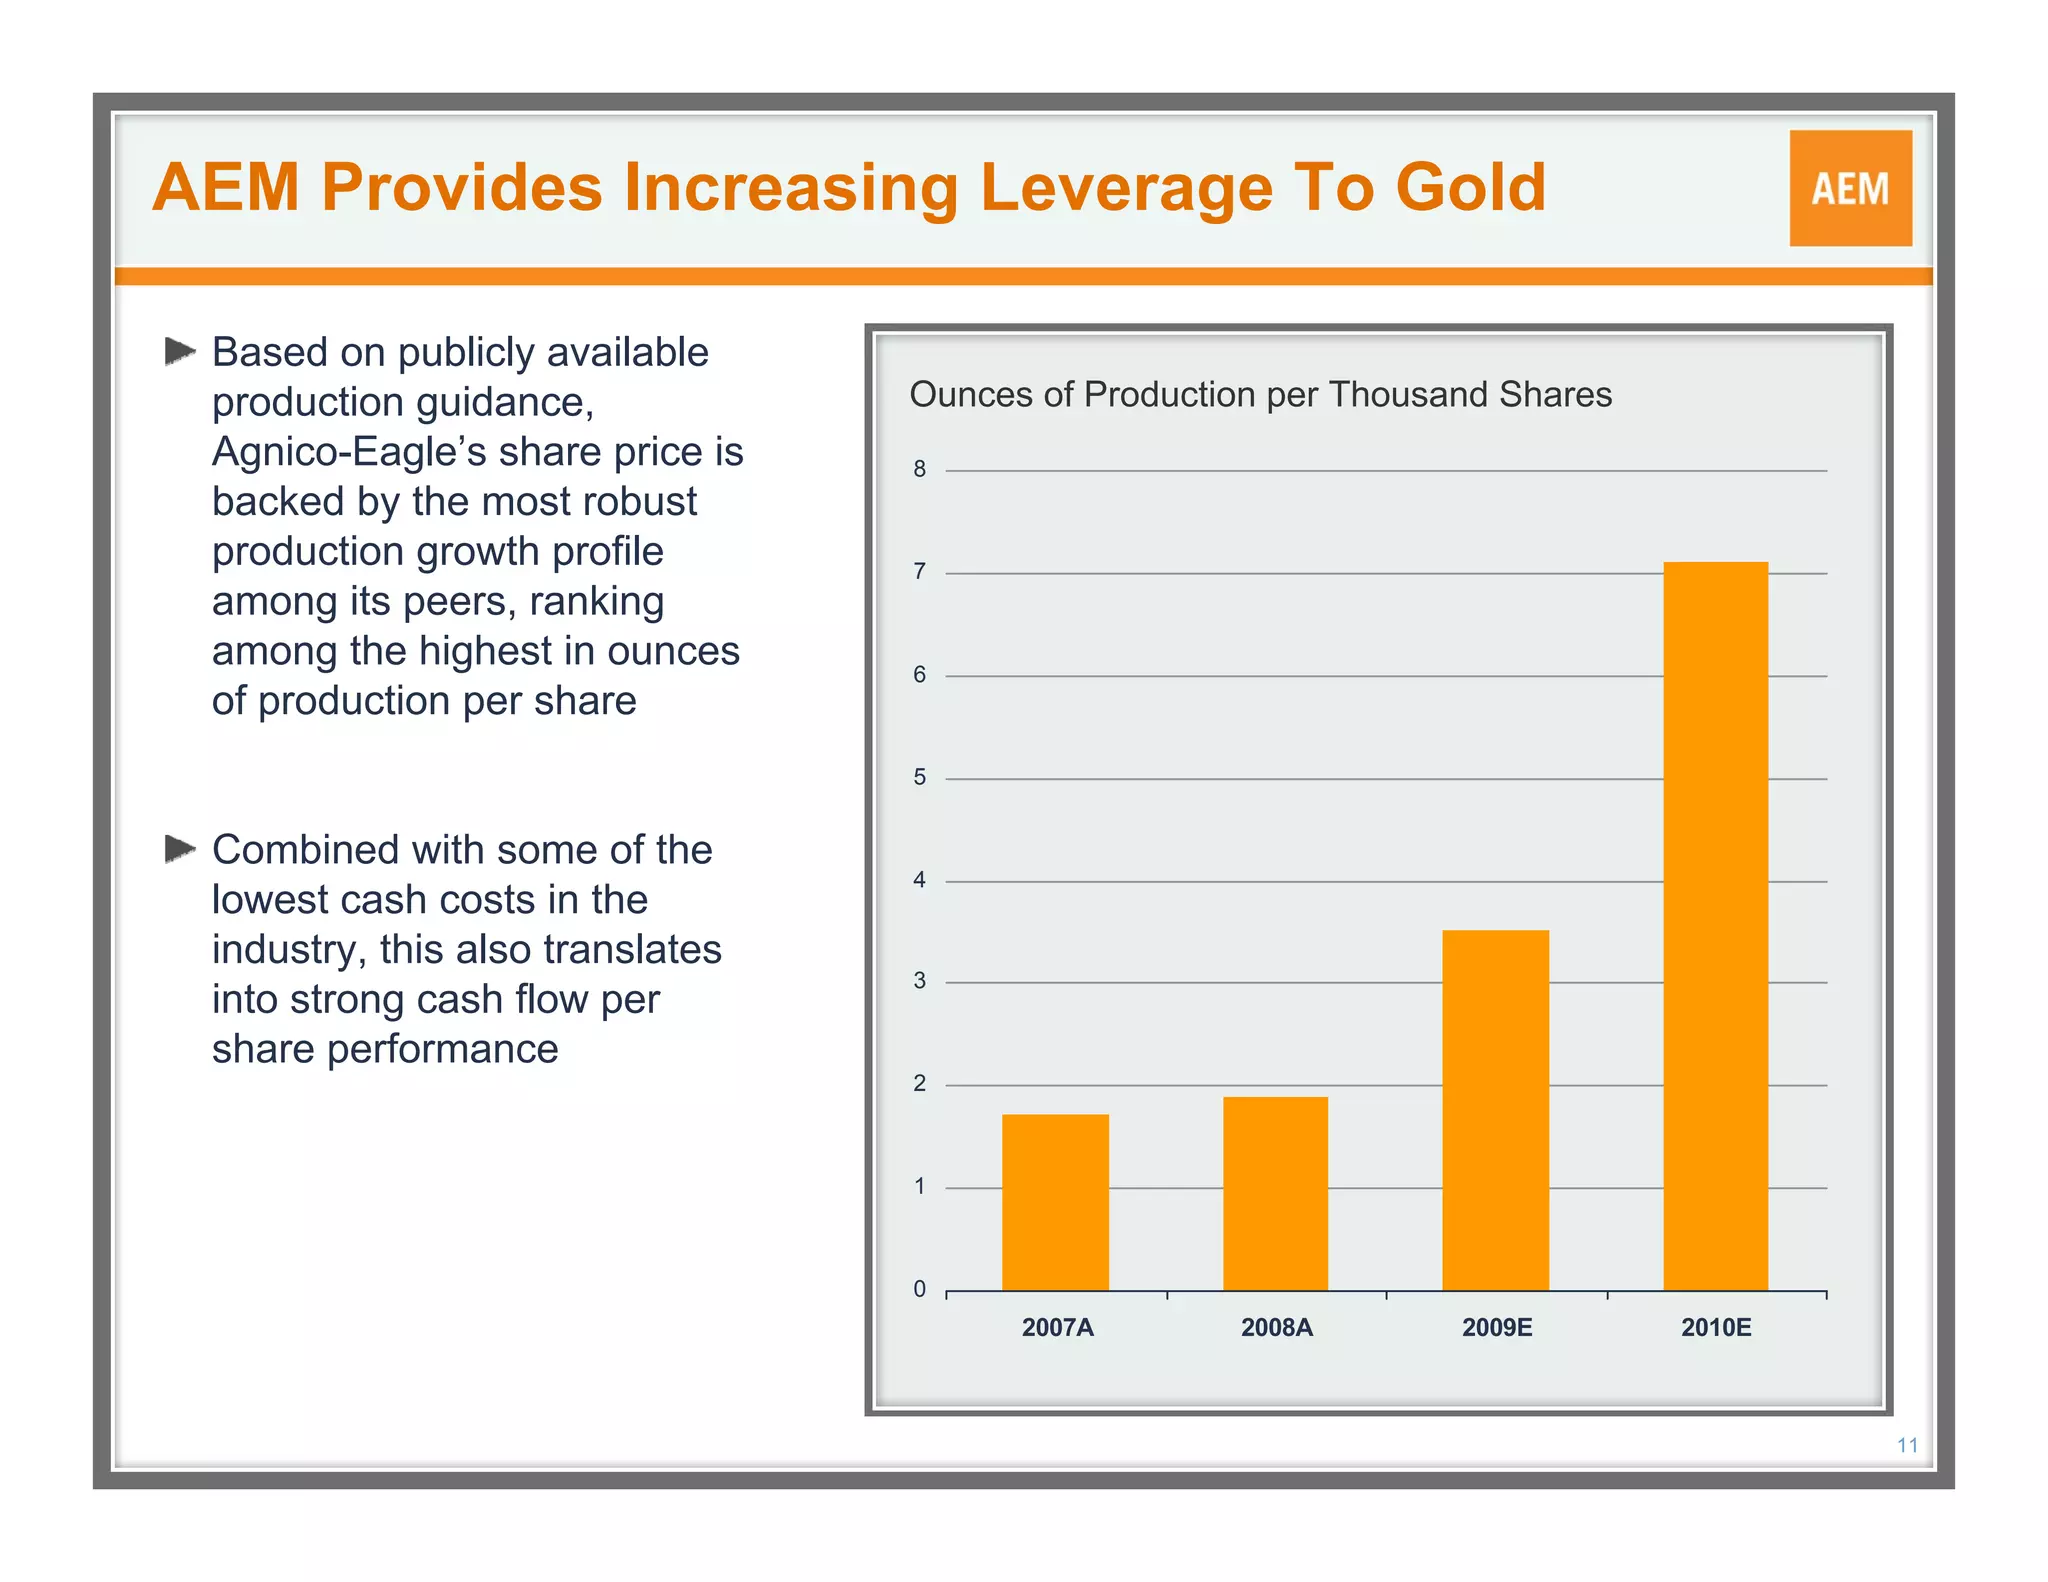
This document provides a corporate update from Agnico-Eagle Mines Limited for February 2009. It summarizes the company's operating and financial results for Q4 and full year 2008, highlights its strong gold reserves which are larger than its peers, and outlines its global growth strategy with three operating mines and three new mines under construction. It also previews upcoming news in 2009 regarding expansion studies at several of its projects which could further increase production.
2. Forward Looking Statements
The information in this document has been prepared as at February 18, 2009. Certain statements contained in this document constitute “forward-looking
statements” within the meaning of the United States Private Securities Litigation Reform Act of 1995 and forward looking information under the provisions
of Canadian provincial securities laws. When used in this document, the words “anticipate”, “expect”, “estimate”, “forecast”, “will”, “planned”, and similar
expressions are intended to identify forward-looking statements or information.
Such statements include without limitation: statements regarding timing and amounts of capital expenditures and other assumptions; estimates of future
reserves, resources, mineral production and sales; estimates of mine life; estimates of future mining costs, cash costs, minesite costs and other
expenses; estimates of future capital expenditures and other cash needs, and expectations as to the funding thereof; statements and information as to
the projected development of certain ore deposits, including estimates of exploration, development and production and other capital costs, and estimates
of the timing of such exploration, development and production or decisions with respect to such exploration, development and production; estimates of
reserves and resources, and statements and information regarding anticipated future exploration; the anticipated timing of events with respect to the
Company's minesites and statements and information regarding the sufficiency of the Company's cash resources. Such statements and information
reflect the Company's views as at the date of this document and are subject to certain risks, uncertainties and assumptions, and undue reliance should
not be placed on such statements and information. Many factors, known and unknown could cause the actual results to be materially different from those
expressed or implied by such forward looking statements and information. Such risks include, but are not limited to: the volatility of prices of gold and
other metals; uncertainty of mineral reserves, mineral resources, mineral grades and mineral recovery estimates; uncertainty of future production, capital
expenditures, and other costs; currency fluctuations; financing of additional capital requirements; cost of exploration and development programs; mining
risks; risks associated with foreign operations; governmental and environmental regulation; the volatility of the Company's stock price; and risks
associated with the Company's byproduct metal derivative strategies. For a more detailed discussion of such risks and other factors that may affect the
Company’s ability to achieve the expectations set forth in the forward-looking statements contained in this document, see Company's Annual Information
Form and Annual Report on Form 20-F for the year ended December 31, 2007, as well as the Company's other filings with the Canadian Securities
Administrators and the U.S. Securities and Exchange Commission. The Company does not intend,
and does not assume any obligation, to update these forward-looking statements and information.
Marc Legault, a Qualified Person and the Company’s Vice-President, Project Development,
reviewed the technical information disclosed herein. For a detailed breakdown of the Company’s
reserve and resource position see the February 18, 2009 press release on the Company’s website.
This press release also lists the Qualified Persons for each project.
2
3. Notes To Investors
Note to Investors Regarding the Use of Non-GAAP Financial Measures
This document presents estimates of future quot;total cash cost per ouncequot; and quot;minesite cost per tonnequot; that are not recognized measures
under United States generally accepted accounting principles (quot;US GAAPquot;). This data may not be comparable to data presented by other
gold producers. These future estimates are based upon the total cash costs per ounce and minesite costs per tonne that the Company
expects to incur to mine gold at the applicable projects and do not include production costs attributable to accretion expense and other
asset retirement costs, which will vary over time as each project is developed and mined. It is therefore not practicable to reconcile these
forward-looking non-GAAP financial measures to the most comparable GAAP measure. A reconciliation of the Company's total cash cost
per ounce and minesite cost per tonne to the most comparable financial measures calculated and presented in accordance with US GAAP
for the Company's historical results of operations is set forth in the notes to the financial statements included in the Company's Annual
Information Form and Annual Report on Form 20-F, for the year ended December 31, 2007, as well as the Company's other filings with
the Canadian Securities Administrators and the SEC.
3
4. Q4 and Full Year 2008 Highlights
Maintaining focus on per share value creation
Increased gold production
Record quarterly gold production in Q4 of 89,360 ounces
Record annual gold production of 276,762 ounces
Grow gold reserves
Increased reserves to a record 18.1 million ounces
Several deposits likely to exceed 5 million ounces
Acquire small, think big
Two $50 million equity investments in 2008
Be a low-cost leader
In the lowest quartile of total cash cost
per ounce at $162 in 2008
Maintain a solid financial profile
Doubled credit facility to $600 million
Raised $376 million in equity
issuances in 2008
Fully funded for 2009 capex,
without considering
internal cash flow
4
5. Operating Results
Low total cash costs per ounce
All $ amounts
are in US$,
Q4 Full Year 2009 Total Cash Costs
unless ($/oz)
otherwise 2008 2008 Forecast
indicated
Gold 89,360* 276,762** 590,000
(ounces) $269
$188 $182
$155 $162
Silver
(ounces in 930 4,079 4,500 $56 $43
thousands)
Zinc 14,383 65,755 67,500
(tonnes)
Copper 1,737 6,922 6,600 -$365
(tonnes)
Total cash
$463 $162 $325***
costs ($/oz) -$690
* Includes 3,118 ounces of non commercial production from Kittila
** Includes 13,207 ounces of non commercial production from Goldex and Kittila 2000 2001 2002 2003 2004 2005 2006 2007 2008
*** Assumptions for 2009 total cash costs include Ag $10/oz, Zn $1200/t, Cu $3700/t, C$/US$ of
1.22.and US$/Euro of 1.28
5
6. Financial Results
Strong cash flows
All amounts are Full Full
Q4 Q4
in US$, unless otherwise Year Year
indicated 2008 2007
2008 2007
Revenues $73.2 $368.9 $108.7 $432.2
(millions)
Earnings $21.9 $73.2 $65.2 $139.3
(millions)
Earnings per
$0.15 $0.50 $0.46 $1.04
share (fully diluted)
Cash provided
by operating
($46.4) $118.1 $48.8 $245.5
activities
(millions)
6
7. Strong Financial Position
All amounts are in US$,
Dec. 31
unless otherwise indicated
2008
Cash and cash equivalents
$99.4
(millions)
Long term debt
$200.0
(millions)
Available credit facilities
$345.0
(millions)
Common shares outstanding
154.8
(millions)
Common shares, fully diluted
168.1
(millions)
7
8. Global Growth
Three mines now operating. Three new gold mines under construction
AEM’s growth projects 100% owned, with low total acquisition costs
Located in mining-friendly regions of low political risk
Each project region has long-term mining camp potential
2009 & 2010 capex estimated to total $600 million.
8
9. Gold Reserves
AEM’s gold reserves are significantly larger than its intermediate peers
Strong record of growing gold reserves per share
Shares outstanding increased only 3.1 times since 1998. Gold reserves up 13.9 times
Targeting additional reserve conversion at Kittila, Pinos Altos, Goldex and Meadowbank
Uniquely positioned with potential for several 5 million ounce gold deposits
(Millions of Ounces) Target:
20-21
18.1
16.7
12.5
10.4
7.9 7.9
3.3 3.3 4.0
3.0
1.3
1998 1999 2000 2001 2002 2003 2004 2005 2006 2007 2008 2010
LaRonde Goldex Lapa Kittila Pinos Altos Meadowbank
9
10. Industry Leading1 Gold Production Growth Estimates
Payable Gold Production Total Cash Costs
(ounces) ($/oz)*
1,600,000 400
1,400,000
1,200,000 300
1,000,000
800,000 200
600,000
400,000 100
200,000
0 0
2008A 2009E 2010E 2011E 2012E 2013-2018 Avg.
LaRonde Goldex Lapa Kittila Pinos Altos Meadowbank Total Cash Costs (weighted average)
1 For an intermediate or senior gold producer
* Total cash costs per ounce for all years were calculated using the following metal prices and exchange rates (royalties included where applicable): $10.00/oz Ag; $1,200/t Zn; $3,700/t Cu; C$/US$ of 1.22;
US$/Euro of 1.28 10
11. AEM Provides Increasing Leverage To Gold
Based on publicly available
production guidance, Ounces of Production per Thousand Shares
Agnico-Eagle’s share price is 8
backed by the most robust
production growth profile 7
among its peers, ranking
among the highest in ounces 6
of production per share
5
Combined with some of the
4
lowest cash costs in the
industry, this also translates
3
into strong cash flow per
share performance
2
1
0
2007A 2008A 2009E 2010E
11
13. LaRonde – Canada
Long Life Gold Reserves
Operations:
Produced 216,208 oz of gold in 2008,
with a total cash cost of $106/oz
Gold reserves of 35.8 million tonnes
at 4.3 g/t, or 5.0 million oz
Life of mine: estimated to average
production of 320,000 oz/yr through
2022
Project:
Shaft sinking for Extension at 570
metres of 840 metres
Start of production from Extension
expected in 2011
2009 Exploration:
Focus on resource conversion,
additional potential at depth
13
14. Goldex – Canada
Ramping Up to Design Rates
Operations:
Produced 57,436 oz in 2008, total cash
cost per ounce of $419
Gold reserves of 1.6 million ounces from
23.8 million tonnes grading 2.1 g/t
Estimated average annual production of
160,000 oz/yr through 2017
Project:
Examining options to increase production
rate from 6900 tpd to at least 8000 tpd.
Results expected Q2 2009
2009 Exploration:
Exploration focus on resource
conversion, mineralization to west
14
15. Kittila – Finland
Mining and Processing Underway
Operations:
Produced 3,118 ounces of gold in 2008
– non-commercial production
125,000 ounces expected for 2009
Gold reserves of 3.2 million oz;
21.4 million tonnes at 4.7 g/t
Average production expected
at 150,000 oz/yr through 2023
Project:
Examining options to significantly increase
production rate of growing deposit.
Results expected Q4 2009
2009 Exploration:
Focus on resource conversion,
expanding resource below Suuri
and Roura, and along strike
$16 million expected to be spent
on exploration
15
16. Lapa – Canada
Start-up of production expected mid-year 2009
Project:
Gold reserves of 1.1 million oz; 3.8 million
tonnes at 8.8 g/t
Anticipating average production of 115,000
oz/yr through 2015
Lateral level development underway
Initial production blocks exposed;
first stope extracted
Ore stockpile 31,000 tonnes grading 8.9 g/t
Mill addition at LaRonde nearing completion
2009 Exploration:
Focus on resource conversion,
further exploration upside at depth
and to the East
16
17. Pinos Altos – Mexico
Growing Gold and Silver Reserve
Operations:
Reserves of 3.6 million ounces of gold, 100 million ounces of silver from 41.8 million tonnes
at 2.7 g/t gold and 74.6 g/t silver
Estimated annual gold production of 175,000 ounces and 2.6 million ounces of silver through 2022
Initial production expected in Q3, 2009. Pre-stripping 40,000 tonnes per day
Project:
Feasibility study to be released soon on stand-alone operation at Creston Mascota
Initial reserve at Creston Mascota of 0.4 million ounces of gold and 3.7 million ounces of silver
2009 Exploration:
Focus on resource conversion, expansion of Pinos Altos zones, Reyna de Plata, Creston Mascota
$11 million exploration program in progress. Drilling from underground decline underway
17
18. Meadowbank – Canada
Underground potential being investigated
Project:
Gold reserves of 3.6 million oz; 32.8 million tonnes at 3.5 g/t
Estimated average life of mine production expected at 350,000 oz/yr through 2019
Start-up expected Q1, 2010. Mill, powerhouse, and service buildings enclosed
Scoping study underway on potential of expansion.
Could increase production rate from 8,500 tpd to 10,000 tpd. Results expected Q3 2009
2009 Exploration:
Focus on resource conversion and expansion of Vault, Goose South and Portage
$11 million exploration program in progress
18
19. Investment Highlights
Industry Leading Production and Reserve Growth Story1
Long operating history and strong management team
Gold production expected to double to 590,000 ounces in 2009, double again to 1.2 million
ounces in 2010
Existing projects provide potential to increase gold reserves to 20-21 million ounces by
year end 2010
Potential for several five million ounce gold deposits is driving additional internal growth
opportunities
Four internal growth opportunities expected to add to production rate post-2010
1 For an intermediate gold producer
19
20. Upcoming News
2009 Internal Expansion Studies
Scoping study on Goldex and feasibility
study on Creston Mascota – Q2
Scoping study on Meadowbank – Q3
Scoping study on Kittila – Q4
20
21. Sean Boyd
Vice Chairman and Chief Executive Officer
Ebe Scherkus
President and Chief Operating Officer
David Garofalo
Sr. Vice President, Finance and Chief Financial Officer
Trading Symbol: AEM on TSX & NYSE
Executive and Registered Office:
145 King Street East, Suite 400
Toronto, Ontario, Canada, M5C 2Y7
Tel: 416-947-1212
Toll-Free: 888-822-6714
Fax: 416-367-4681
Email: info@agnico-eagle.com
Web: www.agnico-eagle.com
Investor Relations Contact:
David Smith – Vice President, Investor Relations
21