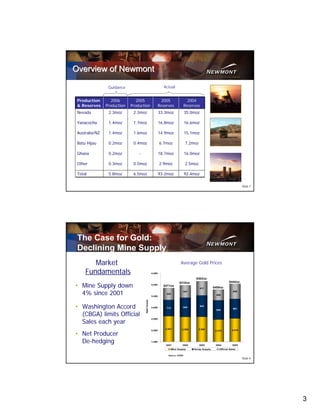
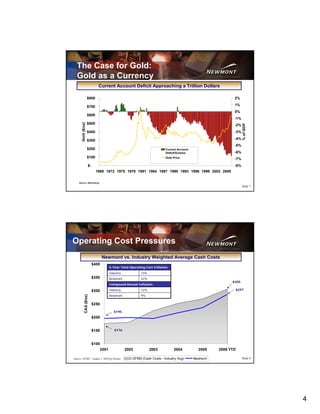
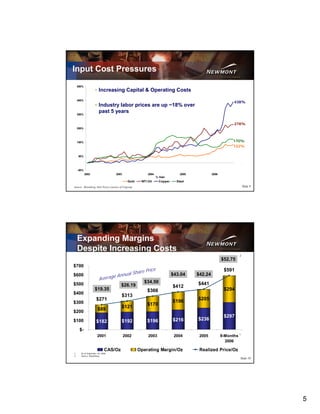
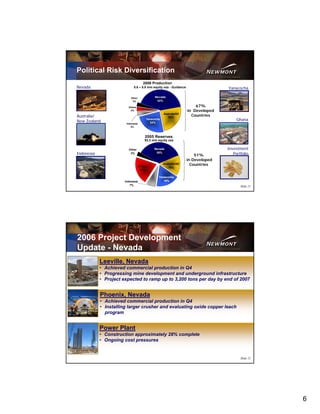
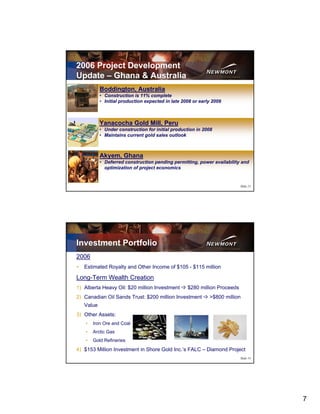
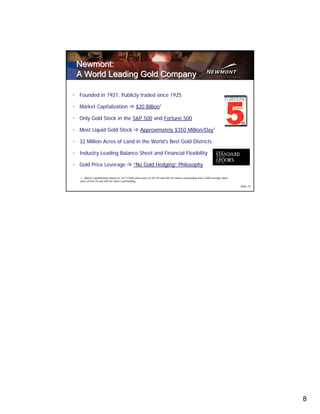
This presentation summarizes Newmont Mining Corporation's Westcoast Winter Roadshow. It discusses Newmont's financial results and production guidance, the positive fundamentals for gold including declining mine supply. It also covers Newmont's efforts to manage increasing operating costs, diversify its political risk across multiple countries, and use its investment portfolio to generate additional value. Newmont is positioned as a leading gold company with a large reserve base and market capitalization.
Agnico-Eagle's flagship LaRonde mine in Canada has been operating at steady state since its final expansion in 2003. Exploration is ongoing to extend the mine life, with potential resources identified below and to the east of the current workings. Production is expected to remain steady at around 324,000 ounces per year over the mine's estimated 13 year remaining life of mine.
- The document is the slide deck for Newmont Mining Corporation's Fourth Quarter and Year End 2006 Earnings Conference Call on February 22, 2007.
- It provides financial and operating results for Q4 2006 and full year 2006 compared to the same periods in 2005, highlighting increases in average realized gold price, equity gold sales, and income from continuing operations.
- Project development updates are given for power plant construction in Nevada, mill construction at Yanacocha in Peru, and Boddington mine development in Australia.
- Agnico-Eagle Mines Limited provided a corporate update in May 2010, outlining its strategy, operating results, and strong financial position.
- The company's strategy focuses on increasing gold production, growing gold reserves through acquisitions like Comaplex Minerals Corp, being a low-cost leader, and maintaining a solid financial profile with $860 million in available liquidity.
- In Q1 2010 the company produced over 188,000 ounces of gold, exceeding Q1 2009 production, and estimates 2010 full year gold production around 1.057 million ounces at a total cash cost of $399 per ounce. Revenues increased to $237.6 million in Q1 2010.
Agnico-Eagle Mines Limited has emerged as a top gold stock due to its emphasis on quality, exceptional record of shareholder value creation, and robust growth profile. The document discusses Agnico-Eagle's corporate strategy of increasing gold production and reserves while maintaining a solid financial profile and low costs. It provides an overview of the company's operating results, strong financial position, industry-leading growth estimates, and high gold reserves per share.
This document summarizes Duratex's financial performance in the first half of 2005. Key points include:
- Net revenues increased 13% to R$622 million driven by growth in the wood and Deca divisions.
- EBITDA grew 33% to R$187.5 million with margins expanding to 30.1% from 25.6%.
- Net income increased 48% to R$72.7 million.
- The wood division accounted for 68% of revenues while the Deca division contributed 32%.
- Exports increased 17.7% in US dollar terms led by growth in hardboard and MDF shipments to the US.
EVRAZ Group S.A. reported preliminary results for the first half of 2007, with revenues increasing 57% to $6.023 billion compared to the same period in 2006. Steel product sales volumes remained almost flat at 8.466 million tonnes while average steel prices grew 51% due to strong demand. The mining segment also saw significant growth, with EBITDA up 157% to $345 million on higher iron ore and metallurgical coal production. For the full year 2007, EVRAZ expects consolidated revenues to increase 45-55% and EBITDA to grow 55-60% compared to 2006.
This document provides a corporate update from Agnico-Eagle Mines Limited for February 2009. It summarizes the company's operating and financial results for Q4 and full year 2008, highlights its strong gold reserves which are larger than its peers, and outlines its global growth strategy with three operating mines and three new mines under construction. It also previews upcoming news in 2009 regarding expansion studies at several of its projects which could further increase production.
Agnico-Eagle Mines Limited reported its fourth quarter and full year 2011 results in February 2012. Earnings for both the quarter and full year were impacted by non-cash writedowns of the Goldex and Meadowbank mines. Revenues reached record levels in 2011 of $1.82 billion due to higher gold prices, however earnings were negative due to the writedowns. Production guidance is provided for 2012-2014, with payable gold production expected to increase each year from 875,000-950,000 ounces in 2012 to over 1 million ounces in 2014 through contributions from all mines. Capital expenditures are also forecast to remain below average EBITDA levels, allowing for expected ongoing free cash flow generation
This document provides information from Agnico-Eagle Mines Limited's shareholder meeting on April 30, 2009. It summarizes the company's operating results for the first quarter of 2009, highlighting record quarterly gold production of 91,812 ounces and total cash costs per ounce of $312. The document also emphasizes Agnico-Eagle's consistent strategy of growing gold reserves and production while maintaining low production costs to create shareholder value.
The document provides an earnings preview for gold and precious metals companies reporting 4th quarter 2011 earnings during the week of January 23rd. It is forecasted that sector earnings will decrease 10% from 3Q11 due to decreases in by-product revenues. A table provides target prices, estimates, and earnings dates for covered companies. Key quarterly themes discussed are expected increases in capital spending, risks to project financing, potential for industry consolidation, and rising operating costs.
Agnico-Eagle Mines Limited provided a corporate update in September 2010. The document discusses forward-looking statements and contains disclaimers about the risks and uncertainties inherent in such statements. It provides an overview of Agnico-Eagle's operating mines, production results for the second quarter of 2010, total cash costs, and financial position as of June 30, 2010, including available liquidity of $1.187 billion and long-term debt of $735 million.
Teleconferência de resultados 1 t03 (versão inglês)Braskem_RI
Braskem reported strong financial results for the first quarter of 2003, with net revenue increasing 86% compared to the first quarter of 2002. EBITDA grew 89% over the same period to R$450 million, with an EBITDA margin of 20%. Net debt was reduced by R$450 million during the quarter due to strong operating cash generation and synergies captured through integration. Braskem highlighted consolidation of its businesses as well as debt reduction as keys to creating shareholder value and becoming a world-class Brazilian petrochemical company.
GameStop held its 2007 Annual Meeting of Stockholders. The document provided an overview of GameStop's business including its global store base which totals over 4,800 stores across the US, Europe, Canada, and Australia. Financial information was presented showing sales growth from $1 billion in 1999 to an estimated $6.4 billion in 2007, as well as income statement details such as a 57% increase in net income from 2005 to 2006. Drivers for continued growth in the video game market in 2007 were also outlined.
- Agnico-Eagle Mines reported fourth quarter 2009 results on February 17, 2010
- Gold production in Q4 2009 was 163,276 ounces, up 83% from Q4 2008, with total cash costs of $297/ounce
- Issues that lowered production and increased costs in Q3 2009 at some mines were largely resolved by Q4
- The company is now a multi-mine international gold producer with 6 operating mines and production expected to grow to over 1 million ounces annually through expansions
This document provides a summary of a conference call for Newmont Mining Corporation's fourth quarter and full year 2008 earnings. It discusses Newmont meeting its original 2008 targets for gold production, costs, and capital expenditures. Key highlights include improved financial performance due to higher gold prices, increasing reserves through the Boddington acquisition, and expectations for higher gold sales at lower costs and reduced capital spending in 2009. Major projects like Conga and Akyem are being evaluated in light of market volatility. Boddington is on track to start up in mid-2009 and become one of Australia's largest gold producers.
Liz Claiborne Inc. designs and markets fashion apparel and accessories. It offers products through department stores, specialty stores, and other retail channels in North America, Europe, Asia, Australia, and South America. In 2006, net sales were $4.99 billion and operating income was $436 million. The CEO discusses plans to invest in power brands like Juicy Couture, Kate Spade, and Liz Claiborne through specialty store expansion, marketing initiatives, and advertising. He outlines priorities around irresistible product, building brand loyalty, optimizing the supply chain, and focusing on talent.
Agnico-Eagle Mines Limited provided forward-looking statements and information regarding its third quarter 2011 results. The document notes that certain statements constitute forward-looking statements that are subject to risks and uncertainties. It then provides a summary of production and financial results for the third quarter, including record gold production at Pinos Altos and record throughput at Kittila and Meadowbank. The document also notes that Goldex operations have been suspended indefinitely.
The document analyzes 103 foreign direct investment projects in the food and tobacco sectors by companies from Latin America and the Caribbean between 2003 and 2012. It found that:
1) Projects peaked in 2011 with 18 projects announced that year creating nearly 4,000 jobs and investing $791 million.
2) The top 10 investors accounted for 40% of projects and almost half the total jobs and capital investment.
3) Manufacturing was the largest business activity with 65% of projects and accounting for over 16,000 jobs and $3.36 billion in investment.
The document summarizes an industry luncheon presentation on the Australian economy and real estate market. It provides forecasts for interest rates, commodity prices, GDP growth, and consumer price inflation. Charts show trends in house prices, property completions and sales, household debt levels, and the exchange rate. Key challenges discussed include consumer confidence, funding availability, and market volatility.
Commercial Metals Company reported record financial results for fiscal year 2006 with net sales of $7.6 billion, net earnings of $356 million, and diluted earnings per share of $2.89. All five of CMC's business segments performed well, with domestic steel mills, CMCZ (the Polish steel operation), and recycling being especially strong. Market conditions were favorable, especially for non-residential construction, and CMC executed well. The company also invested in new facilities, acquisitions, and branding initiatives. CMC has high confidence in its future due to the continued expected strength of its end markets and its vertically integrated business model.
The Sri Lankan stock market declined significantly over the past week. The All Share Index fell over 4.5% and closed at 5,108 points, while the Milanka Price Index lost over 200 points to close at 4,610. Most sectors declined, with information technology and telecommunications dropping over 10%. Bears were active, driving down stocks such as DIAL.N, CSEC.N, LCEM.N and GHLL.N. Global markets also declined on the results of European elections. The Central Bank Governor stated that Sri Lanka's growth targets may be missed due to slower global growth. Technically, further declines are expected with support at 5,050 points.
Presentation 2Q09 - English audio (presentation only)Gazprom Neft
Gazprom Neft reported financial and operating results for 2Q 2009. Key highlights include:
- Daily crude oil production increased 2.9% in 2Q 2009 compared to the same period last year.
- The company launched a rebranding program and acquired retail assets in Russia during the quarter.
- Despite a 50% decline in average Urals oil prices year-over-year, crude exports netback adjusted for export duties declined only 42% due to the impact of the mineral extraction tax.
- Refining margins remained under pressure in 1H 2009, with refining netbacks lower than crude exports, though margins are expected to recover.
- The company grew crude output
1) Newmont Mining Corporation presented at its annual Westcoast Winter Roadshow, highlighting its strong financial performance in 2006 and outlook.
2) The presentation noted declining global gold mine supply, rising input costs putting pressure on industry margins, and Newmont's strategy to diversify its political risk across operations in developed and developing countries.
3) Newmont is moving forward with projects in Nevada, Ghana, Australia to maintain and grow production, while its investment portfolio has generated significant returns to enhance long-term shareholder value.
Goldman Sachs hosted a basic materials conference where Newmont presented. Newmont discussed its focus on eliminating its hedge book, divesting non-core assets, and growing reserves through acquisitions like Miramar. Newmont also provided updates on major projects like its Nevada power plant, Yanacocha gold mill, and Boddington mine. Newmont emphasized that it is the largest unhedged gold producer and expects to continue delivering strong financial and operating performance in 2008 through focus and execution.
Goldman Sachs hosted a basic materials conference where Newmont presented. Newmont's presentation included cautionary statements about forward-looking estimates and non-GAAP financial measures. Newmont highlighted its record first quarter results in 2008, including highest ever realized gold price and cash flow. Newmont also discussed its focus on executing major projects like Boddington and Yanacocha, advancing projects like Conga and Akyem, and investments like Canadian Oil Sands to increase shareholder value.
This presentation discusses capitalizing on the gold bull market. It provides an overview of Newmont Mining Corporation, including that it is a world leading gold company and the only major US gold company. It also provides financial and operating highlights for 2006, including equity gold sales and costs applicable to sales. Projections and opportunities for 2007 are discussed for various regions and mines, with costs applicable to sales expected to increase approximately 25% compared to 2006 due to rising input costs.
- The document appears to be slides from a Fourth Quarter and Year End 2006 Earnings Conference Call held by Newmont Mining Corporation on February 22, 2007.
- It provides financial and operating results for Q4 2006 and full year 2006, including revenues, costs, gold/copper production.
- It also discusses various mining projects and exploration budgets for 2007.
- Charts show trends in gold prices, costs, reserves over time.
This document provides an overview of Newmont Mining Corporation and the gold mining industry. It summarizes Newmont's financial and operating performance in 2006, provides production and cost guidance for 2007, and discusses trends of rising costs and declining production industry-wide. It also outlines Newmont's project pipeline and exploration activities.
- The document is a presentation from Merrill Lynch's Global Metals, Mining and Steel Conference on May 14, 2008.
- It discusses Newmont Mining Corporation's record first quarter results in 2008, including record gold sales and cash flow. It also provides an update on Newmont's major projects and production guidance for 2008.
- The presentation emphasizes Newmont's leverage to rising gold prices through focus on costs and an unhedged production strategy.
The presentation provides an overview of Merrill Lynch's Global Metals, Mining and Steel Conference on May 14, 2008. It discusses Newmont Mining Corporation's record first quarter results in 2008, focus on continued cost reductions and reserve growth, and progress on major projects including the Nevada power plant and Yanacocha gold mill expansion. Updates are also given on the Boddington, Conga, Hope Bay, and Akyem projects. The presentation contains cautionary statements regarding forward-looking estimates and metrics.
Agnico-Eagle Mines Limited provided a corporate update presentation in March 2010. The presentation discussed Agnico-Eagle's strategy of increasing gold production through internal expansions, growing gold reserves, acquiring early stage projects, maintaining low costs, and solid financial positioning. It also provided an operations update on improved performance in Q4 2009 at all mines, rising production and earnings, a strong financial position, and industry leading gold production growth estimates through potential internal expansions.
Goldcorp provides a corporate update and guidance for 2010. The company achieved strong earnings and cash flow growth from 2007 to 2009 and expects production to increase to 2.6 million ounces in 2010. Goldcorp has a robust pipeline of projects, with its Peñasquito mine in Mexico being one of the largest new gold mines in the world. The company maintains a strong balance sheet and low-cost production profile. Goldcorp's priorities for 2010 include achieving production at Peñasquito and advancing its pipeline of projects.
Smurfit-Stone reported a net loss of $19 million for Q1 2005, an improvement from a $66 million loss in Q1 2004. Net sales increased 8% to $2.1 billion. The company continued to face cost pressures from higher energy, fiber, and employee benefit costs which narrowed margins. However, demand was improving and costs were expected to moderate for the rest of the year, leading the company to expect a return to profitability in Q2 2005.
- The document summarizes Newmont Mining Corporation's third quarter 2008 conference call, highlighting adjusted net income, gold sales, average gold prices realized, and costs applicable to sales.
- Key metrics for year-to-date 2008 and third quarter 2008 such as adjusted net income, gold sales, average gold prices, and costs applicable to sales are presented for several regions and in total.
- Newmont reaffirms its annual guidance for 2008 equity gold sales and costs applicable to sales.
- The document summarizes Newmont Mining Corporation's third quarter 2008 conference call, highlighting adjusted net income, gold sales, average gold prices realized, and costs applicable to sales.
- Key metrics for year-to-date 2008 and third quarter 2008 such as adjusted net income, gold sales, average gold prices, and costs applicable to sales are provided for several regions and in total.
- Newmont reaffirms its annual guidance for 2008 equity gold sales and costs applicable to sales.
Smurfit-Stone Container Corporation reported a net loss of $229 million or $0.90 per share for Q3 2005, primarily due to a $293 million pretax restructuring charge related to mill closures in Canada and a paper machine closure. Net sales were $2.1 billion, down from $2.2 billion in Q3 2004. For the first nine months of 2005, the net loss was $247 million or $0.97 per share, compared to a net loss of $48 million or $0.19 per share for the same period in 2004. The company expects costs to increase in Q4 due to higher energy and freight expenses, while average corrugated prices are expected to
Russell Ball, EVP and CFO of Newmont Mining Corporation, presented at the CIBC Institutional Investor Conference on January 23, 2013. Newmont's 2013 outlook reflects stable production from its portfolio, with contribution expected from the Akyem mine in late 2013. Newmont is focused on total cost management and returning capital to shareholders through its gold price-linked dividend, currently yielding approximately 3.8%. Newmont aims to create leverage through reducing its all-in sustaining costs, which are expected to be $1,100-$1,200 per ounce in 2013.
The document summarizes Barrick Gold Corporation's presentation at the 2007 Merrill Lynch Annual Mining Conference in Toronto. It highlights Barrick's status as the world's largest unhedged gold producer, with gold reserves of over 33 million ounces. It provides guidance for 2007 of equity gold sales between 5.2 to 5.6 million ounces at costs applicable to sales of $375 to $400 per ounce. Capital expenditures are projected to be $1.8 to $2 billion, focused on major projects in Nevada, Peru, and Australia. Key mining operations and development projects are also summarized.
Agnico-Eagle Mines Limited reported its third quarter 2012 results in October 2012. The company achieved record quarterly gold production of 286,971 ounces at total cash costs of $556 per ounce. Cash flow from operations was also a record at $199 million for the quarter. Agnico increased its 2012 gold production guidance to approximately 1,025,000 ounces and lowered its total cash cost guidance to approximately $660 per ounce. The company's portfolio of long-life mines continued to perform well, and it expects low political risk and meaningful production growth from existing assets.
Agnico-Eagle Mines reported record quarterly gold production from its currently operating mines of 254,955 ounces in Q1 2012, a 19% increase over Q1 2011. Total cash costs were $594 per ounce. Net income was $79 million, up 74% year-over-year. Cash provided by operating activities was $196 million. Production is expected to grow further from existing long-life assets through exploration and mine plan optimization. The company aims to continue generating strong cash flows to fund growth and maintain its dividend.
This presentation discusses Newmont Mining Corporation capitalizing on the gold bull market. Newmont is the only major US gold company and has gold assets in Nevada, Peru, Indonesia, Australia, and Ghana. In 2006, Newmont had equity gold sales of 5.9 million ounces. Newmont provides leverage to rising gold prices with no gold hedges. Guidance is given for 2007 production and costs at each region. Costs applicable to sales are expected to increase approximately 25% in 2007 due to increases in factors such as labor, fuel and consumables.
Western Digital's revenue in Q1 FY2005 was $824 million. 59% of revenue came from OEM customers, 35% from distributors, and 6% from retailers. Geographically, 40% of revenue was from the Americas, 30% from Europe, and 30% from Asia. Worldwide headcount increased to 20,760 employees. Total inventory was $144 million with inventory turns of 20 times.
Western Digital reported revenue of $955 million for Q2 FY2005, up 16% from Q2 FY2004. 58% of revenue came from OEM customers and 35% from distributors. Geographically, 38% of revenue was from the Americas, 32% from Europe, and 30% from Asia. Hard drive unit shipments increased by 16% to 16.2 million units while worldwide headcount grew slightly to 21,565. Total inventory fell to $118 million while inventory turns improved to 27 times.
Western Digital reported Q3 FY2005 revenue of $920 million, with 56% from OEM customers, 37% from distributors, and 7% from retail. Revenue was highest in Asia at 34% of the total, followed by Americas at 36% and Europe at 30%. The number of hard drive units shipped was 15.3 million, with worldwide headcount growing to 22,426. Inventory levels increased to $136 million, with inventory turns at 22.
Western Digital reported Q4 FY2005 revenue of $940 million. 57% of revenue came from OEM customers, 38% from distributors, and 5% from retail. 37% of revenue was from the Americas, 25% from Europe, and 37% from Asia. 48% of revenue came from the top 10 largest customers. Hard drive unit shipments reached 15.8 million for the quarter. Worldwide headcount increased to 23,161 employees. Inventory levels increased to $153 million with inventory turns at 20 times.
Western Digital's revenue in Q1 FY2006 was $1.01 billion, up from $824 million in Q1 FY2005. 55% of revenue came from OEM customers, 39% from distributors, and 6% from retail. Geographically, 36% of revenue was from the Americas, 29% from Europe, and 35% from Asia. Worldwide headcount increased to 24,211 from 20,760 in Q1 FY2005. Total inventory, net increased to $173 million from $144 million in Q1 FY2005.
Western Digital reported revenue of $1.117 billion for Q2 FY2006, up 11% from the same period last year. Approximately 56% of revenue came from OEM customers and 39% from distributors. Geographically, revenue declined in the Americas to 32% while rising in Europe to 34% and remaining flat in Asia at 34%. Inventory levels increased to $168 million but inventory turns improved to 21 turns.
Western Digital Corporation's Q3 FY2006 financial results show that hard drive unit shipments increased to 18.8 million, revenue was $1.129 billion with an average selling price of $60 per unit, and gross margin was 19.3%. Revenue was split 53% from OEMs, 40% from distributors, and 7% from retail, with the largest geographic regions being the Americas at 39%, Europe at 27%, and Asia at 34%. Cash flow from operations was $119 million.
Western Digital Corporation reported its financial results for the fourth quarter of fiscal year 2006, with total revenue of $1.086 billion. The average selling price of hard drives declined to $56 per unit from $60 in the previous quarter. Gross margin was 18.8% and cash flow from operations was $126 million. Worldwide headcount increased to 24,750 employees. Total inventory increased to $205 million while inventory turns declined to 17 turns.
Western Digital reported higher unit shipments and revenue in Q1 FY2007 compared to the same quarter last year. Revenue increased by $254 million to $1.264 billion due to a 22% increase in hard drive unit shipments. Gross margin declined slightly to 17.3% and revenue from OEM customers decreased to 52% of total revenue. Cash flow from operations was $128 million and inventory levels increased by $11 million from the previous quarter to $216 million.
Western Digital reported increased revenue and unit shipments in Q2 FY2007 compared to the same period last year. Revenue grew 28% to $1.428 billion while unit shipments increased 36% to 24.5 million units. Gross margin improved slightly to 17.9% and worldwide headcount grew 9% to over 27,000 employees. Inventories also increased due to higher finished goods and work in process levels.
Western Digital reported its Q3 FY2007 financial results. While unit shipments remained steady at 24.5 million, revenue declined slightly to $1.41 billion. Gross margins decreased to 15.8% due to pricing pressures. Cash flow from operations was $164 million. Inventory levels increased but inventory turns improved to 20 times.
Western Digital Corporation's Q4 FY2007 investor information summary shows that the company's hard drive unit shipments increased slightly compared to Q3 FY2007, but revenue and average selling price declined. Gross margin also decreased from the prior quarter. The company's largest customers - representing 48% of revenue - continued to be OEMs, distributors, and retailers. Cash flow from operations and inventory levels increased from Q3 FY2007.
Western Digital reported higher revenue and unit shipments in Q1 FY2008 compared to the same period last year. Revenue increased 40% to $1.77 billion driven by a 7% increase in average selling price and 29% more hard drive units shipped. Gross margin improved to 18.3% from 17.3% a year ago. Total inventory increased significantly to support future demand, leading to lower inventory turns. Capital expenditures also increased substantially to $163 million to expand production capacity.
Western Digital reported revenue of $2.2 billion for Q2 FY2008, a 25% increase from the previous quarter. Gross margins improved to 23.3% as average selling prices increased to $61 per hard drive unit. Inventory levels remained steady at $459 million while inventory turns improved to 15 times. Worldwide headcount grew modestly to 42,534 employees.
Western Digital Corporation provides a quarterly investor information summary including key metrics such as hard drive unit shipments, revenue, average selling prices, gross margins, revenue by channel and geography, cash flow from operations, inventory levels, and number of employees. For the third quarter of fiscal year 2008, the company shipped 34.5 million hard drive units, generated $2.11 billion in revenue, and had a gross margin of 22.6%.
Western Digital reported revenue of $1.993 billion in Q4 FY2008, down from $2.111 billion in the previous quarter. Their average hard drive selling price was $56 and gross margin was 21.3%. Over half of revenue came from OEM customers, while Asia accounted for 46% of geographic revenue. Total inventory was $456 million with inventory turns of 14 times.
Western Digital reported revenue of $2.1 billion for Q1 FY2009, up slightly from the previous year. Average selling prices for hard drives declined to $53 per unit from $56 in the previous quarter. Gross margins decreased to 20.1% as production costs increased. Revenue from Asia grew and now makes up 48% of total revenue, while the Americas saw a decline to 23% of revenue. The company's workforce grew to 51,409 employees worldwide.
Western Digital reported Q2 FY2009 revenue of $1.823 billion, down 15% from the previous year. Revenue from OEM customers was 57% of total, down from 48% the previous year. The Asia region accounted for 48% of revenue, up from 36% the previous year. Gross margin declined to 15.9% from 23.3% the previous year. Cash flow from operations was $300 million and days sales outstanding was 46 days.
Western Digital Corporation is a leading manufacturer of hard disk drives. In fiscal year 1995, the company achieved record revenues and earnings despite intense competition. It gained market share in hard drives, improved its financial position, and received an ISO 9001 quality certification. Looking forward, Western Digital is expanding its hard drive production capacity and entering new high-performance, high-capacity hard drive markets. It aims to take advantage of growth opportunities through investment in research and development.
Western Digital Corporation is a leading manufacturer of hard drives. In 1996, the company reported record revenues and unit shipments, gained market share, and introduced new enterprise hard drives. Despite significant investments, Western Digital remains debt-free with strong cash flow and financial position. The company expects continued growth in the hard drive market and is well-positioned with efficient operations and quality products to capitalize on opportunities.
how to sell pi coins effectively (from 50 - 100k pi)DOT TECH
Anywhere in the world, including Africa, America, and Europe, you can sell Pi Network Coins online and receive cash through online payment options.
Pi has not yet been launched on any exchange because we are currently using the confined Mainnet. The planned launch date for Pi is June 28, 2026.
Reselling to investors who want to hold until the mainnet launch in 2026 is currently the sole way to sell.
Consequently, right now. All you need to do is select the right pi network provider.
Who is a pi merchant?
An individual who buys coins from miners on the pi network and resells them to investors hoping to hang onto them until the mainnet is launched is known as a pi merchant.
debuts.
I'll provide you the what'sapp number.
+12349014282
Solution Manual For Financial Accounting, 8th Canadian Edition 2024, by Libby...Donc Test
Solution Manual For Financial Accounting, 8th Canadian Edition 2024, by Libby, Hodge, Verified Chapters 1 - 13, Complete Newest Version Solution Manual For Financial Accounting, 8th Canadian Edition by Libby, Hodge, Verified Chapters 1 - 13, Complete Newest Version Solution Manual For Financial Accounting 8th Canadian Edition Pdf Chapters Download Stuvia Solution Manual For Financial Accounting 8th Canadian Edition Ebook Download Stuvia Solution Manual For Financial Accounting 8th Canadian Edition Pdf Solution Manual For Financial Accounting 8th Canadian Edition Pdf Download Stuvia Financial Accounting 8th Canadian Edition Pdf Chapters Download Stuvia Financial Accounting 8th Canadian Edition Ebook Download Stuvia Financial Accounting 8th Canadian Edition Pdf Financial Accounting 8th Canadian Edition Pdf Download Stuvia
Financial Assets: Debit vs Equity Securities.pptxWrito-Finance
financial assets represent claim for future benefit or cash. Financial assets are formed by establishing contracts between participants. These financial assets are used for collection of huge amounts of money for business purposes.
Two major Types: Debt Securities and Equity Securities.
Debt Securities are Also known as fixed-income securities or instruments. The type of assets is formed by establishing contracts between investor and issuer of the asset.
• The first type of Debit securities is BONDS. Bonds are issued by corporations and government (both local and national government).
• The second important type of Debit security is NOTES. Apart from similarities associated with notes and bonds, notes have shorter term maturity.
• The 3rd important type of Debit security is TRESURY BILLS. These securities have short-term ranging from three months, six months, and one year. Issuer of such securities are governments.
• Above discussed debit securities are mostly issued by governments and corporations. CERTIFICATE OF DEPOSITS CDs are issued by Banks and Financial Institutions. Risk factor associated with CDs gets reduced when issued by reputable institutions or Banks.
Following are the risk attached with debt securities: Credit risk, interest rate risk and currency risk
There are no fixed maturity dates in such securities, and asset’s value is determined by company’s performance. There are two major types of equity securities: common stock and preferred stock.
Common Stock: These are simple equity securities and bear no complexities which the preferred stock bears. Holders of such securities or instrument have the voting rights when it comes to select the company’s board of director or the business decisions to be made.
Preferred Stock: Preferred stocks are sometime referred to as hybrid securities, because it contains elements of both debit security and equity security. Preferred stock confers ownership rights to security holder that is why it is equity instrument
<a href="https://www.writofinance.com/equity-securities-features-types-risk/" >Equity securities </a> as a whole is used for capital funding for companies. Companies have multiple expenses to cover. Potential growth of company is required in competitive market. So, these securities are used for capital generation, and then uses it for company’s growth.
Concluding remarks
Both are employed in business. Businesses are often established through debit securities, then what is the need for equity securities. Companies have to cover multiple expenses and expansion of business. They can also use equity instruments for repayment of debits. So, there are multiple uses for securities. As an investor, you need tools for analysis. Investment decisions are made by carefully analyzing the market. For better analysis of the stock market, investors often employ financial analysis of companies.
^%$Zone1:+971)581248768’][* Legit & Safe #Abortion #Pills #For #Sale In #Duba...mayaclinic18
Whatsapp (+971581248768) Buy Abortion Pills In Dubai/ Qatar/Kuwait/Doha/Abu Dhabi/Alain/RAK City/Satwa/Al Ain/Abortion Pills For Sale In Qatar, Doha. Abu az Zuluf. Abu Thaylah. Ad Dawhah al Jadidah. Al Arish, Al Bida ash Sharqiyah, Al Ghanim, Al Ghuwariyah, Qatari, Abu Dhabi, Dubai.. WHATSAPP +971)581248768 Abortion Pills / Cytotec Tablets Available in Dubai, Sharjah, Abudhabi, Ajman, Alain, Fujeira, Ras Al Khaima, Umm Al Quwain., UAE, buy cytotec in Dubai– Where I can buy abortion pills in Dubai,+971582071918where I can buy abortion pills in Abudhabi +971)581248768 , where I can buy abortion pills in Sharjah,+97158207191 8where I can buy abortion pills in Ajman, +971)581248768 where I can buy abortion pills in Umm al Quwain +971)581248768 , where I can buy abortion pills in Fujairah +971)581248768 , where I can buy abortion pills in Ras al Khaimah +971)581248768 , where I can buy abortion pills in Alain+971)581248768 , where I can buy abortion pills in UAE +971)581248768 we are providing cytotec 200mg abortion pill in dubai, uae.Medication abortion offers an alternative to Surgical Abortion for women in the early weeks of pregnancy. Zone1:+971)581248768’][* Legit & Safe #Abortion #Pills #For #Sale In #Dubai Abu Dhabi Sharjah Deira Ajman Fujairah Ras Al Khaimah%^^%$Zone1:+971)581248768’][* Legit & Safe #Abortion #Pills #For #Sale In #Dubai Abu Dhabi Sharjah Deira Ajman Fujairah Ras Al Khaimah%^^%$Zone1:+971)581248768’][* Legit & Safe #Abortion #Pills #For #Sale In #Dubai Abu Dhabi Sharjah Deira Ajman Fujairah Ras Al Khaimah%^^%$Zone1:+971)581248768’][* Legit & Safe #Abortion #Pills #For #Sale In #Dubai Abu Dhabi Sharjah Deira Ajman Fujairah Ras Al Khaimah%^^%$Zone1:+971)581248768’][* Legit & Safe #Abortion #Pills #For #Sale In #Dubai Abu Dhabi Sharjah Deira Ajman Fujairah Ras Al Khaimah%^^%$Zone1:+971)581248768’][* Legit & Safe #Abortion #Pills #For #Sale In #Dubai Abu Dhabi Sharjah Deira Ajman Fujairah Ras Al Khaimah%^^%$Zone1:+971)581248768’][* Legit & Safe #Abortion #Pills #For #Sale In #Dubai Abu Dhabi Sharjah Deira Ajman Fujairah Ras Al Khaimah%^^%$Zone1:+971)581248768’][* Legit & Safe #Abortion #Pills #For #Sale In #Dubai Abu Dhabi Sharjah Deira Ajman Fujairah Ras Al Khaimah%^^%$Zone1:+971)581248768’][* Legit & Safe #Abortion #Pills #For #Sale In #Dubai Abu Dhabi Sharjah Deira Ajman Fujairah Ras Al Khaimah%^^%$Zone1:+971)581248768’][* Legit & Safe #Abortion #Pills #For #Sale In #Dubai Abu Dhabi Sharjah Deira Ajman Fujairah Ras Al Khaimah%^^%$Zone1:+971)581248768’][* Legit & Safe #Abortion #Pills #For #Sale In #Dubai Abu Dhabi Sharjah Deira Ajman Fujairah Ras Al Khaimah%^^%$Zone1:+971)581248768’][* Legit & Safe #Abortion #Pills #For #Sale In #Dubai Abu Dhabi Sharjah Deira Ajman Fujairah Ras Al Khaimah%^^%$Zone1:+971)581248768’][* Legit & Safe #Abortion #Pills #For #Sale In #Dubai Abu Dhabi Sharjah Deira Ajman Fujairah Ras Al Khaimah%^^%$Zone1:+971)581248768’][* Legit & Safe #Abortion #Pills #For #Sale In #Dubai Abu Dhabi Sharjah Deira Ajman
Abhay Bhutada Leads Poonawalla Fincorp To Record Low NPA And Unprecedented Gr...Vighnesh Shashtri
Under the leadership of Abhay Bhutada, Poonawalla Fincorp has achieved record-low Non-Performing Assets (NPA) and witnessed unprecedented growth. Bhutada's strategic vision and effective management have significantly enhanced the company's financial health, showcasing a robust performance in the financial sector. This achievement underscores the company's resilience and ability to thrive in a competitive market, setting a new benchmark for operational excellence in the industry.
Turin Startup Ecosystem 2024 - Ricerca sulle Startup e il Sistema dell'Innov...Quotidiano Piemontese
Turin Startup Ecosystem 2024
Una ricerca de il Club degli Investitori, in collaborazione con ToTeM Torino Tech Map e con il supporto della ESCP Business School e di Growth Capital
1. Elemental Economics - Introduction to mining.pdfNeal Brewster
After this first you should: Understand the nature of mining; have an awareness of the industry’s boundaries, corporate structure and size; appreciation the complex motivations and objectives of the industries’ various participants; know how mineral reserves are defined and estimated, and how they evolve over time.
Lecture slide titled Fraud Risk Mitigation, Webinar Lecture Delivered at the Society for West African Internal Audit Practitioners (SWAIAP) on Wednesday, November 8, 2023.
Abhay Bhutada, the Managing Director of Poonawalla Fincorp Limited, is an accomplished leader with over 15 years of experience in commercial and retail lending. A Qualified Chartered Accountant, he has been pivotal in leveraging technology to enhance financial services. Starting his career at Bank of India, he later founded TAB Capital Limited and co-founded Poonawalla Finance Private Limited, emphasizing digital lending. Under his leadership, Poonawalla Fincorp achieved a 'AAA' credit rating, integrating acquisitions and emphasizing corporate governance. Actively involved in industry forums and CSR initiatives, Abhay has been recognized with awards like "Young Entrepreneur of India 2017" and "40 under 40 Most Influential Leader for 2020-21." Personally, he values mindfulness, enjoys gardening, yoga, and sees every day as an opportunity for growth and improvement.
"Does Foreign Direct Investment Negatively Affect Preservation of Culture in the Global South? Case Studies in Thailand and Cambodia."
Do elements of globalization, such as Foreign Direct Investment (FDI), negatively affect the ability of countries in the Global South to preserve their culture? This research aims to answer this question by employing a cross-sectional comparative case study analysis utilizing methods of difference. Thailand and Cambodia are compared as they are in the same region and have a similar culture. The metric of difference between Thailand and Cambodia is their ability to preserve their culture. This ability is operationalized by their respective attitudes towards FDI; Thailand imposes stringent regulations and limitations on FDI while Cambodia does not hesitate to accept most FDI and imposes fewer limitations. The evidence from this study suggests that FDI from globally influential countries with high gross domestic products (GDPs) (e.g. China, U.S.) challenges the ability of countries with lower GDPs (e.g. Cambodia) to protect their culture. Furthermore, the ability, or lack thereof, of the receiving countries to protect their culture is amplified by the existence and implementation of restrictive FDI policies imposed by their governments.
My study abroad in Bali, Indonesia, inspired this research topic as I noticed how globalization is changing the culture of its people. I learned their language and way of life which helped me understand the beauty and importance of cultural preservation. I believe we could all benefit from learning new perspectives as they could help us ideate solutions to contemporary issues and empathize with others.
Independent Study - College of Wooster Research (2023-2024)
newmont mining 01_10_07_UBS_CA
1. Westcoast Winter Roadshow
Wayne W. Murdy
Chairman and Chief Executive Officer
January 10-11, 2007
Slide 1
Cautionary Statement
This presentation contains “forward-looking statements” within the meaning of Section 27A of the Securities Act of
1933, as amended, and Section 21E of the Securities Exchange Act of 1934, as amended, that are intended to be
covered by the safe harbor created by such sections. Such forward-looking statements include, without limitation, (i)
estimates of future gold and other metals production and sales; (ii) estimates of future costs and consolidated costs
applicable to sales; (iii) estimates of future capital expenditures and expenses; (iv) estimates regarding timing of
future development, construction, production and expansion activities; (v) statements regarding future exploration
results; (vi) estimates of reserves and statements regarding replacement of reserves; and (vii) estimates of pre-tax
gains. Where the Company expresses or implies an expectation or belief as to future events or results, such
expectation or belief is expressed in good faith and believed to have a reasonable basis. However, forward-looking
statements are subject to risks, uncertainties and other factors, which could cause actual results to differ materially
from future results expressed, projected or implied by such forward-looking statements. Such risks include, but are
not limited to, gold and other metals price volatility, currency fluctuations, increased production costs and variances in
ore grade or recovery rates from those assumed in mining plans, political and operational risks in the countries in
which we operate, and governmental regulation and judicial outcomes. For a more detailed discussion of such risks
and other factors, see the Company’s 2005 Annual Report on Form 10-K, which is on file with the Securities and
Exchange Commission, as well as the Company’s other SEC filings. The Company does not undertake any obligation
to release publicly revisions to any “forward-looking statement,” to reflect events or circumstances after the date of
this news release, or to reflect the occurrence of unanticipated events, except as may be required under applicable
securities laws.
Slide 2
1
2. Overview
• Company Overview
• Gold Supply and Demand Fundamentals
• Industry-Wide Cost Pressures
• Growing Margins and Increasing Costs
• Political Risk Diversification
• Continued Merchant Banking Success
Slide 3
Overview of Newmont
% of
Financials & Statistics 2005 2006 Change
9-month Revenue ($millions) $3,060 $3,527 +15%
Net Income ($millions) $260 $568 +118%
Equity Gold Sales (000 ounces) 4,695 4,155 -12%
Realized Gold $427 $591 +38%
Cost of Sales Per Ounce $239 $297 +24%
Market Capitalization ($millions) $18,945 $21,363 +13%
Total Assets ($millions) $13,922 $15,121 +8%
1. Market Capitalization based on 12/11/2006 share price of $47.45 and 450.2m shares outstanding and a 2005 average share Slide 4
price of $42.24 and 448.5m shares outstanding.
2
3. Overview of Newmont
Guidance Actual
Production 2006 2005 2005 2004
& Reserves Production Production Reserves Reserves
Nevada 2.3moz 2.3moz 33.3moz 35.0moz
Yanacocha 1.4moz 1.7moz 16.8moz 16.6moz
Australia/NZ 1.4moz 1.6moz 14.9moz 15.1moz
Batu Hijau 0.2moz 0.4moz 6.7moz 7.2moz
Ghana 0.2moz - 18.7moz 16.0moz
Other 0.3moz 0.5moz 2.9moz 2.5moz
Total 5.8moz 6.5moz 93.2moz 92.4moz
Slide 5
The Case for Gold:
Declining Mine Supply
Market Average Gold Prices
Fundamentals 4,500
$363/oz
$444/oz
• Mine Supply down
$310/oz
4,000
$271/oz
617 $409/oz
4% since 2001 3,500
520
547
468
656
Gold Tonnes
• Washington Accord 3,000 713 840
943
848
861
(CBGA) limits Official
Sales each year
2,500
2,621 2,588 2,592
• Net Producer
2,000 2,470 2,519
De-hedging 1,500
2001 2002 2003 2004 2005
Mine Supply Scrap Supply Official Sales
Source: GFMS
Slide 6
3
4. The Case for Gold:
Gold as a Currency
Current Account Deficit Approaching a Trillion Dollars
$800 2%
$700 1%
0%
$600
-1%
$500
Gold ($/oz)
% of GDP
-2%
$400 -3%
$300 -4%
-5%
$200 Current Account
Deficit/Surplus -6%
$100 Gold Price -7%
$- -8%
1969 1972 1975 1978 1981 1984 1987 1990 1993 1996 1999 2002 2005
Source: Bloomberg
Slide 7
Operating Cost Pressures
Newmont vs. Industry Weighted Average Cash Costs
$400
5-Year Total Operating Cost Inflation
Industry 73%
$350 Newmont 52%
$305
Compound Annual Inflation
$300 Industry 12% $297
Newmont 9%
CAS ($/oz)
$250
$195
$200
$150 $176
$100
2001 2002 2003 2004 2005 2006 YTD
Source: GFMS – Update 1, NEM Q3 Results GFMS (Cash Costs - Industry Avg) Newmont Slide 8
4
5. Input Cost Pressures
550%
• Increasing Capital & Operating Costs
450%
438%
• Industry labor prices are up ~18% over
350%
past 5 years
278%
250%
150% 170%
132%
50%
-50%
2002 2003 2004 2005 2006
% Gain
Gold WTI Oil Copper Steel
Source: Bloomberg, Steel Prices courtesy of Citigroup Slide 9
Expanding Margins
Despite Increasing Costs
2
$52.75
$700
Price $591
al Share
$600
Averag e Annu $43.04 $42.24
$500 $34.50 $441
$26.19 $412
$19.35 $366 $294
$400
$313
$271 $196 $205
$300 $170
$89 $121
$200
$297
$100 $182 $192 $196 $216 $236
$-
2001 2002 2003 2004 2005 9-Months 1
2006
CAS/Oz Operating Margin/Oz Realized Price/Oz
1. As of September 30, 2006
2. Source: Bloomberg
Slide 10
5
6. Political Risk Diversification
2006 Production
Nevada 5.6 – 5.8 mm equity ozs - Guidance Yanacocha
Other Nevada
3% 42%
Ghana 67%
3% in Developed
Australia/
Australia/NZ
25%
Countries
New Zealand
Yanacocha Ghana
Indonesia 24%
3%
2005 Reserves
93.2 mm equity ozs
Other Nevada Investment
Indonesia 3% 35%
51% Portfolio
in Developed
Ghana
Australia/NZ Countries
16%
21%
Yanacocha
Indonesia 18%
7% Slide 11
2006 Project Development
Update - Nevada
Leeville, Nevada
• Achieved commercial production in Q4
• Progressing mine development and underground infrastructure
• Project expected to ramp up to 3,200 tons per day by end of 2007
Phoenix, Nevada
• Achieved commercial production in Q4
• Installing larger crusher and evaluating oxide copper leach
program
Power Plant
• Construction approximately 28% complete
• Ongoing cost pressures
Slide 12
6
7. 2006 Project Development
Update – Ghana & Australia
Boddington, Australia
• Construction is 11% complete
• Initial production expected in late 2008 or early 2009
Yanacocha Gold Mill, Peru
• Under construction for initial production in 2008
• Maintains current gold sales outlook
Akyem, Ghana
• Deferred construction pending permitting, power availability and
optimization of project economics
Slide 13
Investment Portfolio
2006
• Estimated Royalty and Other Income of $105 - $115 million
Long-Term Wealth Creation
1) Alberta Heavy Oil: $20 million Investment $280 million Proceeds
2) Canadian Oil Sands Trust: $200 million Investment >$800 million
Value
3) Other Assets:
• Iron Ore and Coal
• Arctic Gas
• Gold Refineries
4) $153 Million Investment in Shore Gold Inc.’s FALC – Diamond Project
Slide 14
7
8. Newmont:
A World Leading Gold Company
• Founded in 1921, Publicly traded since 1925
• Market Capitalization $20 Billion1
• Only Gold Stock in the S&P 500 and Fortune 500
• Most Liquid Gold Stock Approximately $350 Million/Day1
• 32 Million Acres of Land in the World’s Best Gold Districts
• Industry Leading Balance Sheet and Financial Flexibility
• Gold Price Leverage ”No Gold Hedging” Philosophy
1. Market Capitalization based on 12/11/2006 share price of $47.45 and 450.2m shares outstanding and a 2005 average share
price of $42.24 and 448.5m shares outstanding.
Slide 15
8